
 Login Sign Up


| |||||
 |  | ||||

| 12Stocks.com Market Intelligence |
Best MidCap Stocks
|
| In a hurry? Mid Cap Stocks Lists: Performance Trends Table, Stock Charts
Sort midcap stocks: Daily, Weekly, Year-to-Date, Market Cap & Trends. Filter midcap stocks list by sector: Show all, Tech, Finance, Energy, Staples, Retail, Industrial, Materials, Utilities and HealthCare Filter midcap stocks list by size:All MidCap Large Mid-Range Small |
| 12Stocks.com Mid Cap Stocks Performances & Trends Daily | |||||||||
|
|  The overall Smart Investing & Trading Score is 83 (0-bearish to 100-bullish) which puts Mid Cap index in short term bullish trend. The Smart Investing & Trading Score from previous trading session is 56 and hence an improvement of trend.
| ||||||||
Here are the Smart Investing & Trading Scores of the most requested mid cap stocks at 12Stocks.com (click stock name for detailed review):
|


| 12Stocks.com: Top Performing Mid Cap Index Stocks | ||||||||||||||||||||||||||||||||||||||||||||||||
 The top performing Mid Cap Index stocks year to date are
Now, more recently, over last week, the top performing Mid Cap Index stocks on the move are


|
||||||||||||||||||||||||||||||||||||||||||||||||
| 12Stocks.com: Investing in Midcap Index with Stocks | |
|
The following table helps investors and traders sort through current performance and trends (as measured by Smart Investing & Trading Score) of various
stocks in the Midcap Index. Quick View: Move mouse or cursor over stock symbol (ticker) to view short-term technical chart and over stock name to view long term chart. Click on  to add stock symbol to your watchlist and to add stock symbol to your watchlist and  to view watchlist. Click on any ticker or stock name for detailed market intelligence report for that stock. to view watchlist. Click on any ticker or stock name for detailed market intelligence report for that stock. |
12Stocks.com Performance of Stocks in Midcap Index
| Ticker | Stock Name | Watchlist | Category | Recent Price | Smart Investing & Trading Score | Change % | YTD Change% |
| SEE | Sealed Air |   | Consumer Staples | 38.87 | 93 | 3.13% | 6.43% |
| MRO | Marathon Oil | | Energy | 28.96 | 93 | 2.66% | 19.87% |
| SON | Sonoco Products | | Consumer Staples | 61.37 | 93 | 2.37% | 9.84% |
| IVZ | Invesco | | Financials | 15.71 | 93 | 2.28% | -11.94% |
| BIIB | Biogen | | Health Care | 224.94 | 93 | 2.21% | -13.07% |
| COLM | Columbia Sportswear | | Consumer Staples | 85.62 | 93 | 2.15% | 7.64% |
| BK | Bank of New York | | Financials | 59.61 | 93 | 2.04% | 14.52% |
| BERY | Berry Global | | Consumer Staples | 59.88 | 93 | 2.03% | -11.14% |
| BRO | Brown & Brown | | Financials | 89.51 | 93 | 2.01% | 25.88% |
| TROW | T. Rowe | | Financials | 117.83 | 93 | 1.97% | 9.42% |
| UTHR | United | | Health Care | 275.13 | 93 | 1.73% | 25.12% |
| SNV | Synovus Financial | | Financials | 39.69 | 93 | 1.72% | 5.42% |
| AJG | Arthur J. | | Financials | 253.33 | 93 | 1.70% | 12.65% |
| SEB | Seaboard | | Industrials | 3341.13 | 93 | 1.62% | -6.41% |
| OC | Owens Corning | | Industrials | 181.07 | 93 | 1.60% | 22.15% |
| DKS | DICK S | | Services & Goods | 227.64 | 93 | 1.55% | 54.91% |
| THC | Tenet | | Health Care | 135.22 | 93 | 1.54% | 78.93% |
| JLL | Jones Lang | | Financials | 202.07 | 93 | 1.54% | 6.99% |
| PCG | PG&E | | Utilities | 18.54 | 93 | 1.42% | 2.83% |
| VRSK | Verisk Analytics | | Services & Goods | 252.78 | 93 | 1.37% | 5.83% |
| LPX | Louisiana-Pacific | | Services & Goods | 91.68 | 93 | 1.05% | 29.44% |
| CLH | Clean Harbors | | Industrials | 216.59 | 93 | 1.04% | 24.11% |
| HLI | Houlihan Lokey | | Financials | 135.35 | 93 | 1.01% | 12.88% |
| CCK | Crown | | Consumer Staples | 84.19 | 93 | 0.90% | -8.58% |
| ADC | Agree Realty | | Financials | 60.76 | 93 | 0.83% | -3.48% |
| For chart view version of above stock list: Chart View ➞ 0 - 25 , 25 - 50 , 50 - 75 , 75 - 100 , 100 - 125 , 125 - 150 , 150 - 175 , 175 - 200 , 200 - 225 , 225 - 250 , 250 - 275 , 275 - 300 , 300 - 325 , 325 - 350 , 350 - 375 , 375 - 400 , 400 - 425 , 425 - 450 , 450 - 475 , 475 - 500 , 500 - 525 , 525 - 550 , 550 - 575 , 575 - 600 , 600 - 625 , 625 - 650 , 650 - 675 , 675 - 700 , 700 - 725 , 725 - 750 , 750 - 775 | ||
 | Click To Change The Sort Order: By Market Cap or Company Size Performance: Year-to-date, Week and Day |  |
|
Get the most comprehensive stock market coverage daily at 12Stocks.com ➞ Best Stocks Today ➞ Best Stocks Weekly ➞ Best Stocks Year-to-Date ➞ Best Stocks Trends ➞  Best Stocks Today 12Stocks.com Best Nasdaq Stocks ➞ Best S&P 500 Stocks ➞ Best Tech Stocks ➞ Best Biotech Stocks ➞ |
| Detailed Overview of Midcap Stocks |
| Midcap Technical Overview, Leaders & Laggards, Top Midcap ETF Funds & Detailed Midcap Stocks List, Charts, Trends & More |
| Midcap: Technical Analysis, Trends & YTD Performance | |
| MidCap segment as represented by
MDY, an exchange-traded fund [ETF], holds basket of about four hundred midcap stocks from across all major sectors of the US stock market. The midcap index (contains stocks like Green Mountain Coffee Roasters and Tractor Supply Company) is up by 7.65% and is currently underperforming the overall market by -2.14% year-to-date. Below is a quick view of technical charts and trends: | |
 MDY Weekly Chart |
|
| Long Term Trend: Very Good | |
| Medium Term Trend: Good | |
 MDY Daily Chart |
|
| Short Term Trend: Very Good | |
| Overall Trend Score: 83 | |
| YTD Performance: 7.65% | |
| **Trend Scores & Views Are Only For Educational Purposes And Not For Investing | |
| 12Stocks.com: Investing in Midcap Index using Exchange Traded Funds | |
|
The following table shows list of key exchange traded funds (ETF) that
help investors track Midcap index. The following list also includes leveraged ETF funds that track twice or thrice the daily returns of Midcap indices. Short or inverse ETF funds move in the opposite direction to the index they track and are useful during market pullbacks or during bear markets. Quick View: Move mouse or cursor over ETF symbol (ticker) to view short-term technical chart and over ETF name to view long term chart. Click on ticker or stock name for detailed view. Click on to add stock symbol to your watchlist and to view watchlist. |
12Stocks.com List of ETFs that track Midcap Index
| Ticker | ETF Name | Watchlist | Recent Price | Smart Investing & Trading Score | Change % | Week % | Year-to-date % |
| IJH | iShares Core S&P Mid-Cap | | 59.68 | 83 | 1.31 | 0.27 | 7.67% |
| MDY | SPDR S&P MidCap 400 ETF | | 546.18 | 83 | 1.32 | 0.29 | 7.65% |
| IWR | iShares Russell Mid-Cap | | 81.91 | 71 | 0.91 | -0.65 | 5.38% |
| IWP | iShares Russell Mid-Cap Growth | | 108.67 | 8 | 0.21 | -2.18 | 4.03% |
| IWS | iShares Russell Mid-Cap Value | | 123.18 | 83 | 1.27 | -0.02 | 5.92% |
| IJK | iShares S&P Mid-Cap 400 Growth | | 88.41 | 46 | -0.32 | -1.5 | 11.6% |
| UMDD | ProShares UltraPro MidCap400 | | 25.80 | 83 | 3.74 | 0.49 | 15.59% |
| IJJ | iShares S&P Mid-Cap 400 Value | | 114.94 | 63 | 0.45 | -0.39 | 0.79% |
| MYY | ProShares Short MidCap400 | | 20.24 | 25 | -1.20 | -0.26 | -5.64% |
| SMDD | ProShares UltraPro Short MidCap400 | | 10.84 | 17 | -3.99 | -0.66 | -19.49% |
| XMLV | PowerShares S&P MidCap Low Volatil ETF | | 55.65 | 61 | 0.67 | -0.47 | 4.64% |
| MVV | ProShares Ultra MidCap400 | | 63.30 | 63 | 0.08 | -2.01 | 9.35% |
| MZZ | ProShares UltraShort MidCap400 | | 11.08 | 27 | -2.35 | -0.36 | -11.83% |
| 12Stocks.com: Charts, Trends, Fundamental Data and Performances of MidCap Stocks | |
|
We now take in-depth look at all MidCap stocks including charts, multi-period performances and overall trends (as measured by Smart Investing & Trading Score). One can sort MidCap stocks (click link to choose) by Daily, Weekly and by Year-to-Date performances. Also, one can sort by size of the company or by market capitalization. |
| Select Your Default Chart Type: | |||||
| |||||
| Click on stock symbol or name for detailed view. Click on to add stock symbol to your watchlist and to view watchlist. Quick View: Move mouse or cursor over "Daily" to quickly view daily technical stock chart and over "Weekly" to view weekly technical stock chart. | |||||

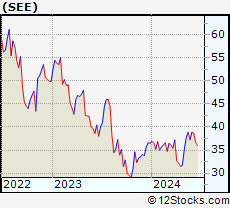 | SEE Sealed Air Corporation |
| Sector: Consumer Staples | |
| SubSector: Packaging & Containers | |
| MarketCap: 4037.23 Millions | |
| Recent Price: 38.87 Smart Investing & Trading Score: 93 | |
| Day Percent Change: 3.13% Day Change: 1.18 | |
| Week Change: 4.41% Year-to-date Change: 6.4% | |
| SEE Links: Profile News Message Board | |
| Charts:- Daily , Weekly | |
| Add SEE to Watchlist: View: Get Complete SEE Trend Analysis ➞ | |
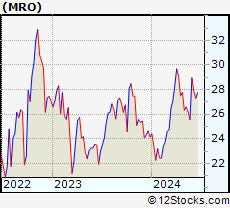 | MRO Marathon Oil Corporation |
| Sector: Energy | |
| SubSector: Independent Oil & Gas | |
| MarketCap: 2911.53 Millions | |
| Recent Price: 28.96 Smart Investing & Trading Score: 93 | |
| Day Percent Change: 2.66% Day Change: 0.75 | |
| Week Change: 13.3% Year-to-date Change: 19.9% | |
| MRO Links: Profile News Message Board | |
| Charts:- Daily , Weekly | |
| Add MRO to Watchlist: View: Get Complete MRO Trend Analysis ➞ | |
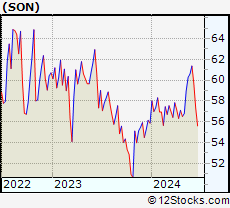 | SON Sonoco Products Company |
| Sector: Consumer Staples | |
| SubSector: Packaging & Containers | |
| MarketCap: 4564.33 Millions | |
| Recent Price: 61.37 Smart Investing & Trading Score: 93 | |
| Day Percent Change: 2.37% Day Change: 1.42 | |
| Week Change: 1.25% Year-to-date Change: 9.8% | |
| SON Links: Profile News Message Board | |
| Charts:- Daily , Weekly | |
| Add SON to Watchlist: View: Get Complete SON Trend Analysis ➞ | |
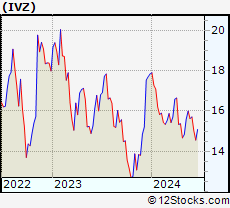 | IVZ Invesco Ltd. |
| Sector: Financials | |
| SubSector: Asset Management | |
| MarketCap: 4578.23 Millions | |
| Recent Price: 15.71 Smart Investing & Trading Score: 93 | |
| Day Percent Change: 2.28% Day Change: 0.35 | |
| Week Change: 0.51% Year-to-date Change: -11.9% | |
| IVZ Links: Profile News Message Board | |
| Charts:- Daily , Weekly | |
| Add IVZ to Watchlist: View: Get Complete IVZ Trend Analysis ➞ | |
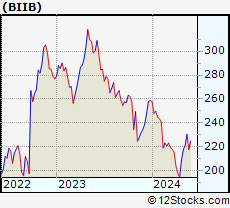 | BIIB Biogen Inc. |
| Sector: Health Care | |
| SubSector: Biotechnology | |
| MarketCap: 53102.6 Millions | |
| Recent Price: 224.94 Smart Investing & Trading Score: 93 | |
| Day Percent Change: 2.21% Day Change: 4.87 | |
| Week Change: 3.27% Year-to-date Change: -13.1% | |
| BIIB Links: Profile News Message Board | |
| Charts:- Daily , Weekly | |
| Add BIIB to Watchlist: View: Get Complete BIIB Trend Analysis ➞ | |
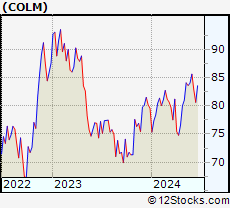 | COLM Columbia Sportswear Company |
| Sector: Consumer Staples | |
| SubSector: Textile - Apparel Clothing | |
| MarketCap: 4371.75 Millions | |
| Recent Price: 85.62 Smart Investing & Trading Score: 93 | |
| Day Percent Change: 2.15% Day Change: 1.80 | |
| Week Change: 1.89% Year-to-date Change: 7.6% | |
| COLM Links: Profile News Message Board | |
| Charts:- Daily , Weekly | |
| Add COLM to Watchlist: View: Get Complete COLM Trend Analysis ➞ | |
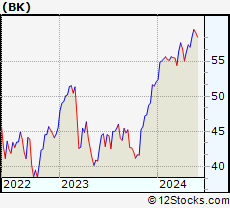 | BK The Bank of New York Mellon Corporation |
| Sector: Financials | |
| SubSector: Asset Management | |
| MarketCap: 29807.5 Millions | |
| Recent Price: 59.61 Smart Investing & Trading Score: 93 | |
| Day Percent Change: 2.04% Day Change: 1.19 | |
| Week Change: 0.88% Year-to-date Change: 14.5% | |
| BK Links: Profile News Message Board | |
| Charts:- Daily , Weekly | |
| Add BK to Watchlist: View: Get Complete BK Trend Analysis ➞ | |
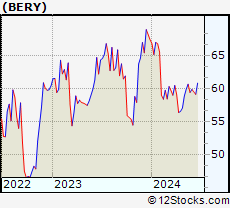 | BERY Berry Global Group, Inc. |
| Sector: Consumer Staples | |
| SubSector: Packaging & Containers | |
| MarketCap: 4349.33 Millions | |
| Recent Price: 59.88 Smart Investing & Trading Score: 93 | |
| Day Percent Change: 2.03% Day Change: 1.19 | |
| Week Change: 0.77% Year-to-date Change: -11.1% | |
| BERY Links: Profile News Message Board | |
| Charts:- Daily , Weekly | |
| Add BERY to Watchlist: View: Get Complete BERY Trend Analysis ➞ | |
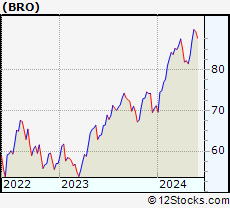 | BRO Brown & Brown, Inc. |
| Sector: Financials | |
| SubSector: Insurance Brokers | |
| MarketCap: 10475.7 Millions | |
| Recent Price: 89.51 Smart Investing & Trading Score: 93 | |
| Day Percent Change: 2.01% Day Change: 1.76 | |
| Week Change: 0.17% Year-to-date Change: 25.9% | |
| BRO Links: Profile News Message Board | |
| Charts:- Daily , Weekly | |
| Add BRO to Watchlist: View: Get Complete BRO Trend Analysis ➞ | |
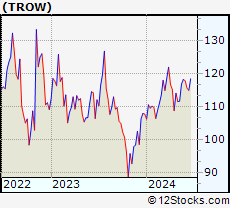 | TROW T. Rowe Price Group, Inc. |
| Sector: Financials | |
| SubSector: Asset Management | |
| MarketCap: 24530 Millions | |
| Recent Price: 117.83 Smart Investing & Trading Score: 93 | |
| Day Percent Change: 1.97% Day Change: 2.28 | |
| Week Change: -0.31% Year-to-date Change: 9.4% | |
| TROW Links: Profile News Message Board | |
| Charts:- Daily , Weekly | |
| Add TROW to Watchlist: View: Get Complete TROW Trend Analysis ➞ | |
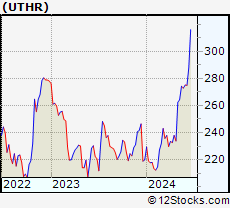 | UTHR United Therapeutics Corporation |
| Sector: Health Care | |
| SubSector: Biotechnology | |
| MarketCap: 3980.75 Millions | |
| Recent Price: 275.13 Smart Investing & Trading Score: 93 | |
| Day Percent Change: 1.73% Day Change: 4.68 | |
| Week Change: 0.82% Year-to-date Change: 25.1% | |
| UTHR Links: Profile News Message Board | |
| Charts:- Daily , Weekly | |
| Add UTHR to Watchlist: View: Get Complete UTHR Trend Analysis ➞ | |
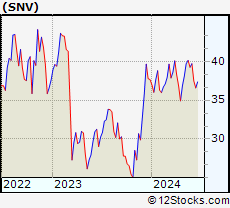 | SNV Synovus Financial Corp. |
| Sector: Financials | |
| SubSector: Regional - Mid-Atlantic Banks | |
| MarketCap: 2697.29 Millions | |
| Recent Price: 39.69 Smart Investing & Trading Score: 93 | |
| Day Percent Change: 1.72% Day Change: 0.67 | |
| Week Change: 1.15% Year-to-date Change: 5.4% | |
| SNV Links: Profile News Message Board | |
| Charts:- Daily , Weekly | |
| Add SNV to Watchlist: View: Get Complete SNV Trend Analysis ➞ | |
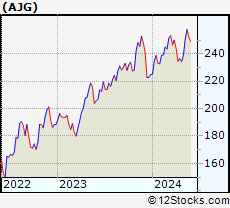 | AJG Arthur J. Gallagher & Co. |
| Sector: Financials | |
| SubSector: Insurance Brokers | |
| MarketCap: 14852.2 Millions | |
| Recent Price: 253.33 Smart Investing & Trading Score: 93 | |
| Day Percent Change: 1.70% Day Change: 4.24 | |
| Week Change: 0.5% Year-to-date Change: 12.7% | |
| AJG Links: Profile News Message Board | |
| Charts:- Daily , Weekly | |
| Add AJG to Watchlist: View: Get Complete AJG Trend Analysis ➞ | |
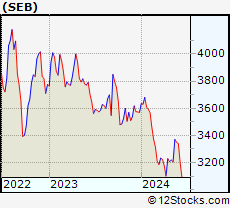 | SEB Seaboard Corporation |
| Sector: Industrials | |
| SubSector: Conglomerates | |
| MarketCap: 3161.78 Millions | |
| Recent Price: 3341.13 Smart Investing & Trading Score: 93 | |
| Day Percent Change: 1.62% Day Change: 53.13 | |
| Week Change: -0.26% Year-to-date Change: -6.4% | |
| SEB Links: Profile News Message Board | |
| Charts:- Daily , Weekly | |
| Add SEB to Watchlist: View: Get Complete SEB Trend Analysis ➞ | |
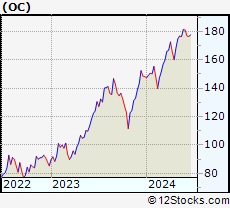 | OC Owens Corning |
| Sector: Industrials | |
| SubSector: General Building Materials | |
| MarketCap: 3686.73 Millions | |
| Recent Price: 181.07 Smart Investing & Trading Score: 93 | |
| Day Percent Change: 1.60% Day Change: 2.85 | |
| Week Change: -0.15% Year-to-date Change: 22.2% | |
| OC Links: Profile News Message Board | |
| Charts:- Daily , Weekly | |
| Add OC to Watchlist: View: Get Complete OC Trend Analysis ➞ | |
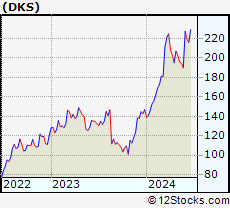 | DKS DICK S Sporting Goods, Inc. |
| Sector: Services & Goods | |
| SubSector: Sporting Goods Stores | |
| MarketCap: 1672.04 Millions | |
| Recent Price: 227.64 Smart Investing & Trading Score: 93 | |
| Day Percent Change: 1.55% Day Change: 3.48 | |
| Week Change: 19.83% Year-to-date Change: 54.9% | |
| DKS Links: Profile News Message Board | |
| Charts:- Daily , Weekly | |
| Add DKS to Watchlist: View: Get Complete DKS Trend Analysis ➞ | |
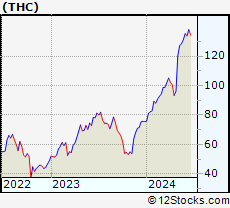 | THC Tenet Healthcare Corporation |
| Sector: Health Care | |
| SubSector: Hospitals | |
| MarketCap: 1544.46 Millions | |
| Recent Price: 135.22 Smart Investing & Trading Score: 93 | |
| Day Percent Change: 1.54% Day Change: 2.05 | |
| Week Change: 3.12% Year-to-date Change: 78.9% | |
| THC Links: Profile News Message Board | |
| Charts:- Daily , Weekly | |
| Add THC to Watchlist: View: Get Complete THC Trend Analysis ➞ | |
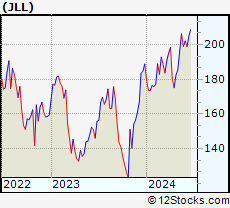 | JLL Jones Lang LaSalle Incorporated |
| Sector: Financials | |
| SubSector: Property Management | |
| MarketCap: 5259.32 Millions | |
| Recent Price: 202.07 Smart Investing & Trading Score: 93 | |
| Day Percent Change: 1.54% Day Change: 3.07 | |
| Week Change: 1.54% Year-to-date Change: 7.0% | |
| JLL Links: Profile News Message Board | |
| Charts:- Daily , Weekly | |
| Add JLL to Watchlist: View: Get Complete JLL Trend Analysis ➞ | |
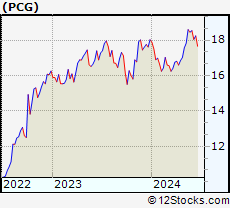 | PCG PG&E Corporation |
| Sector: Utilities | |
| SubSector: Electric Utilities | |
| MarketCap: 5078.04 Millions | |
| Recent Price: 18.54 Smart Investing & Trading Score: 93 | |
| Day Percent Change: 1.42% Day Change: 0.26 | |
| Week Change: 0.43% Year-to-date Change: 2.8% | |
| PCG Links: Profile News Message Board | |
| Charts:- Daily , Weekly | |
| Add PCG to Watchlist: View: Get Complete PCG Trend Analysis ➞ | |
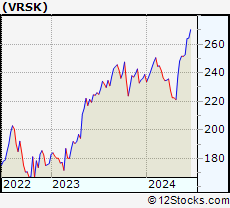 | VRSK Verisk Analytics, Inc. |
| Sector: Services & Goods | |
| SubSector: Business Services | |
| MarketCap: 22033.2 Millions | |
| Recent Price: 252.78 Smart Investing & Trading Score: 93 | |
| Day Percent Change: 1.37% Day Change: 3.41 | |
| Week Change: 0.48% Year-to-date Change: 5.8% | |
| VRSK Links: Profile News Message Board | |
| Charts:- Daily , Weekly | |
| Add VRSK to Watchlist: View: Get Complete VRSK Trend Analysis ➞ | |
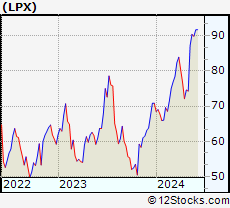 | LPX Louisiana-Pacific Corporation |
| Sector: Services & Goods | |
| SubSector: Building Materials Wholesale | |
| MarketCap: 1943.43 Millions | |
| Recent Price: 91.68 Smart Investing & Trading Score: 93 | |
| Day Percent Change: 1.05% Day Change: 0.95 | |
| Week Change: 2% Year-to-date Change: 29.4% | |
| LPX Links: Profile News Message Board | |
| Charts:- Daily , Weekly | |
| Add LPX to Watchlist: View: Get Complete LPX Trend Analysis ➞ | |
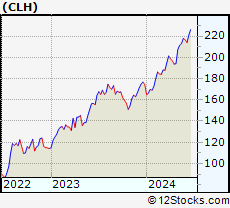 | CLH Clean Harbors, Inc. |
| Sector: Industrials | |
| SubSector: Waste Management | |
| MarketCap: 2391.28 Millions | |
| Recent Price: 216.59 Smart Investing & Trading Score: 93 | |
| Day Percent Change: 1.04% Day Change: 2.22 | |
| Week Change: -0.58% Year-to-date Change: 24.1% | |
| CLH Links: Profile News Message Board | |
| Charts:- Daily , Weekly | |
| Add CLH to Watchlist: View: Get Complete CLH Trend Analysis ➞ | |
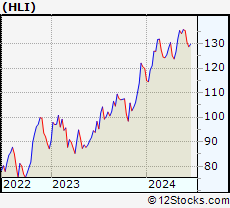 | HLI Houlihan Lokey, Inc. |
| Sector: Financials | |
| SubSector: Investment Brokerage - National | |
| MarketCap: 3352.65 Millions | |
| Recent Price: 135.35 Smart Investing & Trading Score: 93 | |
| Day Percent Change: 1.01% Day Change: 1.35 | |
| Week Change: -0.27% Year-to-date Change: 12.9% | |
| HLI Links: Profile News Message Board | |
| Charts:- Daily , Weekly | |
| Add HLI to Watchlist: View: Get Complete HLI Trend Analysis ➞ | |
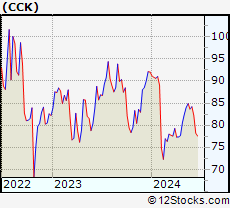 | CCK Crown Holdings, Inc. |
| Sector: Consumer Staples | |
| SubSector: Packaging & Containers | |
| MarketCap: 7198.03 Millions | |
| Recent Price: 84.19 Smart Investing & Trading Score: 93 | |
| Day Percent Change: 0.90% Day Change: 0.75 | |
| Week Change: 0.62% Year-to-date Change: -8.6% | |
| CCK Links: Profile News Message Board | |
| Charts:- Daily , Weekly | |
| Add CCK to Watchlist: View: Get Complete CCK Trend Analysis ➞ | |
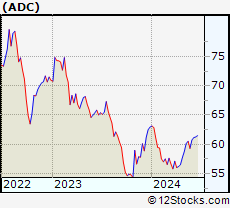 | ADC Agree Realty Corporation |
| Sector: Financials | |
| SubSector: Property Management | |
| MarketCap: 2573.82 Millions | |
| Recent Price: 60.76 Smart Investing & Trading Score: 93 | |
| Day Percent Change: 0.83% Day Change: 0.50 | |
| Week Change: 2.44% Year-to-date Change: -3.5% | |
| ADC Links: Profile News Message Board | |
| Charts:- Daily , Weekly | |
| Add ADC to Watchlist: View: Get Complete ADC Trend Analysis ➞ | |
| For tabular summary view of above stock list: Summary View ➞ 0 - 25 , 25 - 50 , 50 - 75 , 75 - 100 , 100 - 125 , 125 - 150 , 150 - 175 , 175 - 200 , 200 - 225 , 225 - 250 , 250 - 275 , 275 - 300 , 300 - 325 , 325 - 350 , 350 - 375 , 375 - 400 , 400 - 425 , 425 - 450 , 450 - 475 , 475 - 500 , 500 - 525 , 525 - 550 , 550 - 575 , 575 - 600 , 600 - 625 , 625 - 650 , 650 - 675 , 675 - 700 , 700 - 725 , 725 - 750 , 750 - 775 | ||
| Click To Change The Sort Order: By Market Cap or Company Size Performance: Year-to-date, Week and Day | |
| Select Chart Type: | ||
|
Best Stocks Today 12Stocks.com |
© 2024 12Stocks.com Terms & Conditions Privacy Contact Us
All Information Provided Only For Education And Not To Be Used For Investing or Trading. See Terms & Conditions


One More Thing ... Get Best Stocks Delivered Daily!
Never Ever Miss A Move With Our Top Ten Stocks Lists
Find Best Stocks In Any Market - Bull or Bear Market
Take A Peek At Our Top Ten Stocks Lists: Daily, Weekly, Year-to-Date & Top Trends
Find Best Stocks In Any Market - Bull or Bear Market
Take A Peek At Our Top Ten Stocks Lists: Daily, Weekly, Year-to-Date & Top Trends
Midcap Stocks With Best Up Trends [0-bearish to 100-bullish]: Gap [100], Boston Beer[100], Nordstrom [100], Best Buy[100], NetApp [100], HEICO [100], Edison [100], Otis Worldwide[100], Clearway Energy[100], CenterPoint Energy[100], Ventas [100]
Best Midcap Stocks Year-to-Date:
Vistra Energy[157.22%], CAVA [112.86%], AppLovin [104.75%], Constellation Energy[85.51%], EMCOR [80.41%], Tenet [78.93%], ShockWave Medical[75.67%], Tandem Diabetes[73.23%], Natera [70.07%], Pure Storage[69.07%], Crocs [66.62%] Best Midcap Stocks This Week:
Gap [38.04%], GameStop [21.79%], Boston Beer[20.3%], DICK S[19.83%], Burlington Stores[19.8%], Best Buy[18.63%], Peloton Interactive[15.56%], Olaplex [13.38%], Marathon Oil[13.3%], CAVA [11.6%], HP [11.45%] Best Midcap Stocks Daily:
Gap [28.60%], Boston Beer[22.33%], Penn National[19.62%], Elastic N.V[11.67%], Caesars Entertainment[11.65%], Olaplex [9.88%], Zscaler [8.50%], V.F [7.70%], Medical Properties[7.20%], Kohl s[6.52%], Victorias Secret[5.56%]