
 Login Sign Up


| |||||
 |  | ||||

| 12Stocks.com Market Intelligence |
Best Industrial Stocks
| In a hurry? Industrial Stocks Lists: Performance Trends Table, Stock Charts
Sort Industrial stocks: Daily, Weekly, Year-to-Date, Market Cap & Trends. Filter Industrial stocks list by size:All Industrial Large Mid-Range Small |
| 12Stocks.com Industrial Stocks Performances & Trends Daily | |||||||||
|
|  The overall Smart Investing & Trading Score is 63 (0-bearish to 100-bullish) which puts Industrial sector in short term neutral to bullish trend. The Smart Investing & Trading Score from previous trading session is 33 and hence an improvement of trend.
| ||||||||
Here are the Smart Investing & Trading Scores of the most requested Industrial stocks at 12Stocks.com (click stock name for detailed review):
|


| 12Stocks.com: Investing in Industrial sector with Stocks | |
|
The following table helps investors and traders sort through current performance and trends (as measured by Smart Investing & Trading Score) of various
stocks in the Industrial sector. Quick View: Move mouse or cursor over stock symbol (ticker) to view short-term Technical chart and over stock name to view long term chart. Click on  to add stock symbol to your watchlist and to add stock symbol to your watchlist and  to view watchlist. Click on any ticker or stock name for detailed market intelligence report for that stock. to view watchlist. Click on any ticker or stock name for detailed market intelligence report for that stock. |
12Stocks.com Performance of Stocks in Industrial Sector
| Ticker | Stock Name | Watchlist | Category | Recent Price | Smart Investing & Trading Score | Change % | YTD Change% |
| TPIC | TPI Composites |   | Machinery | 5.48 | 100 | 12.07 | 32.37% |
| AMSC | American Superconductor | | Electrical Equipment | 19.20 | 100 | 10.28 | 72.35% |
| SPLP | Steel Partners | | Conglomerates | 39.00 | 78 | 6.02 | -2.50% |
| FSS | Federal Signal | | Pollution & Treatment Controls | 92.02 | 100 | 5.47 | 19.91% |
| SRCL | Stericycle | | Waste Mgmt | 51.54 | 74 | 4.54 | 4.00% |
| BZH | Beazer Homes | | Residential | 28.72 | 50 | 4.51 | -15.00% |
| AMBI | Ambipar Emergency | | Waste Mgmt | 3.55 | 44 | 4.41 | -54.84% |
| ULCC | Frontier | | Airlines | 5.47 | 37 | 4.39 | 0.74% |
| OSIS | OSI Systems | | Electrical Equipment | 143.74 | 93 | 4.30 | 11.38% |
| BIOX | Bioceres Crop | | Conglomerates | 11.78 | 39 | 4.06 | -14.20% |
| EVEX | Eve Holding | | Aerospace & Defense | 4.93 | 32 | 4.01 | -33.02% |
| EVLV | Evolv Technologies | | Security & Protection | 2.87 | 53 | 3.99 | -39.30% |
| ZIM | ZIM Integrated | | Marine Shipping | 22.54 | 100 | 3.97 | 133.21% |
| KAI | Kadant | | Machinery | 286.01 | 50 | 3.92 | 2.03% |
| MIDD | Middleby | | Machinery | 128.91 | 32 | 3.88 | -12.41% |
| NPO | EnPro Industries | | Equipment | 153.26 | 49 | 3.86 | -2.22% |
| JELD | JELD-WEN Holding | | Building Materials | 15.51 | 32 | 3.82 | -17.85% |
| SNCY | Sun Country | | Airlines | 10.59 | 39 | 3.72 | -33.04% |
| CSTE | Caesarstone | | Building Materials | 5.98 | 68 | 3.46 | 59.89% |
| RXO | RXO | | Trucking | 20.41 | 42 | 3.39 | -12.67% |
| BWXT | BWX Technologies | | Aerospace/Defense | 92.13 | 39 | 3.22 | 20.07% |
| PRTH | Priority Technology | | Conglomerates | 4.57 | 68 | 3.16 | 28.37% |
| HEI | HEICO | | Aerospace/Defense | 221.77 | 100 | 3.10 | 23.98% |
| GRC | Gorman-Rupp | | Machinery | 34.54 | 64 | 3.07 | -2.79% |
| NVR | NVR | | Residential | 7680.73 | 45 | 3.02 | 9.72% |
| For chart view version of above stock list: Chart View ➞ 0 - 25 , 25 - 50 , 50 - 75 , 75 - 100 , 100 - 125 , 125 - 150 , 150 - 175 , 175 - 200 , 200 - 225 , 225 - 250 , 250 - 275 , 275 - 300 | ||
 | Click To Change The Sort Order: By Market Cap or Company Size Performance: Year-to-date, Week and Day |  |
|
Get the most comprehensive stock market coverage daily at 12Stocks.com ➞ Best Stocks Today ➞ Best Stocks Weekly ➞ Best Stocks Year-to-Date ➞ Best Stocks Trends ➞  Best Stocks Today 12Stocks.com Best Nasdaq Stocks ➞ Best S&P 500 Stocks ➞ Best Tech Stocks ➞ Best Biotech Stocks ➞ |
| Detailed Overview of Industrial Stocks |
| Industrial Technical Overview, Leaders & Laggards, Top Industrial ETF Funds & Detailed Industrial Stocks List, Charts, Trends & More |
| Industrial Sector: Technical Analysis, Trends & YTD Performance | |
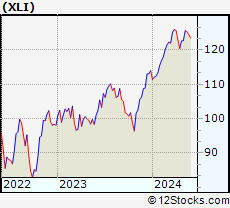
| Industrial sector is composed of stocks
from industrial machinery, aerospace, defense, farm/construction
and industrial services subsectors. Industrial sector, as represented by XLI, an exchange-traded fund [ETF] that holds basket of Industrial stocks (e.g, Caterpillar, Boeing) is up by 8.35% and is currently underperforming the overall market by -1.44% year-to-date. Below is a quick view of Technical charts and trends: |
|
 XLI Weekly Chart |
|
| Long Term Trend: Good | |
| Medium Term Trend: Not Good | |
 XLI Daily Chart |
|
| Short Term Trend: Very Good | |
| Overall Trend Score: 63 | |
| YTD Performance: 8.35% | |
| **Trend Scores & Views Are Only For Educational Purposes And Not For Investing | |
| 12Stocks.com: Top Performing Industrial Sector Stocks | ||||||||||||||||||||||||||||||||||||||||||||||||
 The top performing Industrial sector stocks year to date are
Now, more recently, over last week, the top performing Industrial sector stocks on the move are


|
||||||||||||||||||||||||||||||||||||||||||||||||
| 12Stocks.com: Investing in Industrial Sector using Exchange Traded Funds | |
|
The following table shows list of key exchange traded funds (ETF) that
help investors track Industrial Index. For detailed view, check out our ETF Funds section of our website. Quick View: Move mouse or cursor over ETF symbol (ticker) to view short-term Technical chart and over ETF name to view long term chart. Click on ticker or stock name for detailed view. Click on to add stock symbol to your watchlist and to view watchlist. |
12Stocks.com List of ETFs that track Industrial Index
| Ticker | ETF Name | Watchlist | Recent Price | Smart Investing & Trading Score | Change % | Week % | Year-to-date % |
| XLI | Industrial | | 123.51 | 63 | 1.21 | -0.76 | 8.35% |
| UXI | Industrials | | 32.79 | 56 | 2.26 | -1.76 | 13.86% |
| PPA | Aerospace & Defense | | 105.02 | 76 | 1.24 | -0.36 | 13.95% |
| ITA | Aerospace & Defense | | 136.02 | 93 | 1.67 | 0.35 | 7.44% |
| ITB | Home Construction | | 106.17 | 32 | 1.46 | 1.3 | 4.36% |
| XHB | Homebuilders | | 105.30 | 58 | 1.33 | 0.14 | 10.08% |
| SIJ | Short Industrials | | 9.84 | 32 | -2.18 | 1.7 | -13.23% |
| IYJ | Industrials | | 119.99 | 7 | -0.34 | -2.53 | 4.92% |
| EXI | Global Industrials | | 137.73 | 46 | 0.03 | -1.56 | 8.08% |
| VIS | Industrials | | 235.46 | 26 | -0.37 | -2.47 | 6.82% |
| PSCI | SmallCap Industrials | | 123.80 | 81 | 1.63 | -0.44 | 6.77% |
| XAR | Aerospace & Defense | | 141.95 | 81 | 0.20 | -1.03 | 4.82% |
| ARKQ | ARK Industrial Innovation | | 53.95 | 38 | -0.65 | -3.85 | -6.5% |
| 12Stocks.com: Charts, Trends, Fundamental Data and Performances of Industrial Stocks | |
|
We now take in-depth look at all Industrial stocks including charts, multi-period performances and overall trends (as measured by Smart Investing & Trading Score). One can sort Industrial stocks (click link to choose) by Daily, Weekly and by Year-to-Date performances. Also, one can sort by size of the company or by market capitalization. |
| Select Your Default Chart Type: | |||||
| |||||
| Click on stock symbol or name for detailed view. Click on to add stock symbol to your watchlist and to view watchlist. Quick View: Move mouse or cursor over "Daily" to quickly view daily Technical stock chart and over "Weekly" to view weekly Technical stock chart. | |||||

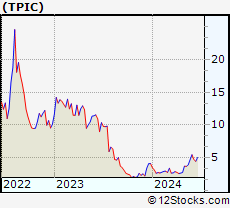 | TPIC TPI Composites, Inc. |
| Sector: Industrials | |
| SubSector: Diversified Machinery | |
| MarketCap: 451.016 Millions | |
| Recent Price: 5.48 Smart Investing & Trading Score: 100 | |
| Day Percent Change: 12.07% Day Change: 0.59 | |
| Week Change: 15.61% Year-to-date Change: 32.4% | |
| TPIC Links: Profile News Message Board | |
| Charts:- Daily , Weekly | |
| Add TPIC to Watchlist: View: Get Complete TPIC Trend Analysis ➞ | |
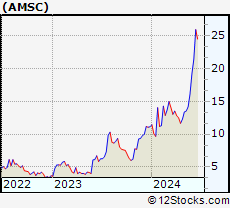 | AMSC American Superconductor Corporation |
| Sector: Industrials | |
| SubSector: Industrial Electrical Equipment | |
| MarketCap: 114.879 Millions | |
| Recent Price: 19.20 Smart Investing & Trading Score: 100 | |
| Day Percent Change: 10.28% Day Change: 1.79 | |
| Week Change: 19.55% Year-to-date Change: 72.4% | |
| AMSC Links: Profile News Message Board | |
| Charts:- Daily , Weekly | |
| Add AMSC to Watchlist: View: Get Complete AMSC Trend Analysis ➞ | |
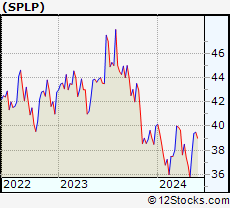 | SPLP Steel Partners Holdings L.P. |
| Sector: Industrials | |
| SubSector: Conglomerates | |
| MarketCap: 167.148 Millions | |
| Recent Price: 39.00 Smart Investing & Trading Score: 78 | |
| Day Percent Change: 6.02% Day Change: 2.21 | |
| Week Change: -1.27% Year-to-date Change: -2.5% | |
| SPLP Links: Profile News Message Board | |
| Charts:- Daily , Weekly | |
| Add SPLP to Watchlist: View: Get Complete SPLP Trend Analysis ➞ | |
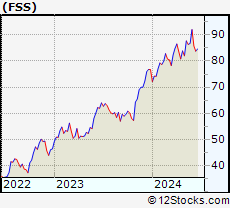 | FSS Federal Signal Corporation |
| Sector: Industrials | |
| SubSector: Pollution & Treatment Controls | |
| MarketCap: 1694.05 Millions | |
| Recent Price: 92.02 Smart Investing & Trading Score: 100 | |
| Day Percent Change: 5.47% Day Change: 4.77 | |
| Week Change: 6.07% Year-to-date Change: 19.9% | |
| FSS Links: Profile News Message Board | |
| Charts:- Daily , Weekly | |
| Add FSS to Watchlist: View: Get Complete FSS Trend Analysis ➞ | |
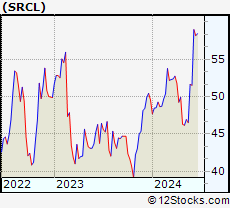 | SRCL Stericycle, Inc. |
| Sector: Industrials | |
| SubSector: Waste Management | |
| MarketCap: 4285.78 Millions | |
| Recent Price: 51.54 Smart Investing & Trading Score: 74 | |
| Day Percent Change: 4.54% Day Change: 2.24 | |
| Week Change: -0.21% Year-to-date Change: 4.0% | |
| SRCL Links: Profile News Message Board | |
| Charts:- Daily , Weekly | |
| Add SRCL to Watchlist: View: Get Complete SRCL Trend Analysis ➞ | |
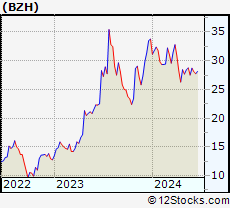 | BZH Beazer Homes USA, Inc. |
| Sector: Industrials | |
| SubSector: Residential Construction | |
| MarketCap: 180.106 Millions | |
| Recent Price: 28.72 Smart Investing & Trading Score: 50 | |
| Day Percent Change: 4.51% Day Change: 1.24 | |
| Week Change: 4.32% Year-to-date Change: -15.0% | |
| BZH Links: Profile News Message Board | |
| Charts:- Daily , Weekly | |
| Add BZH to Watchlist: View: Get Complete BZH Trend Analysis ➞ | |
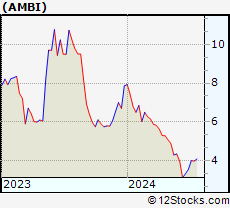 | AMBI Ambipar Emergency Response |
| Sector: Industrials | |
| SubSector: Waste Management | |
| MarketCap: 462 Millions | |
| Recent Price: 3.55 Smart Investing & Trading Score: 44 | |
| Day Percent Change: 4.41% Day Change: 0.15 | |
| Week Change: 6.6% Year-to-date Change: -54.8% | |
| AMBI Links: Profile News Message Board | |
| Charts:- Daily , Weekly | |
| Add AMBI to Watchlist: View: Get Complete AMBI Trend Analysis ➞ | |
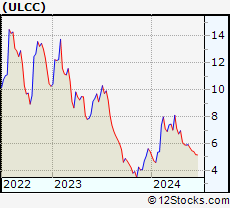 | ULCC Frontier Group Holdings, Inc. |
| Sector: Industrials | |
| SubSector: Airlines | |
| MarketCap: 2160 Millions | |
| Recent Price: 5.47 Smart Investing & Trading Score: 37 | |
| Day Percent Change: 4.39% Day Change: 0.23 | |
| Week Change: -3.78% Year-to-date Change: 0.7% | |
| ULCC Links: Profile News Message Board | |
| Charts:- Daily , Weekly | |
| Add ULCC to Watchlist: View: Get Complete ULCC Trend Analysis ➞ | |
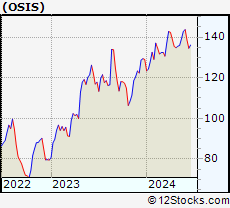 | OSIS OSI Systems, Inc. |
| Sector: Industrials | |
| SubSector: Industrial Electrical Equipment | |
| MarketCap: 1100.39 Millions | |
| Recent Price: 143.74 Smart Investing & Trading Score: 93 | |
| Day Percent Change: 4.30% Day Change: 5.93 | |
| Week Change: 0.63% Year-to-date Change: 11.4% | |
| OSIS Links: Profile News Message Board | |
| Charts:- Daily , Weekly | |
| Add OSIS to Watchlist: View: Get Complete OSIS Trend Analysis ➞ | |
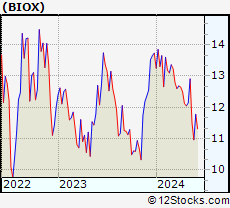 | BIOX Bioceres Crop Solutions Corp. |
| Sector: Industrials | |
| SubSector: Conglomerates | |
| MarketCap: 198.348 Millions | |
| Recent Price: 11.78 Smart Investing & Trading Score: 39 | |
| Day Percent Change: 4.06% Day Change: 0.46 | |
| Week Change: 7.43% Year-to-date Change: -14.2% | |
| BIOX Links: Profile News Message Board | |
| Charts:- Daily , Weekly | |
| Add BIOX to Watchlist: View: Get Complete BIOX Trend Analysis ➞ | |
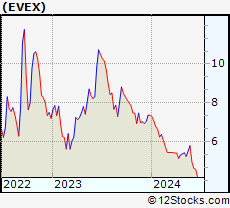 | EVEX Eve Holding, Inc. |
| Sector: Industrials | |
| SubSector: Aerospace & Defense | |
| MarketCap: 2830 Millions | |
| Recent Price: 4.93 Smart Investing & Trading Score: 32 | |
| Day Percent Change: 4.01% Day Change: 0.19 | |
| Week Change: -14.71% Year-to-date Change: -33.0% | |
| EVEX Links: Profile News Message Board | |
| Charts:- Daily , Weekly | |
| Add EVEX to Watchlist: View: Get Complete EVEX Trend Analysis ➞ | |
 | EVLV Evolv Technologies Holdings, Inc. |
| Sector: Industrials | |
| SubSector: Security & Protection Services | |
| MarketCap: 853 Millions | |
| Recent Price: 2.87 Smart Investing & Trading Score: 53 | |
| Day Percent Change: 3.99% Day Change: 0.11 | |
| Week Change: 1.24% Year-to-date Change: -39.3% | |
| EVLV Links: Profile News Message Board | |
| Charts:- Daily , Weekly | |
| Add EVLV to Watchlist: View: Get Complete EVLV Trend Analysis ➞ | |
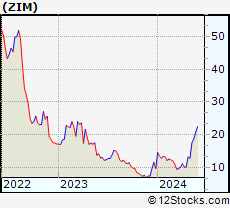 | ZIM ZIM Integrated Shipping Services Ltd. |
| Sector: Industrials | |
| SubSector: Marine Shipping | |
| MarketCap: 1500 Millions | |
| Recent Price: 22.54 Smart Investing & Trading Score: 100 | |
| Day Percent Change: 3.97% Day Change: 0.86 | |
| Week Change: 8.34% Year-to-date Change: 133.2% | |
| ZIM Links: Profile News Message Board | |
| Charts:- Daily , Weekly | |
| Add ZIM to Watchlist: View: Get Complete ZIM Trend Analysis ➞ | |
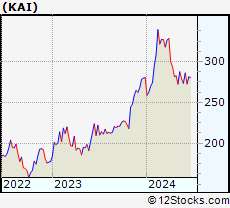 | KAI Kadant Inc. |
| Sector: Industrials | |
| SubSector: Diversified Machinery | |
| MarketCap: 787.116 Millions | |
| Recent Price: 286.01 Smart Investing & Trading Score: 50 | |
| Day Percent Change: 3.92% Day Change: 10.80 | |
| Week Change: 4.68% Year-to-date Change: 2.0% | |
| KAI Links: Profile News Message Board | |
| Charts:- Daily , Weekly | |
| Add KAI to Watchlist: View: Get Complete KAI Trend Analysis ➞ | |
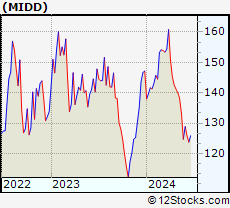 | MIDD The Middleby Corporation |
| Sector: Industrials | |
| SubSector: Diversified Machinery | |
| MarketCap: 3070.36 Millions | |
| Recent Price: 128.91 Smart Investing & Trading Score: 32 | |
| Day Percent Change: 3.88% Day Change: 4.82 | |
| Week Change: 3.35% Year-to-date Change: -12.4% | |
| MIDD Links: Profile News Message Board | |
| Charts:- Daily , Weekly | |
| Add MIDD to Watchlist: View: Get Complete MIDD Trend Analysis ➞ | |
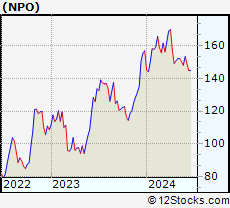 | NPO EnPro Industries, Inc. |
| Sector: Industrials | |
| SubSector: Industrial Equipment & Components | |
| MarketCap: 734.309 Millions | |
| Recent Price: 153.26 Smart Investing & Trading Score: 49 | |
| Day Percent Change: 3.86% Day Change: 5.69 | |
| Week Change: 3.59% Year-to-date Change: -2.2% | |
| NPO Links: Profile News Message Board | |
| Charts:- Daily , Weekly | |
| Add NPO to Watchlist: View: Get Complete NPO Trend Analysis ➞ | |
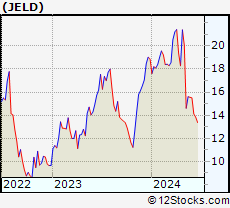 | JELD JELD-WEN Holding, Inc. |
| Sector: Industrials | |
| SubSector: General Building Materials | |
| MarketCap: 1022.53 Millions | |
| Recent Price: 15.51 Smart Investing & Trading Score: 32 | |
| Day Percent Change: 3.82% Day Change: 0.57 | |
| Week Change: -0.32% Year-to-date Change: -17.9% | |
| JELD Links: Profile News Message Board | |
| Charts:- Daily , Weekly | |
| Add JELD to Watchlist: View: Get Complete JELD Trend Analysis ➞ | |
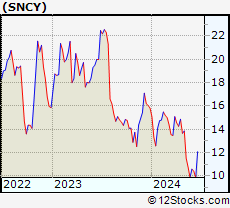 | SNCY Sun Country Airlines Holdings, Inc. |
| Sector: Industrials | |
| SubSector: Airlines | |
| MarketCap: 1230 Millions | |
| Recent Price: 10.59 Smart Investing & Trading Score: 39 | |
| Day Percent Change: 3.72% Day Change: 0.38 | |
| Week Change: 7.29% Year-to-date Change: -33.0% | |
| SNCY Links: Profile News Message Board | |
| Charts:- Daily , Weekly | |
| Add SNCY to Watchlist: View: Get Complete SNCY Trend Analysis ➞ | |
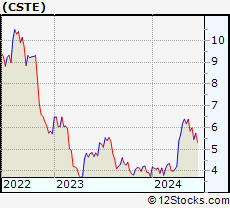 | CSTE Caesarstone Ltd. |
| Sector: Industrials | |
| SubSector: General Building Materials | |
| MarketCap: 338.653 Millions | |
| Recent Price: 5.98 Smart Investing & Trading Score: 68 | |
| Day Percent Change: 3.46% Day Change: 0.20 | |
| Week Change: 2.4% Year-to-date Change: 59.9% | |
| CSTE Links: Profile News Message Board | |
| Charts:- Daily , Weekly | |
| Add CSTE to Watchlist: View: Get Complete CSTE Trend Analysis ➞ | |
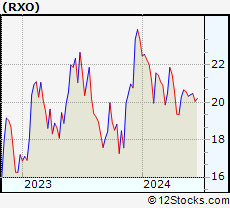 | RXO RXO, Inc. |
| Sector: Industrials | |
| SubSector: Trucking | |
| MarketCap: 2550 Millions | |
| Recent Price: 20.41 Smart Investing & Trading Score: 42 | |
| Day Percent Change: 3.39% Day Change: 0.67 | |
| Week Change: 0.39% Year-to-date Change: -12.7% | |
| RXO Links: Profile News Message Board | |
| Charts:- Daily , Weekly | |
| Add RXO to Watchlist: View: Get Complete RXO Trend Analysis ➞ | |
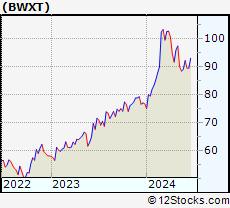 | BWXT BWX Technologies, Inc. |
| Sector: Industrials | |
| SubSector: Aerospace/Defense Products & Services | |
| MarketCap: 4085.41 Millions | |
| Recent Price: 92.13 Smart Investing & Trading Score: 39 | |
| Day Percent Change: 3.22% Day Change: 2.87 | |
| Week Change: 3.51% Year-to-date Change: 20.1% | |
| BWXT Links: Profile News Message Board | |
| Charts:- Daily , Weekly | |
| Add BWXT to Watchlist: View: Get Complete BWXT Trend Analysis ➞ | |
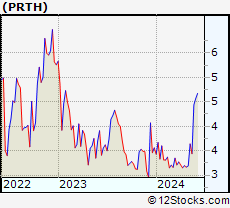 | PRTH Priority Technology Holdings, Inc. |
| Sector: Industrials | |
| SubSector: Conglomerates | |
| MarketCap: 116.548 Millions | |
| Recent Price: 4.57 Smart Investing & Trading Score: 68 | |
| Day Percent Change: 3.16% Day Change: 0.14 | |
| Week Change: 2.93% Year-to-date Change: 28.4% | |
| PRTH Links: Profile News Message Board | |
| Charts:- Daily , Weekly | |
| Add PRTH to Watchlist: View: Get Complete PRTH Trend Analysis ➞ | |
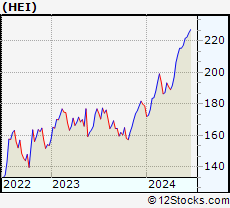 | HEI HEICO Corporation |
| Sector: Industrials | |
| SubSector: Aerospace/Defense Products & Services | |
| MarketCap: 10023.1 Millions | |
| Recent Price: 221.77 Smart Investing & Trading Score: 100 | |
| Day Percent Change: 3.10% Day Change: 6.66 | |
| Week Change: 2.05% Year-to-date Change: 24.0% | |
| HEI Links: Profile News Message Board | |
| Charts:- Daily , Weekly | |
| Add HEI to Watchlist: View: Get Complete HEI Trend Analysis ➞ | |
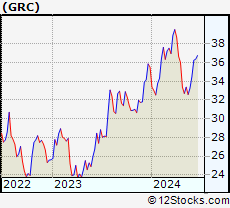 | GRC The Gorman-Rupp Company |
| Sector: Industrials | |
| SubSector: Diversified Machinery | |
| MarketCap: 729.616 Millions | |
| Recent Price: 34.54 Smart Investing & Trading Score: 64 | |
| Day Percent Change: 3.07% Day Change: 1.03 | |
| Week Change: 3.79% Year-to-date Change: -2.8% | |
| GRC Links: Profile News Message Board | |
| Charts:- Daily , Weekly | |
| Add GRC to Watchlist: View: Get Complete GRC Trend Analysis ➞ | |
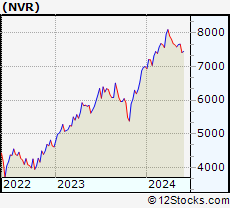 | NVR NVR, Inc. |
| Sector: Industrials | |
| SubSector: Residential Construction | |
| MarketCap: 9912.56 Millions | |
| Recent Price: 7680.73 Smart Investing & Trading Score: 45 | |
| Day Percent Change: 3.02% Day Change: 225.42 | |
| Week Change: 3.57% Year-to-date Change: 9.7% | |
| NVR Links: Profile News Message Board | |
| Charts:- Daily , Weekly | |
| Add NVR to Watchlist: View: Get Complete NVR Trend Analysis ➞ | |
| For tabular summary view of above stock list: Summary View ➞ 0 - 25 , 25 - 50 , 50 - 75 , 75 - 100 , 100 - 125 , 125 - 150 , 150 - 175 , 175 - 200 , 200 - 225 , 225 - 250 , 250 - 275 , 275 - 300 | ||
| Click To Change The Sort Order: By Market Cap or Company Size Performance: Year-to-date, Week and Day | |
| Select Chart Type: | ||
|
Best Stocks Today 12Stocks.com |
© 2024 12Stocks.com Terms & Conditions Privacy Contact Us
All Information Provided Only For Education And Not To Be Used For Investing or Trading. See Terms & Conditions


One More Thing ... Get Best Stocks Delivered Daily!
Never Ever Miss A Move With Our Top Ten Stocks Lists
Find Best Stocks In Any Market - Bull or Bear Market
Take A Peek At Our Top Ten Stocks Lists: Daily, Weekly, Year-to-Date & Top Trends
Find Best Stocks In Any Market - Bull or Bear Market
Take A Peek At Our Top Ten Stocks Lists: Daily, Weekly, Year-to-Date & Top Trends
Industrial Stocks With Best Up Trends [0-bearish to 100-bullish]: TPI Composites[100], American Superconductor[100], Federal Signal[100], ZIM Integrated[100], HEICO [100], Otis Worldwide[100], Fluor [100], Argan [100], TransDigm [100], Southland [100], Enerpac Tool[100]
Best Industrial Stocks Year-to-Date:
NuScale Power[170.7%], Tutor Perini[142.42%], ZIM Integrated[133.21%], FTAI Infrastructure[119.79%], Intuitive Machines[106.17%], Powell Industries[103.46%], IES [92.44%], Aspen Aerogels[89.61%], EMCOR [80.41%], Redwire [80.35%], American Superconductor[72.35%] Best Industrial Stocks This Week:
Southland [20.94%], American Superconductor[19.55%], NuScale Power[17.73%], TPI Composites[15.61%], BiomX [14.29%], Himalaya Shipping[9.79%], ZIM Integrated[8.34%], Loma Negra[7.65%], Bioceres Crop[7.43%], Sun Country[7.29%], Ambipar Emergency[6.6%] Best Industrial Stocks Daily:
TPI Composites[12.07%], American Superconductor[10.28%], Steel Partners[6.02%], Federal Signal[5.47%], Stericycle [4.54%], Beazer Homes[4.51%], Ambipar Emergency[4.41%], Frontier [4.39%], OSI Systems[4.30%], Bioceres Crop[4.06%], Eve Holding[4.01%]