
 Login Sign Up


| |||||
 |  | ||||

| 12Stocks.com Market Intelligence |
Best Healthcare Stocks
 | "Discover best trending healthcare stocks with 12Stocks.com." |
| - Subu Vdaygiri, Founder, 12Stocks.com |
| In a hurry? Healthcare Stocks Lists: Performance Trends Table, Stock Charts
Sort Healthcare stocks: Daily, Weekly, Year-to-Date, Market Cap & Trends. Filter Healthcare stocks list by size:All Healthcare Large Mid-Range Small |
| 12Stocks.com Healthcare Stocks Performances & Trends Daily | |||||||||
|
|  The overall Smart Investing & Trading Score is 55 (0-bearish to 100-bullish) which puts Healthcare sector in short term neutral trend. The Smart Investing & Trading Score from previous trading session is 15 and hence an improvement of trend.
| ||||||||
Here are the Smart Investing & Trading Scores of the most requested Healthcare stocks at 12Stocks.com (click stock name for detailed review):
|


| 12Stocks.com: Investing in Healthcare sector with Stocks | |
|
The following table helps investors and traders sort through current performance and trends (as measured by Smart Investing & Trading Score) of various
stocks in the Healthcare sector. Quick View: Move mouse or cursor over stock symbol (ticker) to view short-term Technical chart and over stock name to view long term chart. Click on  to add stock symbol to your watchlist and to add stock symbol to your watchlist and  to view watchlist. Click on any ticker or stock name for detailed market intelligence report for that stock. to view watchlist. Click on any ticker or stock name for detailed market intelligence report for that stock. |
12Stocks.com Performance of Stocks in Healthcare Sector
| Ticker | Stock Name | Watchlist | Category | Recent Price | Smart Investing & Trading Score | Change % | YTD Change% |
| AIM | AIM ImmunoTech |   | Pharmaceutical | 0.36 | 32 | -0.28 | -17.71% |
| CRMD | CorMedix | | Biotechnology | 5.26 | 53 | -0.28 | 40.03% |
| ADCT | ADC | | Biotechnology | 3.43 | 22 | -0.29 | 106.63% |
| MLSS | Milestone Scientific | | Instruments | 0.73 | 76 | -0.29 | 5.51% |
| ROIV | Roivant Sciences | | Biotechnology | 10.36 | 0 | -0.29 | -6.71% |
| NEOG | Neogen | | Diagnostic | 13.15 | 25 | -0.30 | -34.61% |
| GTHX | G1 | | Biotechnology | 3.30 | 22 | -0.30 | 8.20% |
| ISRG | Intuitive Surgical | | Instruments | 402.12 | 71 | -0.31 | 19.20% |
| PRME | Prime Medicine | | Biotechnology | 6.48 | 55 | -0.31 | -28.95% |
| BLCO | Bausch + | | Instruments | 15.34 | 47 | -0.32 | -9.76% |
| GLTO | Galecto | | Biotechnology | 0.61 | 15 | -0.33 | -15.56% |
| PLRX | Pliant | | Biotechnology | 12.13 | 0 | -0.33 | -33.06% |
| ITGR | Integer | | Equipment | 121.24 | 76 | -0.34 | 22.37% |
| SPRY | ARS | | Biotechnology | 8.88 | 53 | -0.34 | 56.20% |
| IPHA | Innate Pharma | | Biotechnology | 2.74 | 61 | -0.36 | -2.14% |
| BHVN | Biohaven | | Biotechnology | 35.10 | 27 | -0.37 | -17.99% |
| EYPT | EyePoint | | Biotechnology | 10.71 | 20 | -0.37 | -53.66% |
| AVAH | Aveanna | | Medical Care Facilities | 2.61 | 56 | -0.38 | -3.15% |
| RDNT | RadNet | | Laboratories | 58.64 | 68 | -0.39 | 68.65% |
| KURA | Kura Oncology | | Biotechnology | 20.61 | 27 | -0.39 | 43.32% |
| STTK | Shattuck Labs | | Biotechnology | 7.38 | 25 | -0.40 | 3.94% |
| PCRX | Pacira BioSciences | | Pharmaceutical | 30.33 | 93 | -0.43 | -10.11% |
| ATRI | Atrion | | Instruments | 460.25 | 85 | -0.44 | 21.51% |
| JYNT | Joint | | Hospitals | 14.99 | 36 | -0.46 | 55.98% |
| ADXN | Addex | | Biotechnology | 8.60 | 25 | -0.46 | 41.22% |
| For chart view version of above stock list: Chart View ➞ 0 - 25 , 25 - 50 , 50 - 75 , 75 - 100 , 100 - 125 , 125 - 150 , 150 - 175 , 175 - 200 , 200 - 225 , 225 - 250 , 250 - 275 , 275 - 300 , 300 - 325 , 325 - 350 , 350 - 375 , 375 - 400 , 400 - 425 , 425 - 450 , 450 - 475 , 475 - 500 , 500 - 525 , 525 - 550 , 550 - 575 , 575 - 600 , 600 - 625 , 625 - 650 , 650 - 675 , 675 - 700 , 700 - 725 | ||
 | Click To Change The Sort Order: By Market Cap or Company Size Performance: Year-to-date, Week and Day |  |
|
Get the most comprehensive stock market coverage daily at 12Stocks.com ➞ Best Stocks Today ➞ Best Stocks Weekly ➞ Best Stocks Year-to-Date ➞ Best Stocks Trends ➞  Best Stocks Today 12Stocks.com Best Nasdaq Stocks ➞ Best S&P 500 Stocks ➞ Best Tech Stocks ➞ Best Biotech Stocks ➞ |
| Detailed Overview of Healthcare Stocks |
| Healthcare Technical Overview, Leaders & Laggards, Top Healthcare ETF Funds & Detailed Healthcare Stocks List, Charts, Trends & More |
| Healthcare Sector: Technical Analysis, Trends & YTD Performance | |
| Healthcare sector is composed of stocks
from pharmaceutical, biotech, diagnostics labs, insurance providers
and healthcare services. Healthcare sector, as represented by XLV, an exchange-traded fund [ETF] that holds basket of Healthcare stocks (e.g, Merck, Amgen) is up by 5.37% and is currently underperforming the overall market by -4.42% year-to-date. Below is a quick view of Technical charts and trends: |
|
 XLV Weekly Chart |
|
| Long Term Trend: Not Good | |
| Medium Term Trend: Very Good | |
 XLV Daily Chart |
|
| Short Term Trend: Very Good | |
| Overall Trend Score: 55 | |
| YTD Performance: 5.37% | |
| **Trend Scores & Views Are Only For Educational Purposes And Not For Investing | |
| 12Stocks.com: Top Performing Healthcare Sector Stocks | ||||||||||||||||||||||||||||||||||||||||||||||||
 The top performing Healthcare sector stocks year to date are
Now, more recently, over last week, the top performing Healthcare sector stocks on the move are


|
||||||||||||||||||||||||||||||||||||||||||||||||
| 12Stocks.com: Investing in Healthcare Sector using Exchange Traded Funds | |
|
The following table shows list of key exchange traded funds (ETF) that
help investors track Healthcare Index. For detailed view, check out our ETF Funds section of our website. Quick View: Move mouse or cursor over ETF symbol (ticker) to view short-term Technical chart and over ETF name to view long term chart. Click on ticker or stock name for detailed view. Click on to add stock symbol to your watchlist and to view watchlist. |
12Stocks.com List of ETFs that track Healthcare Index
| Ticker | ETF Name | Watchlist | Recent Price | Smart Investing & Trading Score | Change % | Week % | Year-to-date % |
| XLV | Health Care | | 143.70 | 55 | 1.46 | -0.5 | 5.37% |
| XBI | Biotech | | 89.13 | 35 | 0.19 | 0.34 | -0.18% |
| IBB | Biotechnology | | 133.88 | 50 | 0.40 | -1.32 | -1.45% |
| BBH | Biotech | | 164.59 | 86 | 0.39 | -2.06 | -0.44% |
| VHT | Health Care | | 260.81 | 50 | 0.73 | -1.02 | 4.03% |
| IYH | Healthcare | | 59.88 | 50 | 0.73 | -1.19 | 4.6% |
| IHF | Healthcare Providers | | 52.67 | 63 | 2.48 | 0.38 | 0.3% |
| IHI | Medical Devices | | 55.53 | 25 | 0.33 | -0.96 | 2.89% |
| BIB | Biotechnology | | 55.61 | 60 | 0.53 | -1.87 | -2.52% |
| BIS | Short Biotech | | 17.91 | 48 | -1.49 | 1.13 | -0.89% |
| XHE | Health Care Equipment | | 86.31 | 81 | 0.15 | 0.04 | 2.43% |
| CURE | Healthcare Bull 3X | | 111.99 | 62 | 4.17 | -2.02 | 10.07% |
| LABU | Biotech Bull 3X | | 103.29 | 35 | 0.48 | 0.57 | -15.32% |
| LABD | Biotech Bear 3X | | 8.48 | 56 | -0.35 | -1.05 | -12.49% |
| PSCH | SmallCap Health Care | | 43.19 | 76 | 0.84 | 0.35 | 0.91% |
| XHS | Health Care Services | | 91.65 | 93 | 0.45 | 1.33 | 3.04% |
| PTH | DWA Healthcare Momentum | | 41.70 | 42 | 0.12 | -0.67 | 6.54% |
| BTEC | Principal Healthcare Innovators | | 36.06 | 40 | 2.25 | 0.51 | -0.74% |
| RXL | Health Care | | 98.67 | 57 | 2.60 | -1.4 | 7.95% |
| RXD | Short Health Care | | 10.88 | 33 | -3.80 | 0.24 | -8.76% |
| 12Stocks.com: Charts, Trends, Fundamental Data and Performances of Healthcare Stocks | |
|
We now take in-depth look at all Healthcare stocks including charts, multi-period performances and overall trends (as measured by Smart Investing & Trading Score). One can sort Healthcare stocks (click link to choose) by Daily, Weekly and by Year-to-Date performances. Also, one can sort by size of the company or by market capitalization. |
| Select Your Default Chart Type: | |||||
| |||||
| Click on stock symbol or name for detailed view. Click on to add stock symbol to your watchlist and to view watchlist. Quick View: Move mouse or cursor over "Daily" to quickly view daily Technical stock chart and over "Weekly" to view weekly Technical stock chart. | |||||

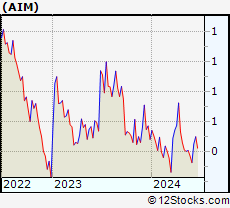 | AIM AIM ImmunoTech Inc. |
| Sector: Health Care | |
| SubSector: Drug Manufacturers - Other | |
| MarketCap: 61.4033 Millions | |
| Recent Price: 0.36 Smart Investing & Trading Score: 32 | |
| Day Percent Change: -0.28% Day Change: 0.00 | |
| Week Change: -5.97% Year-to-date Change: -17.7% | |
| AIM Links: Profile News Message Board | |
| Charts:- Daily , Weekly | |
| Add AIM to Watchlist: View: Get Complete AIM Trend Analysis ➞ | |
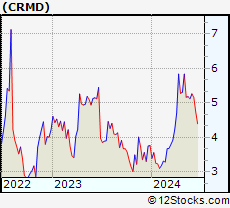 | CRMD CorMedix, Inc. |
| Sector: Health Care | |
| SubSector: Biotechnology | |
| MarketCap: 90.7785 Millions | |
| Recent Price: 5.26 Smart Investing & Trading Score: 53 | |
| Day Percent Change: -0.28% Day Change: -0.02 | |
| Week Change: 2.83% Year-to-date Change: 40.0% | |
| CRMD Links: Profile News Message Board | |
| Charts:- Daily , Weekly | |
| Add CRMD to Watchlist: View: Get Complete CRMD Trend Analysis ➞ | |
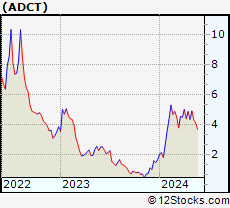 | ADCT ADC Therapeutics SA |
| Sector: Health Care | |
| SubSector: Biotechnology | |
| MarketCap: 26087 Millions | |
| Recent Price: 3.43 Smart Investing & Trading Score: 22 | |
| Day Percent Change: -0.29% Day Change: -0.01 | |
| Week Change: -6.79% Year-to-date Change: 106.6% | |
| ADCT Links: Profile News Message Board | |
| Charts:- Daily , Weekly | |
| Add ADCT to Watchlist: View: Get Complete ADCT Trend Analysis ➞ | |
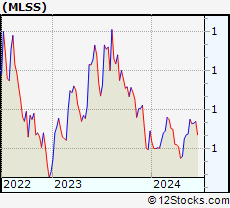 | MLSS Milestone Scientific Inc. |
| Sector: Health Care | |
| SubSector: Medical Instruments & Supplies | |
| MarketCap: 72.186 Millions | |
| Recent Price: 0.73 Smart Investing & Trading Score: 76 | |
| Day Percent Change: -0.29% Day Change: 0.00 | |
| Week Change: -2.95% Year-to-date Change: 5.5% | |
| MLSS Links: Profile News Message Board | |
| Charts:- Daily , Weekly | |
| Add MLSS to Watchlist: View: Get Complete MLSS Trend Analysis ➞ | |
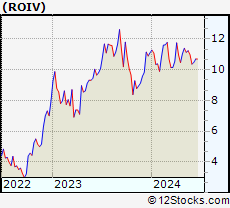 | ROIV Roivant Sciences Ltd. |
| Sector: Health Care | |
| SubSector: Biotechnology | |
| MarketCap: 7780 Millions | |
| Recent Price: 10.36 Smart Investing & Trading Score: 0 | |
| Day Percent Change: -0.29% Day Change: -0.03 | |
| Week Change: -5.65% Year-to-date Change: -6.7% | |
| ROIV Links: Profile News Message Board | |
| Charts:- Daily , Weekly | |
| Add ROIV to Watchlist: View: Get Complete ROIV Trend Analysis ➞ | |
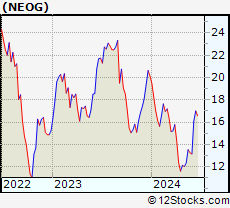 | NEOG Neogen Corporation |
| Sector: Health Care | |
| SubSector: Diagnostic Substances | |
| MarketCap: 3234.71 Millions | |
| Recent Price: 13.15 Smart Investing & Trading Score: 25 | |
| Day Percent Change: -0.30% Day Change: -0.04 | |
| Week Change: -0.83% Year-to-date Change: -34.6% | |
| NEOG Links: Profile News Message Board | |
| Charts:- Daily , Weekly | |
| Add NEOG to Watchlist: View: Get Complete NEOG Trend Analysis ➞ | |
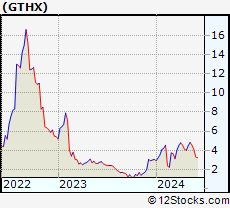 | GTHX G1 Therapeutics, Inc. |
| Sector: Health Care | |
| SubSector: Biotechnology | |
| MarketCap: 484.085 Millions | |
| Recent Price: 3.30 Smart Investing & Trading Score: 22 | |
| Day Percent Change: -0.30% Day Change: -0.01 | |
| Week Change: -19.22% Year-to-date Change: 8.2% | |
| GTHX Links: Profile News Message Board | |
| Charts:- Daily , Weekly | |
| Add GTHX to Watchlist: View: Get Complete GTHX Trend Analysis ➞ | |
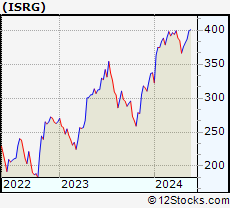 | ISRG Intuitive Surgical, Inc. |
| Sector: Health Care | |
| SubSector: Medical Instruments & Supplies | |
| MarketCap: 50917.5 Millions | |
| Recent Price: 402.12 Smart Investing & Trading Score: 71 | |
| Day Percent Change: -0.31% Day Change: -1.27 | |
| Week Change: -0.67% Year-to-date Change: 19.2% | |
| ISRG Links: Profile News Message Board | |
| Charts:- Daily , Weekly | |
| Add ISRG to Watchlist: View: Get Complete ISRG Trend Analysis ➞ | |
 | PRME Prime Medicine, Inc. |
| Sector: Health Care | |
| SubSector: Biotechnology | |
| MarketCap: 1440 Millions | |
| Recent Price: 6.48 Smart Investing & Trading Score: 55 | |
| Day Percent Change: -0.31% Day Change: -0.02 | |
| Week Change: -9.56% Year-to-date Change: -29.0% | |
| PRME Links: Profile News Message Board | |
| Charts:- Daily , Weekly | |
| Add PRME to Watchlist: View: Get Complete PRME Trend Analysis ➞ | |
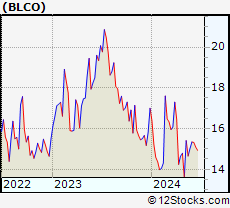 | BLCO Bausch + Lomb Corporation |
| Sector: Health Care | |
| SubSector: Medical Instruments & Supplies | |
| MarketCap: 7100 Millions | |
| Recent Price: 15.34 Smart Investing & Trading Score: 47 | |
| Day Percent Change: -0.32% Day Change: -0.05 | |
| Week Change: 2.13% Year-to-date Change: -9.8% | |
| BLCO Links: Profile News Message Board | |
| Charts:- Daily , Weekly | |
| Add BLCO to Watchlist: View: Get Complete BLCO Trend Analysis ➞ | |
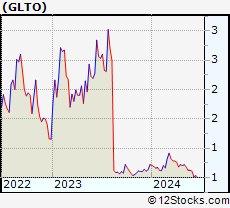 | GLTO Galecto, Inc. |
| Sector: Health Care | |
| SubSector: Biotechnology | |
| MarketCap: 34487 Millions | |
| Recent Price: 0.61 Smart Investing & Trading Score: 15 | |
| Day Percent Change: -0.33% Day Change: 0.00 | |
| Week Change: -2.25% Year-to-date Change: -15.6% | |
| GLTO Links: Profile News Message Board | |
| Charts:- Daily , Weekly | |
| Add GLTO to Watchlist: View: Get Complete GLTO Trend Analysis ➞ | |
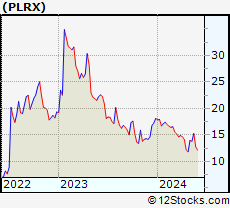 | PLRX Pliant Therapeutics, Inc. |
| Sector: Health Care | |
| SubSector: Biotechnology | |
| MarketCap: 96487 Millions | |
| Recent Price: 12.13 Smart Investing & Trading Score: 0 | |
| Day Percent Change: -0.33% Day Change: -0.04 | |
| Week Change: -4.64% Year-to-date Change: -33.1% | |
| PLRX Links: Profile News Message Board | |
| Charts:- Daily , Weekly | |
| Add PLRX to Watchlist: View: Get Complete PLRX Trend Analysis ➞ | |
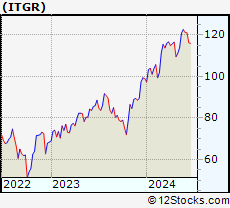 | ITGR Integer Holdings Corporation |
| Sector: Health Care | |
| SubSector: Medical Appliances & Equipment | |
| MarketCap: 1794.8 Millions | |
| Recent Price: 121.24 Smart Investing & Trading Score: 76 | |
| Day Percent Change: -0.34% Day Change: -0.41 | |
| Week Change: -1.13% Year-to-date Change: 22.4% | |
| ITGR Links: Profile News Message Board | |
| Charts:- Daily , Weekly | |
| Add ITGR to Watchlist: View: Get Complete ITGR Trend Analysis ➞ | |
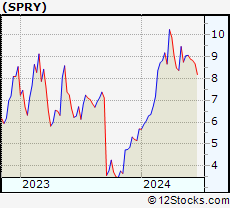 | SPRY ARS Pharmaceuticals, Inc. |
| Sector: Health Care | |
| SubSector: Biotechnology | |
| MarketCap: 632 Millions | |
| Recent Price: 8.88 Smart Investing & Trading Score: 53 | |
| Day Percent Change: -0.34% Day Change: -0.03 | |
| Week Change: -1.88% Year-to-date Change: 56.2% | |
| SPRY Links: Profile News Message Board | |
| Charts:- Daily , Weekly | |
| Add SPRY to Watchlist: View: Get Complete SPRY Trend Analysis ➞ | |
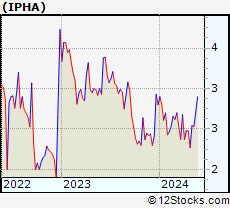 | IPHA Innate Pharma S.A. |
| Sector: Health Care | |
| SubSector: Biotechnology | |
| MarketCap: 309.485 Millions | |
| Recent Price: 2.74 Smart Investing & Trading Score: 61 | |
| Day Percent Change: -0.36% Day Change: -0.01 | |
| Week Change: -7.43% Year-to-date Change: -2.1% | |
| IPHA Links: Profile News Message Board | |
| Charts:- Daily , Weekly | |
| Add IPHA to Watchlist: View: Get Complete IPHA Trend Analysis ➞ | |
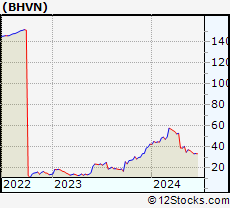 | BHVN Biohaven Pharmaceutical Holding Company Ltd. |
| Sector: Health Care | |
| SubSector: Biotechnology | |
| MarketCap: 2024.25 Millions | |
| Recent Price: 35.10 Smart Investing & Trading Score: 27 | |
| Day Percent Change: -0.37% Day Change: -0.13 | |
| Week Change: -4.41% Year-to-date Change: -18.0% | |
| BHVN Links: Profile News Message Board | |
| Charts:- Daily , Weekly | |
| Add BHVN to Watchlist: View: Get Complete BHVN Trend Analysis ➞ | |
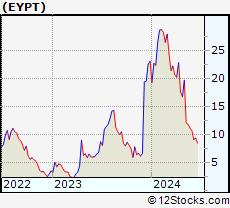 | EYPT EyePoint Pharmaceuticals, Inc. |
| Sector: Health Care | |
| SubSector: Biotechnology | |
| MarketCap: 125.085 Millions | |
| Recent Price: 10.71 Smart Investing & Trading Score: 20 | |
| Day Percent Change: -0.37% Day Change: -0.04 | |
| Week Change: -3.9% Year-to-date Change: -53.7% | |
| EYPT Links: Profile News Message Board | |
| Charts:- Daily , Weekly | |
| Add EYPT to Watchlist: View: Get Complete EYPT Trend Analysis ➞ | |
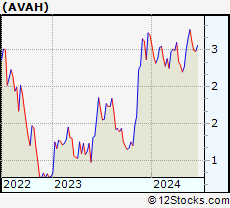 | AVAH Aveanna Healthcare Holdings Inc. |
| Sector: Health Care | |
| SubSector: Medical Care Facilities | |
| MarketCap: 305 Millions | |
| Recent Price: 2.61 Smart Investing & Trading Score: 56 | |
| Day Percent Change: -0.38% Day Change: -0.01 | |
| Week Change: -5.95% Year-to-date Change: -3.2% | |
| AVAH Links: Profile News Message Board | |
| Charts:- Daily , Weekly | |
| Add AVAH to Watchlist: View: Get Complete AVAH Trend Analysis ➞ | |
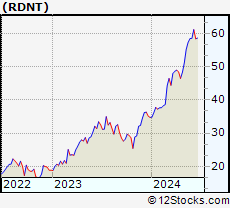 | RDNT RadNet, Inc. |
| Sector: Health Care | |
| SubSector: Medical Laboratories & Research | |
| MarketCap: 473.2 Millions | |
| Recent Price: 58.64 Smart Investing & Trading Score: 68 | |
| Day Percent Change: -0.39% Day Change: -0.23 | |
| Week Change: 0.17% Year-to-date Change: 68.7% | |
| RDNT Links: Profile News Message Board | |
| Charts:- Daily , Weekly | |
| Add RDNT to Watchlist: View: Get Complete RDNT Trend Analysis ➞ | |
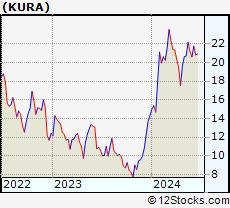 | KURA Kura Oncology, Inc. |
| Sector: Health Care | |
| SubSector: Biotechnology | |
| MarketCap: 401.885 Millions | |
| Recent Price: 20.61 Smart Investing & Trading Score: 27 | |
| Day Percent Change: -0.39% Day Change: -0.08 | |
| Week Change: -2.65% Year-to-date Change: 43.3% | |
| KURA Links: Profile News Message Board | |
| Charts:- Daily , Weekly | |
| Add KURA to Watchlist: View: Get Complete KURA Trend Analysis ➞ | |
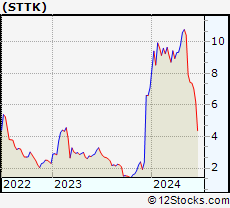 | STTK Shattuck Labs, Inc. |
| Sector: Health Care | |
| SubSector: Biotechnology | |
| MarketCap: 16987 Millions | |
| Recent Price: 7.38 Smart Investing & Trading Score: 25 | |
| Day Percent Change: -0.40% Day Change: -0.03 | |
| Week Change: -0.81% Year-to-date Change: 3.9% | |
| STTK Links: Profile News Message Board | |
| Charts:- Daily , Weekly | |
| Add STTK to Watchlist: View: Get Complete STTK Trend Analysis ➞ | |
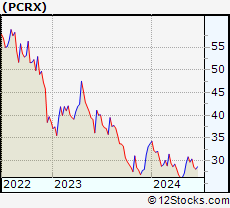 | PCRX Pacira BioSciences, Inc. |
| Sector: Health Care | |
| SubSector: Drugs - Generic | |
| MarketCap: 1403.95 Millions | |
| Recent Price: 30.33 Smart Investing & Trading Score: 93 | |
| Day Percent Change: -0.43% Day Change: -0.13 | |
| Week Change: 2.16% Year-to-date Change: -10.1% | |
| PCRX Links: Profile News Message Board | |
| Charts:- Daily , Weekly | |
| Add PCRX to Watchlist: View: Get Complete PCRX Trend Analysis ➞ | |
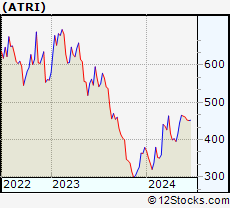 | ATRI Atrion Corporation |
| Sector: Health Care | |
| SubSector: Medical Instruments & Supplies | |
| MarketCap: 1234.6 Millions | |
| Recent Price: 460.25 Smart Investing & Trading Score: 85 | |
| Day Percent Change: -0.44% Day Change: -2.05 | |
| Week Change: -0.58% Year-to-date Change: 21.5% | |
| ATRI Links: Profile News Message Board | |
| Charts:- Daily , Weekly | |
| Add ATRI to Watchlist: View: Get Complete ATRI Trend Analysis ➞ | |
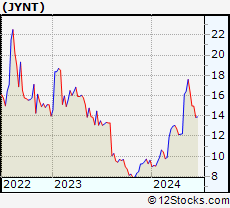 | JYNT The Joint Corp. |
| Sector: Health Care | |
| SubSector: Hospitals | |
| MarketCap: 125.146 Millions | |
| Recent Price: 14.99 Smart Investing & Trading Score: 36 | |
| Day Percent Change: -0.46% Day Change: -0.07 | |
| Week Change: -8.71% Year-to-date Change: 56.0% | |
| JYNT Links: Profile News Message Board | |
| Charts:- Daily , Weekly | |
| Add JYNT to Watchlist: View: Get Complete JYNT Trend Analysis ➞ | |
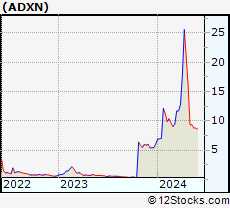 | ADXN Addex Therapeutics Ltd |
| Sector: Health Care | |
| SubSector: Biotechnology | |
| MarketCap: 51487 Millions | |
| Recent Price: 8.60 Smart Investing & Trading Score: 25 | |
| Day Percent Change: -0.46% Day Change: -0.04 | |
| Week Change: -2.11% Year-to-date Change: 41.2% | |
| ADXN Links: Profile News Message Board | |
| Charts:- Daily , Weekly | |
| Add ADXN to Watchlist: View: Get Complete ADXN Trend Analysis ➞ | |
| For tabular summary view of above stock list: Summary View ➞ 0 - 25 , 25 - 50 , 50 - 75 , 75 - 100 , 100 - 125 , 125 - 150 , 150 - 175 , 175 - 200 , 200 - 225 , 225 - 250 , 250 - 275 , 275 - 300 , 300 - 325 , 325 - 350 , 350 - 375 , 375 - 400 , 400 - 425 , 425 - 450 , 450 - 475 , 475 - 500 , 500 - 525 , 525 - 550 , 550 - 575 , 575 - 600 , 600 - 625 , 625 - 650 , 650 - 675 , 675 - 700 , 700 - 725 | ||
| Click To Change The Sort Order: By Market Cap or Company Size Performance: Year-to-date, Week and Day | |
| Select Chart Type: | ||
|
Best Stocks Today 12Stocks.com |
© 2024 12Stocks.com Terms & Conditions Privacy Contact Us
All Information Provided Only For Education And Not To Be Used For Investing or Trading. See Terms & Conditions


One More Thing ... Get Best Stocks Delivered Daily!
Never Ever Miss A Move With Our Top Ten Stocks Lists
Find Best Stocks In Any Market - Bull or Bear Market
Take A Peek At Our Top Ten Stocks Lists: Daily, Weekly, Year-to-Date & Top Trends
Find Best Stocks In Any Market - Bull or Bear Market
Take A Peek At Our Top Ten Stocks Lists: Daily, Weekly, Year-to-Date & Top Trends
Healthcare Stocks With Best Up Trends [0-bearish to 100-bullish]: DURECT [100], AC Immune[100], PureTech Health[100], Heron [100], Agenus [100], Calliditas [100], Humana [100], Addus HomeCare[100], Community Health[100], Novartis AG[100], Universal Health[100]
Best Healthcare Stocks Year-to-Date:
Pieris [5277.75%], Precision BioSciences[3434.25%], Avenue [2036.65%], Inovio [1886.27%], Agenus [1795.16%], Assembly Biosciences[1747.34%], Aurora Cannabis[1199.87%], NuCana [1120.42%], Adverum Biotechnologies[952.07%], Burning Rock[641.01%], GeneDx [620.96%] Best Healthcare Stocks This Week:
Summit [156.95%], Insmed [150.23%], Calliditas [82.02%], Ikena Oncology[35.11%], DURECT [32.69%], Orchestra BioMed[32%], AC Immune[31.36%], Bright Green[28.42%], Arcturus [27.58%], Janux [22.4%], Surmodics [22.34%] Best Healthcare Stocks Daily:
DURECT [27.78%], Exicure [26.55%], Bright Green[23.18%], AC Immune[17.13%], Renalytix AI[15.19%], Accuray [12.74%], Emergent Bio[11.98%], Adaptimmune [11.88%], Sol-Gel Technologies[10.96%], Greenwich LifeSciences[10.59%], Taysha Gene[9.58%]