
 Login Sign Up


| |||||
 |  | ||||

| 12Stocks.com Market Intelligence |
Best Healthcare Stocks
 | "Discover best trending healthcare stocks with 12Stocks.com." |
| - Subu Vdaygiri, Founder, 12Stocks.com |
| In a hurry? Healthcare Stocks Lists: Performance Trends Table, Stock Charts
Sort Healthcare stocks: Daily, Weekly, Year-to-Date, Market Cap & Trends. Filter Healthcare stocks list by size:All Healthcare Large Mid-Range Small |
| 12Stocks.com Healthcare Stocks Performances & Trends Daily | |||||||||
|
|  The overall Smart Investing & Trading Score is 55 (0-bearish to 100-bullish) which puts Healthcare sector in short term neutral trend. The Smart Investing & Trading Score from previous trading session is 15 and hence an improvement of trend.
| ||||||||
Here are the Smart Investing & Trading Scores of the most requested Healthcare stocks at 12Stocks.com (click stock name for detailed review):
|


| 12Stocks.com: Investing in Healthcare sector with Stocks | |
|
The following table helps investors and traders sort through current performance and trends (as measured by Smart Investing & Trading Score) of various
stocks in the Healthcare sector. Quick View: Move mouse or cursor over stock symbol (ticker) to view short-term Technical chart and over stock name to view long term chart. Click on  to add stock symbol to your watchlist and to add stock symbol to your watchlist and  to view watchlist. Click on any ticker or stock name for detailed market intelligence report for that stock. to view watchlist. Click on any ticker or stock name for detailed market intelligence report for that stock. |
12Stocks.com Performance of Stocks in Healthcare Sector
| Ticker | Stock Name | Watchlist | Category | Recent Price | Smart Investing & Trading Score | Change % | YTD Change% |
| DVA | DaVita |   | Specialized | 147.12 | 93 | -0.01 | 40.44% |
| TMDX | TransMedics | | Equipment | 136.40 | 56 | -0.01 | 72.81% |
| QDEL | Quidel | | Diagnostic | 44.19 | 67 | -0.02 | -40.04% |
| AXON | Axovant Sciences | | Biotechnology | 281.67 | 10 | -0.02 | 9.03% |
| RDHL | RedHill Biopharma | | Biotechnology | 0.46 | 40 | -0.04 | -68.62% |
| BRKR | Bruker | | Laboratories | 65.51 | 0 | -0.05 | -10.85% |
| AXNX | Axonics Modulation | | Equipment | 67.09 | 20 | -0.06 | 7.81% |
| DOCS | Doximity | | Health Information | 27.73 | 35 | -0.07 | -2.46% |
| TECH | Bio-Techne | | Biotechnology | 77.19 | 51 | -0.08 | 0.04% |
| SRDX | Surmodics | | Diagnostic | 42.06 | 93 | -0.10 | 15.71% |
| SNDX | Syndax | | Biotechnology | 19.27 | 10 | -0.10 | -10.83% |
| CLLS | Cellectis S.A | | Biotechnology | 2.71 | 48 | -0.11 | -12.01% |
| EHAB | Enhabit | | Medical Care Facilities | 9.19 | 68 | -0.11 | -11.21% |
| PEPG | PepGen | | Biotechnology | 16.33 | 67 | -0.12 | 138.74% |
| PRGO | Perrigo | | Pharmaceutical | 27.53 | 51 | -0.15 | -14.45% |
| STE | STERIS | | Instruments | 222.88 | 50 | -0.15 | 1.38% |
| KYMR | Kymera | | Biotechnology | 32.11 | 10 | -0.16 | 26.37% |
| ALXO | ALX Oncology | | Biotechnology | 10.63 | 10 | -0.19 | -28.56% |
| JAZZ | Jazz | | Biotechnology | 105.25 | 25 | -0.20 | -14.43% |
| APM | Aptorum | | Biotechnology | 4.98 | 58 | -0.20 | 103.38% |
| ANIK | Anika | | Biotechnology | 25.65 | 75 | -0.23 | 13.20% |
| MNPR | Monopar | | Biotechnology | 0.61 | 12 | -0.23 | 77.65% |
| OLK | Olink Holding | | Diagnostics & Research | 23.95 | 59 | -0.25 | -4.88% |
| AIQ | Alliance | | Laboratories | 33.32 | 38 | -0.27 | 6.86% |
| CNTG | Centogene N.V | | Laboratories | 0.37 | 20 | -0.27 | -69.08% |
| For chart view version of above stock list: Chart View ➞ 0 - 25 , 25 - 50 , 50 - 75 , 75 - 100 , 100 - 125 , 125 - 150 , 150 - 175 , 175 - 200 , 200 - 225 , 225 - 250 , 250 - 275 , 275 - 300 , 300 - 325 , 325 - 350 , 350 - 375 , 375 - 400 , 400 - 425 , 425 - 450 , 450 - 475 , 475 - 500 , 500 - 525 , 525 - 550 , 550 - 575 , 575 - 600 , 600 - 625 , 625 - 650 , 650 - 675 , 675 - 700 , 700 - 725 | ||
 | Click To Change The Sort Order: By Market Cap or Company Size Performance: Year-to-date, Week and Day |  |
|
Get the most comprehensive stock market coverage daily at 12Stocks.com ➞ Best Stocks Today ➞ Best Stocks Weekly ➞ Best Stocks Year-to-Date ➞ Best Stocks Trends ➞  Best Stocks Today 12Stocks.com Best Nasdaq Stocks ➞ Best S&P 500 Stocks ➞ Best Tech Stocks ➞ Best Biotech Stocks ➞ |
| Detailed Overview of Healthcare Stocks |
| Healthcare Technical Overview, Leaders & Laggards, Top Healthcare ETF Funds & Detailed Healthcare Stocks List, Charts, Trends & More |
| Healthcare Sector: Technical Analysis, Trends & YTD Performance | |
| Healthcare sector is composed of stocks
from pharmaceutical, biotech, diagnostics labs, insurance providers
and healthcare services. Healthcare sector, as represented by XLV, an exchange-traded fund [ETF] that holds basket of Healthcare stocks (e.g, Merck, Amgen) is up by 5.37% and is currently underperforming the overall market by -4.42% year-to-date. Below is a quick view of Technical charts and trends: |
|
 XLV Weekly Chart |
|
| Long Term Trend: Not Good | |
| Medium Term Trend: Very Good | |
 XLV Daily Chart |
|
| Short Term Trend: Very Good | |
| Overall Trend Score: 55 | |
| YTD Performance: 5.37% | |
| **Trend Scores & Views Are Only For Educational Purposes And Not For Investing | |
| 12Stocks.com: Top Performing Healthcare Sector Stocks | ||||||||||||||||||||||||||||||||||||||||||||||||
 The top performing Healthcare sector stocks year to date are
Now, more recently, over last week, the top performing Healthcare sector stocks on the move are


|
||||||||||||||||||||||||||||||||||||||||||||||||
| 12Stocks.com: Investing in Healthcare Sector using Exchange Traded Funds | |
|
The following table shows list of key exchange traded funds (ETF) that
help investors track Healthcare Index. For detailed view, check out our ETF Funds section of our website. Quick View: Move mouse or cursor over ETF symbol (ticker) to view short-term Technical chart and over ETF name to view long term chart. Click on ticker or stock name for detailed view. Click on to add stock symbol to your watchlist and to view watchlist. |
12Stocks.com List of ETFs that track Healthcare Index
| Ticker | ETF Name | Watchlist | Recent Price | Smart Investing & Trading Score | Change % | Week % | Year-to-date % |
| XLV | Health Care | | 143.70 | 55 | 1.46 | -0.5 | 5.37% |
| XBI | Biotech | | 89.13 | 35 | 0.19 | 0.34 | -0.18% |
| IBB | Biotechnology | | 133.88 | 50 | 0.40 | -1.32 | -1.45% |
| BBH | Biotech | | 164.59 | 86 | 0.39 | -2.06 | -0.44% |
| VHT | Health Care | | 260.81 | 50 | 0.73 | -1.02 | 4.03% |
| IYH | Healthcare | | 59.88 | 50 | 0.73 | -1.19 | 4.6% |
| IHF | Healthcare Providers | | 52.67 | 63 | 2.48 | 0.38 | 0.3% |
| IHI | Medical Devices | | 55.53 | 25 | 0.33 | -0.96 | 2.89% |
| BIB | Biotechnology | | 55.61 | 60 | 0.53 | -1.87 | -2.52% |
| BIS | Short Biotech | | 17.91 | 48 | -1.49 | 1.13 | -0.89% |
| XHE | Health Care Equipment | | 86.31 | 81 | 0.15 | 0.04 | 2.43% |
| CURE | Healthcare Bull 3X | | 111.99 | 62 | 4.17 | -2.02 | 10.07% |
| LABU | Biotech Bull 3X | | 103.29 | 35 | 0.48 | 0.57 | -15.32% |
| LABD | Biotech Bear 3X | | 8.48 | 56 | -0.35 | -1.05 | -12.49% |
| PSCH | SmallCap Health Care | | 43.19 | 76 | 0.84 | 0.35 | 0.91% |
| XHS | Health Care Services | | 91.65 | 93 | 0.45 | 1.33 | 3.04% |
| PTH | DWA Healthcare Momentum | | 41.70 | 42 | 0.12 | -0.67 | 6.54% |
| BTEC | Principal Healthcare Innovators | | 36.06 | 40 | 2.25 | 0.51 | -0.74% |
| RXL | Health Care | | 98.67 | 57 | 2.60 | -1.4 | 7.95% |
| RXD | Short Health Care | | 10.88 | 33 | -3.80 | 0.24 | -8.76% |
| 12Stocks.com: Charts, Trends, Fundamental Data and Performances of Healthcare Stocks | |
|
We now take in-depth look at all Healthcare stocks including charts, multi-period performances and overall trends (as measured by Smart Investing & Trading Score). One can sort Healthcare stocks (click link to choose) by Daily, Weekly and by Year-to-Date performances. Also, one can sort by size of the company or by market capitalization. |
| Select Your Default Chart Type: | |||||
| |||||
| Click on stock symbol or name for detailed view. Click on to add stock symbol to your watchlist and to view watchlist. Quick View: Move mouse or cursor over "Daily" to quickly view daily Technical stock chart and over "Weekly" to view weekly Technical stock chart. | |||||

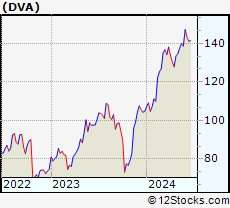 | DVA DaVita Inc. |
| Sector: Health Care | |
| SubSector: Specialized Health Services | |
| MarketCap: 8954.36 Millions | |
| Recent Price: 147.12 Smart Investing & Trading Score: 93 | |
| Day Percent Change: -0.01% Day Change: -0.02 | |
| Week Change: 6.19% Year-to-date Change: 40.4% | |
| DVA Links: Profile News Message Board | |
| Charts:- Daily , Weekly | |
| Add DVA to Watchlist: View: Get Complete DVA Trend Analysis ➞ | |
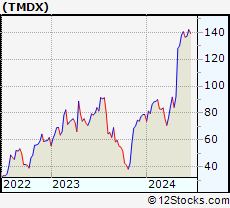 | TMDX TransMedics Group, Inc. |
| Sector: Health Care | |
| SubSector: Medical Appliances & Equipment | |
| MarketCap: 331.68 Millions | |
| Recent Price: 136.40 Smart Investing & Trading Score: 56 | |
| Day Percent Change: -0.01% Day Change: -0.02 | |
| Week Change: -2.89% Year-to-date Change: 72.8% | |
| TMDX Links: Profile News Message Board | |
| Charts:- Daily , Weekly | |
| Add TMDX to Watchlist: View: Get Complete TMDX Trend Analysis ➞ | |
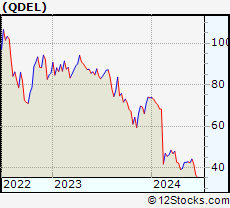 | QDEL Quidel Corporation |
| Sector: Health Care | |
| SubSector: Diagnostic Substances | |
| MarketCap: 4104.91 Millions | |
| Recent Price: 44.19 Smart Investing & Trading Score: 67 | |
| Day Percent Change: -0.02% Day Change: -0.01 | |
| Week Change: 4.22% Year-to-date Change: -40.0% | |
| QDEL Links: Profile News Message Board | |
| Charts:- Daily , Weekly | |
| Add QDEL to Watchlist: View: Get Complete QDEL Trend Analysis ➞ | |
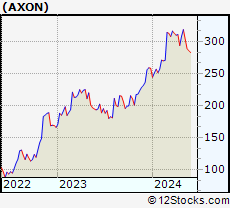 | AXON Axovant Sciences Ltd. |
| Sector: Health Care | |
| SubSector: Biotechnology | |
| MarketCap: 1492.04 Millions | |
| Recent Price: 281.67 Smart Investing & Trading Score: 10 | |
| Day Percent Change: -0.02% Day Change: -0.06 | |
| Week Change: -1.39% Year-to-date Change: 9.0% | |
| AXON Links: Profile News Message Board | |
| Charts:- Daily , Weekly | |
| Add AXON to Watchlist: View: Get Complete AXON Trend Analysis ➞ | |
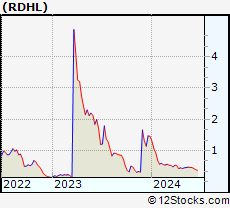 | RDHL RedHill Biopharma Ltd. |
| Sector: Health Care | |
| SubSector: Biotechnology | |
| MarketCap: 138.685 Millions | |
| Recent Price: 0.46 Smart Investing & Trading Score: 40 | |
| Day Percent Change: -0.04% Day Change: 0.00 | |
| Week Change: -1.02% Year-to-date Change: -68.6% | |
| RDHL Links: Profile News Message Board | |
| Charts:- Daily , Weekly | |
| Add RDHL to Watchlist: View: Get Complete RDHL Trend Analysis ➞ | |
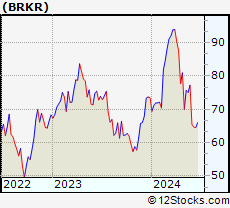 | BRKR Bruker Corporation |
| Sector: Health Care | |
| SubSector: Medical Laboratories & Research | |
| MarketCap: 5932 Millions | |
| Recent Price: 65.51 Smart Investing & Trading Score: 0 | |
| Day Percent Change: -0.05% Day Change: -0.03 | |
| Week Change: -15.2% Year-to-date Change: -10.9% | |
| BRKR Links: Profile News Message Board | |
| Charts:- Daily , Weekly | |
| Add BRKR to Watchlist: View: Get Complete BRKR Trend Analysis ➞ | |
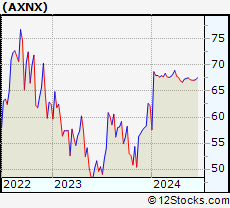 | AXNX Axonics Modulation Technologies, Inc. |
| Sector: Health Care | |
| SubSector: Medical Appliances & Equipment | |
| MarketCap: 692.48 Millions | |
| Recent Price: 67.09 Smart Investing & Trading Score: 20 | |
| Day Percent Change: -0.06% Day Change: -0.04 | |
| Week Change: -0.19% Year-to-date Change: 7.8% | |
| AXNX Links: Profile News Message Board | |
| Charts:- Daily , Weekly | |
| Add AXNX to Watchlist: View: Get Complete AXNX Trend Analysis ➞ | |
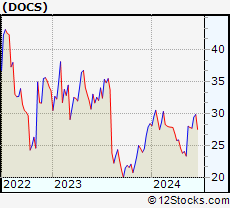 | DOCS Doximity, Inc. |
| Sector: Health Care | |
| SubSector: Health Information Services | |
| MarketCap: 6540 Millions | |
| Recent Price: 27.73 Smart Investing & Trading Score: 35 | |
| Day Percent Change: -0.07% Day Change: -0.02 | |
| Week Change: -0.36% Year-to-date Change: -2.5% | |
| DOCS Links: Profile News Message Board | |
| Charts:- Daily , Weekly | |
| Add DOCS to Watchlist: View: Get Complete DOCS Trend Analysis ➞ | |
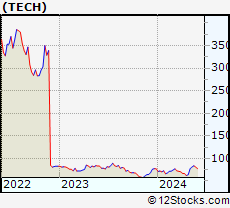 | TECH Bio-Techne Corporation |
| Sector: Health Care | |
| SubSector: Biotechnology | |
| MarketCap: 6958.05 Millions | |
| Recent Price: 77.19 Smart Investing & Trading Score: 51 | |
| Day Percent Change: -0.08% Day Change: -0.06 | |
| Week Change: -4.46% Year-to-date Change: 0.0% | |
| TECH Links: Profile News Message Board | |
| Charts:- Daily , Weekly | |
| Add TECH to Watchlist: View: Get Complete TECH Trend Analysis ➞ | |
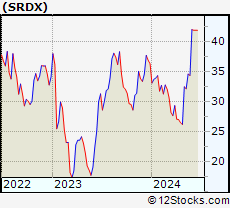 | SRDX Surmodics, Inc. |
| Sector: Health Care | |
| SubSector: Diagnostic Substances | |
| MarketCap: 388.171 Millions | |
| Recent Price: 42.06 Smart Investing & Trading Score: 93 | |
| Day Percent Change: -0.10% Day Change: -0.04 | |
| Week Change: 22.34% Year-to-date Change: 15.7% | |
| SRDX Links: Profile News Message Board | |
| Charts:- Daily , Weekly | |
| Add SRDX to Watchlist: View: Get Complete SRDX Trend Analysis ➞ | |
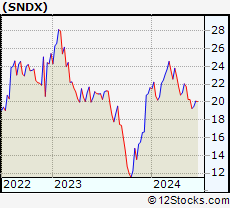 | SNDX Syndax Pharmaceuticals, Inc. |
| Sector: Health Care | |
| SubSector: Biotechnology | |
| MarketCap: 365.985 Millions | |
| Recent Price: 19.27 Smart Investing & Trading Score: 10 | |
| Day Percent Change: -0.10% Day Change: -0.02 | |
| Week Change: -4.98% Year-to-date Change: -10.8% | |
| SNDX Links: Profile News Message Board | |
| Charts:- Daily , Weekly | |
| Add SNDX to Watchlist: View: Get Complete SNDX Trend Analysis ➞ | |
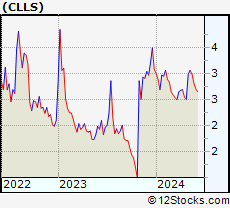 | CLLS Cellectis S.A. |
| Sector: Health Care | |
| SubSector: Biotechnology | |
| MarketCap: 398.685 Millions | |
| Recent Price: 2.71 Smart Investing & Trading Score: 48 | |
| Day Percent Change: -0.11% Day Change: 0.00 | |
| Week Change: -3.9% Year-to-date Change: -12.0% | |
| CLLS Links: Profile News Message Board | |
| Charts:- Daily , Weekly | |
| Add CLLS to Watchlist: View: Get Complete CLLS Trend Analysis ➞ | |
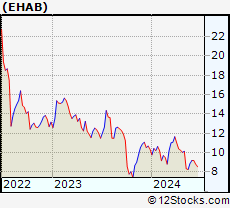 | EHAB Enhabit, Inc. |
| Sector: Health Care | |
| SubSector: Medical Care Facilities | |
| MarketCap: 569 Millions | |
| Recent Price: 9.19 Smart Investing & Trading Score: 68 | |
| Day Percent Change: -0.11% Day Change: -0.01 | |
| Week Change: 3.49% Year-to-date Change: -11.2% | |
| EHAB Links: Profile News Message Board | |
| Charts:- Daily , Weekly | |
| Add EHAB to Watchlist: View: Get Complete EHAB Trend Analysis ➞ | |
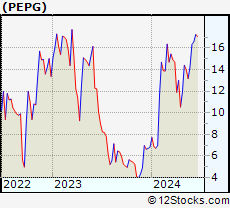 | PEPG PepGen Inc. |
| Sector: Health Care | |
| SubSector: Biotechnology | |
| MarketCap: 216 Millions | |
| Recent Price: 16.33 Smart Investing & Trading Score: 67 | |
| Day Percent Change: -0.12% Day Change: -0.02 | |
| Week Change: 14.72% Year-to-date Change: 138.7% | |
| PEPG Links: Profile News Message Board | |
| Charts:- Daily , Weekly | |
| Add PEPG to Watchlist: View: Get Complete PEPG Trend Analysis ➞ | |
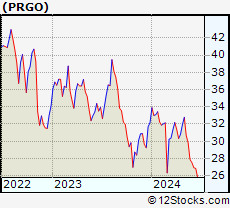 | PRGO Perrigo Company plc |
| Sector: Health Care | |
| SubSector: Drug Related Products | |
| MarketCap: 6493.93 Millions | |
| Recent Price: 27.53 Smart Investing & Trading Score: 51 | |
| Day Percent Change: -0.15% Day Change: -0.04 | |
| Week Change: -1.26% Year-to-date Change: -14.5% | |
| PRGO Links: Profile News Message Board | |
| Charts:- Daily , Weekly | |
| Add PRGO to Watchlist: View: Get Complete PRGO Trend Analysis ➞ | |
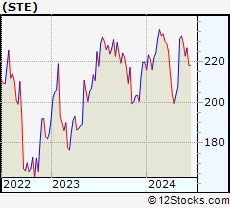 | STE STERIS plc |
| Sector: Health Care | |
| SubSector: Medical Instruments & Supplies | |
| MarketCap: 10875 Millions | |
| Recent Price: 222.88 Smart Investing & Trading Score: 50 | |
| Day Percent Change: -0.15% Day Change: -0.34 | |
| Week Change: -2.74% Year-to-date Change: 1.4% | |
| STE Links: Profile News Message Board | |
| Charts:- Daily , Weekly | |
| Add STE to Watchlist: View: Get Complete STE Trend Analysis ➞ | |
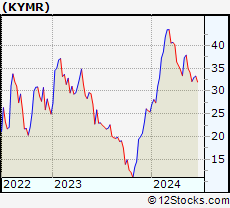 | KYMR Kymera Therapeutics, Inc. |
| Sector: Health Care | |
| SubSector: Biotechnology | |
| MarketCap: 27087 Millions | |
| Recent Price: 32.11 Smart Investing & Trading Score: 10 | |
| Day Percent Change: -0.16% Day Change: -0.05 | |
| Week Change: -5.79% Year-to-date Change: 26.4% | |
| KYMR Links: Profile News Message Board | |
| Charts:- Daily , Weekly | |
| Add KYMR to Watchlist: View: Get Complete KYMR Trend Analysis ➞ | |
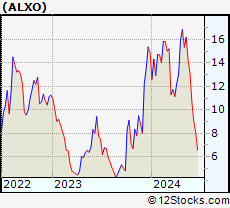 | ALXO ALX Oncology Holdings Inc. |
| Sector: Health Care | |
| SubSector: Biotechnology | |
| MarketCap: 41787 Millions | |
| Recent Price: 10.63 Smart Investing & Trading Score: 10 | |
| Day Percent Change: -0.19% Day Change: -0.02 | |
| Week Change: -19.29% Year-to-date Change: -28.6% | |
| ALXO Links: Profile News Message Board | |
| Charts:- Daily , Weekly | |
| Add ALXO to Watchlist: View: Get Complete ALXO Trend Analysis ➞ | |
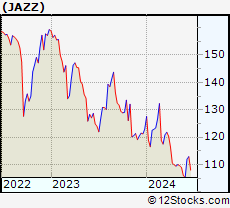 | JAZZ Jazz Pharmaceuticals plc |
| Sector: Health Care | |
| SubSector: Biotechnology | |
| MarketCap: 5576.05 Millions | |
| Recent Price: 105.25 Smart Investing & Trading Score: 25 | |
| Day Percent Change: -0.20% Day Change: -0.21 | |
| Week Change: -0.76% Year-to-date Change: -14.4% | |
| JAZZ Links: Profile News Message Board | |
| Charts:- Daily , Weekly | |
| Add JAZZ to Watchlist: View: Get Complete JAZZ Trend Analysis ➞ | |
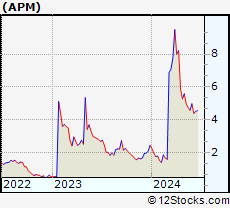 | APM Aptorum Group Limited |
| Sector: Health Care | |
| SubSector: Biotechnology | |
| MarketCap: 88.7785 Millions | |
| Recent Price: 4.98 Smart Investing & Trading Score: 58 | |
| Day Percent Change: -0.20% Day Change: -0.01 | |
| Week Change: 8.5% Year-to-date Change: 103.4% | |
| APM Links: Profile News Message Board | |
| Charts:- Daily , Weekly | |
| Add APM to Watchlist: View: Get Complete APM Trend Analysis ➞ | |
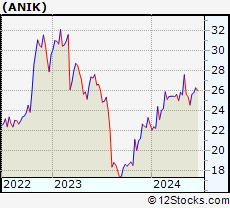 | ANIK Anika Therapeutics, Inc. |
| Sector: Health Care | |
| SubSector: Biotechnology | |
| MarketCap: 438.385 Millions | |
| Recent Price: 25.65 Smart Investing & Trading Score: 75 | |
| Day Percent Change: -0.23% Day Change: -0.06 | |
| Week Change: 4.4% Year-to-date Change: 13.2% | |
| ANIK Links: Profile News Message Board | |
| Charts:- Daily , Weekly | |
| Add ANIK to Watchlist: View: Get Complete ANIK Trend Analysis ➞ | |
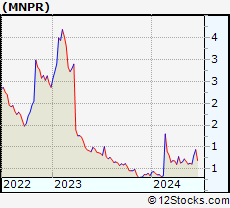 | MNPR Monopar Therapeutics Inc. |
| Sector: Health Care | |
| SubSector: Biotechnology | |
| MarketCap: 71487 Millions | |
| Recent Price: 0.61 Smart Investing & Trading Score: 12 | |
| Day Percent Change: -0.23% Day Change: 0.00 | |
| Week Change: -2.85% Year-to-date Change: 77.7% | |
| MNPR Links: Profile News Message Board | |
| Charts:- Daily , Weekly | |
| Add MNPR to Watchlist: View: Get Complete MNPR Trend Analysis ➞ | |
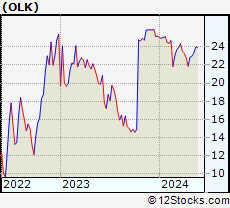 | OLK Olink Holding AB (publ) |
| Sector: Health Care | |
| SubSector: Diagnostics & Research | |
| MarketCap: 2370 Millions | |
| Recent Price: 23.95 Smart Investing & Trading Score: 59 | |
| Day Percent Change: -0.25% Day Change: -0.06 | |
| Week Change: -0.08% Year-to-date Change: -4.9% | |
| OLK Links: Profile News Message Board | |
| Charts:- Daily , Weekly | |
| Add OLK to Watchlist: View: Get Complete OLK Trend Analysis ➞ | |
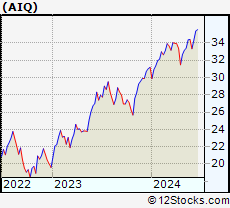 | AIQ Alliance Healthcare Services, Inc. |
| Sector: Health Care | |
| SubSector: Medical Laboratories & Research | |
| MarketCap: 105.79 Millions | |
| Recent Price: 33.32 Smart Investing & Trading Score: 38 | |
| Day Percent Change: -0.27% Day Change: -0.09 | |
| Week Change: -3.14% Year-to-date Change: 6.9% | |
| AIQ Links: Profile News Message Board | |
| Charts:- Daily , Weekly | |
| Add AIQ to Watchlist: View: Get Complete AIQ Trend Analysis ➞ | |
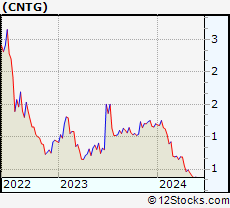 | CNTG Centogene N.V. |
| Sector: Health Care | |
| SubSector: Medical Laboratories & Research | |
| MarketCap: 455.8 Millions | |
| Recent Price: 0.37 Smart Investing & Trading Score: 20 | |
| Day Percent Change: -0.27% Day Change: 0.00 | |
| Week Change: -1.54% Year-to-date Change: -69.1% | |
| CNTG Links: Profile News Message Board | |
| Charts:- Daily , Weekly | |
| Add CNTG to Watchlist: View: Get Complete CNTG Trend Analysis ➞ | |
| For tabular summary view of above stock list: Summary View ➞ 0 - 25 , 25 - 50 , 50 - 75 , 75 - 100 , 100 - 125 , 125 - 150 , 150 - 175 , 175 - 200 , 200 - 225 , 225 - 250 , 250 - 275 , 275 - 300 , 300 - 325 , 325 - 350 , 350 - 375 , 375 - 400 , 400 - 425 , 425 - 450 , 450 - 475 , 475 - 500 , 500 - 525 , 525 - 550 , 550 - 575 , 575 - 600 , 600 - 625 , 625 - 650 , 650 - 675 , 675 - 700 , 700 - 725 | ||
| Click To Change The Sort Order: By Market Cap or Company Size Performance: Year-to-date, Week and Day | |
| Select Chart Type: | ||
|
Best Stocks Today 12Stocks.com |
© 2024 12Stocks.com Terms & Conditions Privacy Contact Us
All Information Provided Only For Education And Not To Be Used For Investing or Trading. See Terms & Conditions


One More Thing ... Get Best Stocks Delivered Daily!
Never Ever Miss A Move With Our Top Ten Stocks Lists
Find Best Stocks In Any Market - Bull or Bear Market
Take A Peek At Our Top Ten Stocks Lists: Daily, Weekly, Year-to-Date & Top Trends
Find Best Stocks In Any Market - Bull or Bear Market
Take A Peek At Our Top Ten Stocks Lists: Daily, Weekly, Year-to-Date & Top Trends
Healthcare Stocks With Best Up Trends [0-bearish to 100-bullish]: DURECT [100], AC Immune[100], PureTech Health[100], Heron [100], Agenus [100], Calliditas [100], Humana [100], Addus HomeCare[100], Community Health[100], Novartis AG[100], Universal Health[100]
Best Healthcare Stocks Year-to-Date:
Pieris [5277.75%], Precision BioSciences[3434.25%], Avenue [2036.65%], Inovio [1886.27%], Agenus [1795.16%], Assembly Biosciences[1747.34%], Aurora Cannabis[1199.87%], NuCana [1120.42%], Adverum Biotechnologies[952.07%], Burning Rock[641.01%], GeneDx [620.96%] Best Healthcare Stocks This Week:
Summit [156.95%], Insmed [150.23%], Calliditas [82.02%], Ikena Oncology[35.11%], DURECT [32.69%], Orchestra BioMed[32%], AC Immune[31.36%], Bright Green[28.42%], Arcturus [27.58%], Janux [22.4%], Surmodics [22.34%] Best Healthcare Stocks Daily:
DURECT [27.78%], Exicure [26.55%], Bright Green[23.18%], AC Immune[17.13%], Renalytix AI[15.19%], Accuray [12.74%], Emergent Bio[11.98%], Adaptimmune [11.88%], Sol-Gel Technologies[10.96%], Greenwich LifeSciences[10.59%], Taysha Gene[9.58%]