
 Login Sign Up


| |||||
 |  | ||||

| 12Stocks.com Market Intelligence |
Best Consumer Services Stocks
| In a hurry? Services & Goods Stocks: Performance Trends Table, Stock Charts
Sort Consumer Services: Daily, Weekly, Year-to-Date, Market Cap & Trends. Filter Services & Goods stocks list by size: All Large Mid-Range Small |
| 12Stocks.com Consumer Services Stocks Performances & Trends Daily | |||||||||
|
|  The overall Smart Investing & Trading Score is 25 (0-bearish to 100-bullish) which puts Consumer Services sector in short term bearish to neutral trend. The Smart Investing & Trading Score from previous trading session is 8 and an improvement of trend continues.
| ||||||||
Here are the Smart Investing & Trading Scores of the most requested Consumer Services stocks at 12Stocks.com (click stock name for detailed review):
|


| Consider signing up for our daily 12Stocks.com "Best Stocks Newsletter". You will never ever miss a big stock move again! |
| 12Stocks.com: Investing in Consumer Services sector with Stocks | |
|
The following table helps investors and traders sort through current performance and trends (as measured by Smart Investing & Trading Score) of various
stocks in the Consumer Services sector. Quick View: Move mouse or cursor over stock symbol (ticker) to view short-term Technical chart and over stock name to view long term chart. Click on  to add stock symbol to your watchlist and to add stock symbol to your watchlist and  to view watchlist. Click on any ticker or stock name for detailed market intelligence report for that stock. to view watchlist. Click on any ticker or stock name for detailed market intelligence report for that stock. |
12Stocks.com Performance of Stocks in Consumer Services Sector
| Ticker | Stock Name | Watchlist | Category | Recent Price | Smart Investing & Trading Score | Change % | YTD Change% |
| FOXA | Fox |   | Entertainment | 34.43 | 100 | 0.47% | 16.04% |
| FWONK | Formula One | | Broadcasting | 74.14 | 100 | 0.39% | 17.44% |
| CAKE | Cheesecake Factory | | Restaurants | 38.48 | 100 | 0.05% | 9.91% |
| HEPS | D-Market Elektronik | | Internet Retail | 2.01 | 95 | 8.06% | 13.24% |
| GLP | Global Partners | | Basic Materials Wholesale | 48.33 | 95 | 3.34% | 14.23% |
| CARG | CarGurus | | Automobile | 24.21 | 95 | 2.28% | 0.21% |
| BJ | BJ s | | Retail | 88.07 | 95 | 2.24% | 32.12% |
| EAT | Brinker | | Restaurants | 70.63 | 95 | 1.15% | 63.57% |
| NWSA | News | | Broadcasting | 27.19 | 95 | 1.00% | 10.75% |
| AMRC | Ameresco | | Services | 36.52 | 95 | 0.38% | 15.31% |
| COOK | Traeger | | Furnishings, Fixtures & Appliances | 2.59 | 95 | -1.89% | -8.32% |
| SCVL | Shoe Carnival | | Apparel | 37.75 | 95 | -0.92% | 24.96% |
| TJX | TJX | | Department | 103.10 | 95 | -0.26% | 9.90% |
| PLNT | Planet Fitness | | Sporting | 63.64 | 93 | 3.92% | -12.82% |
| ACTG | Acacia Research | | Services | 5.58 | 93 | 2.20% | 42.35% |
| OSW | OneSpaWorld | | Casinos | 15.55 | 93 | 1.90% | 10.28% |
| MOGU | MOGU | | Retail | 2.38 | 93 | 1.71% | 24.61% |
| DKS | DICK S | | Retail | 227.64 | 93 | 1.55% | 54.91% |
| MELI | MercadoLibre | | Retail | 1725.58 | 93 | 1.51% | 9.80% |
| VRSK | Verisk Analytics | | Services | 252.78 | 93 | 1.37% | 5.83% |
| MANU | Manchester United | | Sporting | 16.88 | 93 | 1.20% | -17.17% |
| MMS | MAXIMUS | | Services | 86.10 | 93 | 1.10% | 2.67% |
| LPX | Louisiana-Pacific | | Wholesale | 91.68 | 93 | 1.05% | 29.44% |
| CARS | Cars.com | | Automobile | 20.23 | 93 | 0.95% | 6.64% |
| CURV | Torrid | | Apparel Retail | 6.71 | 93 | 0.90% | 14.70% |
| For chart view version of above stock list: Chart View ➞ 0 - 25 , 25 - 50 , 50 - 75 , 75 - 100 , 100 - 125 , 125 - 150 , 150 - 175 , 175 - 200 , 200 - 225 , 225 - 250 , 250 - 275 , 275 - 300 , 300 - 325 , 325 - 350 , 350 - 375 , 375 - 400 , 400 - 425 , 425 - 450 , 450 - 475 | ||
 | Click To Change The Sort Order: By Market Cap or Company Size Performance: Year-to-date, Week and Day |  |
|
Get the most comprehensive stock market coverage daily at 12Stocks.com ➞ Best Stocks Today ➞ Best Stocks Weekly ➞ Best Stocks Year-to-Date ➞ Best Stocks Trends ➞  Best Stocks Today 12Stocks.com Best Nasdaq Stocks ➞ Best S&P 500 Stocks ➞ Best Tech Stocks ➞ Best Biotech Stocks ➞ |
| Detailed Overview of Consumer Services Stocks |
| Consumer Services Technical Overview, Leaders & Laggards, Top Consumer Services ETF Funds & Detailed Consumer Services Stocks List, Charts, Trends & More |
| Consumer Services Sector: Technical Analysis, Trends & YTD Performance | |
| Consumer Services sector is composed of stocks
from retail, entertainment, media/publishing, consumer goods
and services subsectors. Consumer Services sector, as represented by XLY, an exchange-traded fund [ETF] that holds basket of Consumer Services stocks (e.g, Walmart, Alibaba) is down by -1.59% and is currently underperforming the overall market by -11.38% year-to-date. Below is a quick view of Technical charts and trends: |
|
 XLY Weekly Chart |
|
| Long Term Trend: Not Good | |
| Medium Term Trend: Not Good | |
 XLY Daily Chart |
|
| Short Term Trend: Very Good | |
| Overall Trend Score: 25 | |
| YTD Performance: -1.59% | |
| **Trend Scores & Views Are Only For Educational Purposes And Not For Investing | |
| 12Stocks.com: Top Performing Consumer Services Sector Stocks | ||||||||||||||||||||||||||||||||||||||||||||||||
 The top performing Consumer Services sector stocks year to date are
Now, more recently, over last week, the top performing Consumer Services sector stocks on the move are


|
||||||||||||||||||||||||||||||||||||||||||||||||
| 12Stocks.com: Investing in Consumer Services Sector using Exchange Traded Funds | |
|
The following table shows list of key exchange traded funds (ETF) that
help investors track Consumer Services Index. For detailed view, check out our ETF Funds section of our website. Quick View: Move mouse or cursor over ETF symbol (ticker) to view short-term Technical chart and over ETF name to view long term chart. Click on ticker or stock name for detailed view. Click on to add stock symbol to your watchlist and to view watchlist. |
12Stocks.com List of ETFs that track Consumer Services Index
| Ticker | ETF Name | Watchlist | Recent Price | Smart Investing & Trading Score | Change % | Week % | Year-to-date % |
| XLY | Consumer Discret Sel | | 175.97 | 25 | 0.56 | 0.24 | -1.59% |
| RTH | Retail | | 200.42 | 32 | 0.79 | 0.6 | 6.48% |
| IYC | Consumer Services | | 78.26 | 8 | -0.36 | -0.92 | 3.29% |
| XRT | Retail | | 77.52 | 100 | 2.24 | 3.43 | 7.19% |
| IYK | Consumer Goods | | 65.97 | 61 | 0.59 | -1.18 | 3.23% |
| UCC | Consumer Services | | 33.50 | 42 | 1.25 | 0.24 | -6.7% |
| RETL | Retail Bull 3X | | 9.76 | 69 | 2.63 | 5.57 | 6.96% |
| RXI | Globl Consumer Discretionary | | 159.55 | 18 | 0.81 | -0.73 | 0.31% |
| SCC | Short Consumer Services | | 15.90 | 68 | -0.93 | -0.14 | 3.78% |
| UGE | Consumer Goods | | 17.74 | 83 | 2.95 | 0.34 | 12.68% |
| 12Stocks.com: Charts, Trends, Fundamental Data and Performances of Consumer Services Stocks | |
|
We now take in-depth look at all Consumer Services stocks including charts, multi-period performances and overall trends (as measured by Smart Investing & Trading Score). One can sort Consumer Services stocks (click link to choose) by Daily, Weekly and by Year-to-Date performances. Also, one can sort by size of the company or by market capitalization. |
| Select Your Default Chart Type: | |||||
| |||||
| Click on stock symbol or name for detailed view. Click on to add stock symbol to your watchlist and to view watchlist. Quick View: Move mouse or cursor over "Daily" to quickly view daily Technical stock chart and over "Weekly" to view weekly Technical stock chart. | |||||

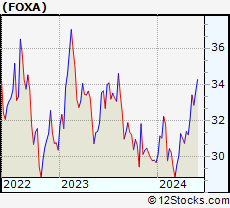 | FOXA Fox Corporation |
| Sector: Services & Goods | |
| SubSector: Entertainment - Diversified | |
| MarketCap: 13440.7 Millions | |
| Recent Price: 34.43 Smart Investing & Trading Score: 100 | |
| Day Percent Change: 0.47% Day Change: 0.16 | |
| Week Change: 2.44% Year-to-date Change: 16.0% | |
| FOXA Links: Profile News Message Board | |
| Charts:- Daily , Weekly | |
| Add FOXA to Watchlist: View: Get Complete FOXA Trend Analysis ➞ | |
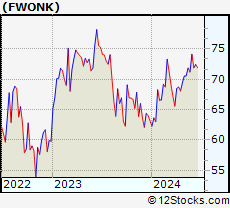 | FWONK Formula One Group |
| Sector: Services & Goods | |
| SubSector: Broadcasting - TV | |
| MarketCap: 4677.53 Millions | |
| Recent Price: 74.14 Smart Investing & Trading Score: 100 | |
| Day Percent Change: 0.39% Day Change: 0.29 | |
| Week Change: 4.13% Year-to-date Change: 17.4% | |
| FWONK Links: Profile News Message Board | |
| Charts:- Daily , Weekly | |
| Add FWONK to Watchlist: View: Get Complete FWONK Trend Analysis ➞ | |
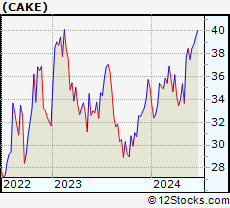 | CAKE The Cheesecake Factory Incorporated |
| Sector: Services & Goods | |
| SubSector: Restaurants | |
| MarketCap: 829 Millions | |
| Recent Price: 38.48 Smart Investing & Trading Score: 100 | |
| Day Percent Change: 0.05% Day Change: 0.02 | |
| Week Change: 2.67% Year-to-date Change: 9.9% | |
| CAKE Links: Profile News Message Board | |
| Charts:- Daily , Weekly | |
| Add CAKE to Watchlist: View: Get Complete CAKE Trend Analysis ➞ | |
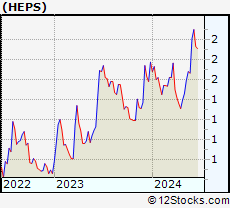 | HEPS D-Market Elektronik Hizmetler ve Ticaret A.S. |
| Sector: Services & Goods | |
| SubSector: Internet Retail | |
| MarketCap: 561 Millions | |
| Recent Price: 2.01 Smart Investing & Trading Score: 95 | |
| Day Percent Change: 8.06% Day Change: 0.15 | |
| Week Change: 20.72% Year-to-date Change: 13.2% | |
| HEPS Links: Profile News Message Board | |
| Charts:- Daily , Weekly | |
| Add HEPS to Watchlist: View: Get Complete HEPS Trend Analysis ➞ | |
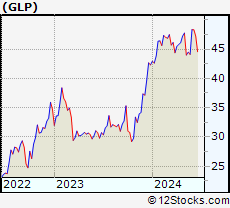 | GLP Global Partners LP |
| Sector: Services & Goods | |
| SubSector: Basic Materials Wholesale | |
| MarketCap: 416.73 Millions | |
| Recent Price: 48.33 Smart Investing & Trading Score: 95 | |
| Day Percent Change: 3.34% Day Change: 1.56 | |
| Week Change: 9.59% Year-to-date Change: 14.2% | |
| GLP Links: Profile News Message Board | |
| Charts:- Daily , Weekly | |
| Add GLP to Watchlist: View: Get Complete GLP Trend Analysis ➞ | |
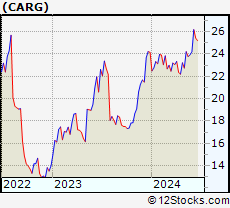 | CARG CarGurus, Inc. |
| Sector: Services & Goods | |
| SubSector: Auto Dealerships | |
| MarketCap: 2099.31 Millions | |
| Recent Price: 24.21 Smart Investing & Trading Score: 95 | |
| Day Percent Change: 2.28% Day Change: 0.54 | |
| Week Change: 1.17% Year-to-date Change: 0.2% | |
| CARG Links: Profile News Message Board | |
| Charts:- Daily , Weekly | |
| Add CARG to Watchlist: View: Get Complete CARG Trend Analysis ➞ | |
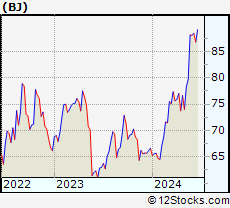 | BJ BJ s Wholesale Club Holdings, Inc. |
| Sector: Services & Goods | |
| SubSector: Discount, Variety Stores | |
| MarketCap: 3346.02 Millions | |
| Recent Price: 88.07 Smart Investing & Trading Score: 95 | |
| Day Percent Change: 2.24% Day Change: 1.93 | |
| Week Change: -0.08% Year-to-date Change: 32.1% | |
| BJ Links: Profile News Message Board | |
| Charts:- Daily , Weekly | |
| Add BJ to Watchlist: View: Get Complete BJ Trend Analysis ➞ | |
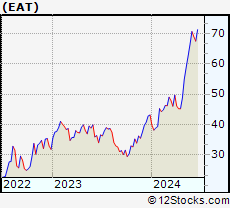 | EAT Brinker International, Inc. |
| Sector: Services & Goods | |
| SubSector: Restaurants | |
| MarketCap: 435.97 Millions | |
| Recent Price: 70.63 Smart Investing & Trading Score: 95 | |
| Day Percent Change: 1.15% Day Change: 0.80 | |
| Week Change: 6.5% Year-to-date Change: 63.6% | |
| EAT Links: Profile News Message Board | |
| Charts:- Daily , Weekly | |
| Add EAT to Watchlist: View: Get Complete EAT Trend Analysis ➞ | |
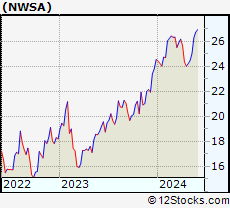 | NWSA News Corporation |
| Sector: Services & Goods | |
| SubSector: Broadcasting - TV | |
| MarketCap: 5857.53 Millions | |
| Recent Price: 27.19 Smart Investing & Trading Score: 95 | |
| Day Percent Change: 1.00% Day Change: 0.27 | |
| Week Change: 1.68% Year-to-date Change: 10.8% | |
| NWSA Links: Profile News Message Board | |
| Charts:- Daily , Weekly | |
| Add NWSA to Watchlist: View: Get Complete NWSA Trend Analysis ➞ | |
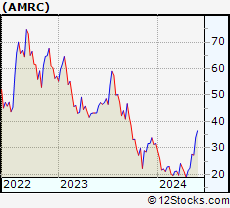 | AMRC Ameresco, Inc. |
| Sector: Services & Goods | |
| SubSector: Technical Services | |
| MarketCap: 898.91 Millions | |
| Recent Price: 36.52 Smart Investing & Trading Score: 95 | |
| Day Percent Change: 0.38% Day Change: 0.14 | |
| Week Change: 7.54% Year-to-date Change: 15.3% | |
| AMRC Links: Profile News Message Board | |
| Charts:- Daily , Weekly | |
| Add AMRC to Watchlist: View: Get Complete AMRC Trend Analysis ➞ | |
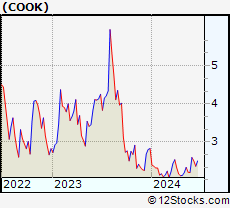 | COOK Traeger, Inc. |
| Sector: Services & Goods | |
| SubSector: Furnishings, Fixtures & Appliances | |
| MarketCap: 524 Millions | |
| Recent Price: 2.59 Smart Investing & Trading Score: 95 | |
| Day Percent Change: -1.89% Day Change: -0.05 | |
| Week Change: 18% Year-to-date Change: -8.3% | |
| COOK Links: Profile News Message Board | |
| Charts:- Daily , Weekly | |
| Add COOK to Watchlist: View: Get Complete COOK Trend Analysis ➞ | |
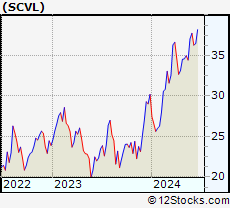 | SCVL Shoe Carnival, Inc. |
| Sector: Services & Goods | |
| SubSector: Apparel Stores | |
| MarketCap: 252.508 Millions | |
| Recent Price: 37.75 Smart Investing & Trading Score: 95 | |
| Day Percent Change: -0.92% Day Change: -0.35 | |
| Week Change: 1.83% Year-to-date Change: 25.0% | |
| SCVL Links: Profile News Message Board | |
| Charts:- Daily , Weekly | |
| Add SCVL to Watchlist: View: Get Complete SCVL Trend Analysis ➞ | |
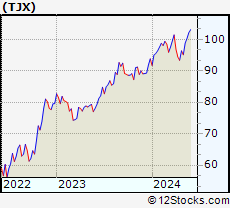 | TJX The TJX Companies, Inc. |
| Sector: Services & Goods | |
| SubSector: Department Stores | |
| MarketCap: 50656.2 Millions | |
| Recent Price: 103.10 Smart Investing & Trading Score: 95 | |
| Day Percent Change: -0.26% Day Change: -0.27 | |
| Week Change: 0.94% Year-to-date Change: 9.9% | |
| TJX Links: Profile News Message Board | |
| Charts:- Daily , Weekly | |
| Add TJX to Watchlist: View: Get Complete TJX Trend Analysis ➞ | |
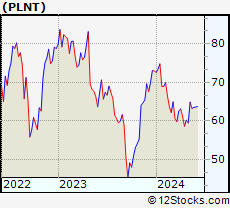 | PLNT Planet Fitness, Inc. |
| Sector: Services & Goods | |
| SubSector: Sporting Activities | |
| MarketCap: 3485.94 Millions | |
| Recent Price: 63.64 Smart Investing & Trading Score: 93 | |
| Day Percent Change: 3.92% Day Change: 2.40 | |
| Week Change: 0.16% Year-to-date Change: -12.8% | |
| PLNT Links: Profile News Message Board | |
| Charts:- Daily , Weekly | |
| Add PLNT to Watchlist: View: Get Complete PLNT Trend Analysis ➞ | |
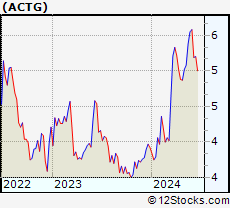 | ACTG Acacia Research Corporation |
| Sector: Services & Goods | |
| SubSector: Business Services | |
| MarketCap: 112.782 Millions | |
| Recent Price: 5.58 Smart Investing & Trading Score: 93 | |
| Day Percent Change: 2.20% Day Change: 0.12 | |
| Week Change: 0.54% Year-to-date Change: 42.4% | |
| ACTG Links: Profile News Message Board | |
| Charts:- Daily , Weekly | |
| Add ACTG to Watchlist: View: Get Complete ACTG Trend Analysis ➞ | |
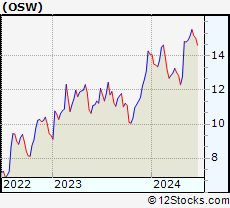 | OSW OneSpaWorld Holdings Limited |
| Sector: Services & Goods | |
| SubSector: Resorts & Casinos | |
| MarketCap: 228.394 Millions | |
| Recent Price: 15.55 Smart Investing & Trading Score: 93 | |
| Day Percent Change: 1.90% Day Change: 0.29 | |
| Week Change: 2.54% Year-to-date Change: 10.3% | |
| OSW Links: Profile News Message Board | |
| Charts:- Daily , Weekly | |
| Add OSW to Watchlist: View: Get Complete OSW Trend Analysis ➞ | |
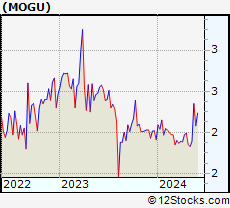 | MOGU MOGU Inc. |
| Sector: Services & Goods | |
| SubSector: Specialty Retail, Other | |
| MarketCap: 168.844 Millions | |
| Recent Price: 2.38 Smart Investing & Trading Score: 93 | |
| Day Percent Change: 1.71% Day Change: 0.04 | |
| Week Change: 14.42% Year-to-date Change: 24.6% | |
| MOGU Links: Profile News Message Board | |
| Charts:- Daily , Weekly | |
| Add MOGU to Watchlist: View: Get Complete MOGU Trend Analysis ➞ | |
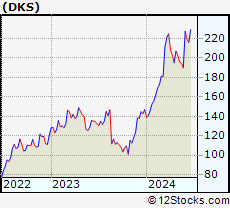 | DKS DICK S Sporting Goods, Inc. |
| Sector: Services & Goods | |
| SubSector: Sporting Goods Stores | |
| MarketCap: 1672.04 Millions | |
| Recent Price: 227.64 Smart Investing & Trading Score: 93 | |
| Day Percent Change: 1.55% Day Change: 3.48 | |
| Week Change: 19.83% Year-to-date Change: 54.9% | |
| DKS Links: Profile News Message Board | |
| Charts:- Daily , Weekly | |
| Add DKS to Watchlist: View: Get Complete DKS Trend Analysis ➞ | |
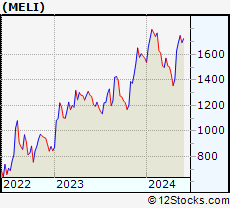 | MELI MercadoLibre, Inc. |
| Sector: Services & Goods | |
| SubSector: Catalog & Mail Order Houses | |
| MarketCap: 24695.5 Millions | |
| Recent Price: 1725.58 Smart Investing & Trading Score: 93 | |
| Day Percent Change: 1.51% Day Change: 25.63 | |
| Week Change: 1.89% Year-to-date Change: 9.8% | |
| MELI Links: Profile News Message Board | |
| Charts:- Daily , Weekly | |
| Add MELI to Watchlist: View: Get Complete MELI Trend Analysis ➞ | |
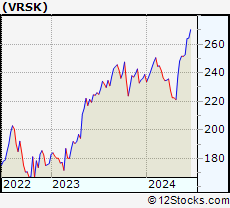 | VRSK Verisk Analytics, Inc. |
| Sector: Services & Goods | |
| SubSector: Business Services | |
| MarketCap: 22033.2 Millions | |
| Recent Price: 252.78 Smart Investing & Trading Score: 93 | |
| Day Percent Change: 1.37% Day Change: 3.41 | |
| Week Change: 0.48% Year-to-date Change: 5.8% | |
| VRSK Links: Profile News Message Board | |
| Charts:- Daily , Weekly | |
| Add VRSK to Watchlist: View: Get Complete VRSK Trend Analysis ➞ | |
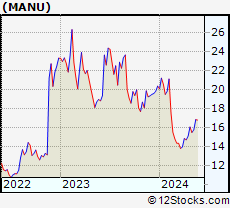 | MANU Manchester United plc |
| Sector: Services & Goods | |
| SubSector: Sporting Activities | |
| MarketCap: 2537.74 Millions | |
| Recent Price: 16.88 Smart Investing & Trading Score: 93 | |
| Day Percent Change: 1.20% Day Change: 0.20 | |
| Week Change: 0.48% Year-to-date Change: -17.2% | |
| MANU Links: Profile News Message Board | |
| Charts:- Daily , Weekly | |
| Add MANU to Watchlist: View: Get Complete MANU Trend Analysis ➞ | |
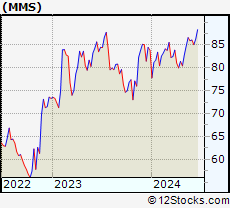 | MMS MAXIMUS, Inc. |
| Sector: Services & Goods | |
| SubSector: Business Services | |
| MarketCap: 3833.02 Millions | |
| Recent Price: 86.10 Smart Investing & Trading Score: 93 | |
| Day Percent Change: 1.10% Day Change: 0.94 | |
| Week Change: 0.16% Year-to-date Change: 2.7% | |
| MMS Links: Profile News Message Board | |
| Charts:- Daily , Weekly | |
| Add MMS to Watchlist: View: Get Complete MMS Trend Analysis ➞ | |
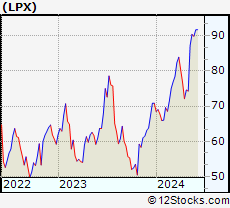 | LPX Louisiana-Pacific Corporation |
| Sector: Services & Goods | |
| SubSector: Building Materials Wholesale | |
| MarketCap: 1943.43 Millions | |
| Recent Price: 91.68 Smart Investing & Trading Score: 93 | |
| Day Percent Change: 1.05% Day Change: 0.95 | |
| Week Change: 2% Year-to-date Change: 29.4% | |
| LPX Links: Profile News Message Board | |
| Charts:- Daily , Weekly | |
| Add LPX to Watchlist: View: Get Complete LPX Trend Analysis ➞ | |
 | CARS Cars.com Inc. |
| Sector: Services & Goods | |
| SubSector: Auto Dealerships | |
| MarketCap: 290.321 Millions | |
| Recent Price: 20.23 Smart Investing & Trading Score: 93 | |
| Day Percent Change: 0.95% Day Change: 0.19 | |
| Week Change: 8.47% Year-to-date Change: 6.6% | |
| CARS Links: Profile News Message Board | |
| Charts:- Daily , Weekly | |
| Add CARS to Watchlist: View: Get Complete CARS Trend Analysis ➞ | |
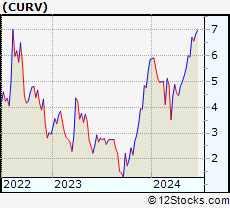 | CURV Torrid Holdings Inc. |
| Sector: Services & Goods | |
| SubSector: Apparel Retail | |
| MarketCap: 278 Millions | |
| Recent Price: 6.71 Smart Investing & Trading Score: 93 | |
| Day Percent Change: 0.90% Day Change: 0.06 | |
| Week Change: 12.68% Year-to-date Change: 14.7% | |
| CURV Links: Profile News Message Board | |
| Charts:- Daily , Weekly | |
| Add CURV to Watchlist: View: Get Complete CURV Trend Analysis ➞ | |
| For tabular summary view of above stock list: Summary View ➞ 0 - 25 , 25 - 50 , 50 - 75 , 75 - 100 , 100 - 125 , 125 - 150 , 150 - 175 , 175 - 200 , 200 - 225 , 225 - 250 , 250 - 275 , 275 - 300 , 300 - 325 , 325 - 350 , 350 - 375 , 375 - 400 , 400 - 425 , 425 - 450 , 450 - 475 | ||
| Click To Change The Sort Order: By Market Cap or Company Size Performance: Year-to-date, Week and Day | |
| Select Chart Type: | ||
|
Best Stocks Today 12Stocks.com |
© 2024 12Stocks.com Terms & Conditions Privacy Contact Us
All Information Provided Only For Education And Not To Be Used For Investing or Trading. See Terms & Conditions


One More Thing ... Get Best Stocks Delivered Daily!
Never Ever Miss A Move With Our Top Ten Stocks Lists
Find Best Stocks In Any Market - Bull or Bear Market
Take A Peek At Our Top Ten Stocks Lists: Daily, Weekly, Year-to-Date & Top Trends
Find Best Stocks In Any Market - Bull or Bear Market
Take A Peek At Our Top Ten Stocks Lists: Daily, Weekly, Year-to-Date & Top Trends
Consumer Services Stocks With Best Up Trends [0-bearish to 100-bullish]: Gap [100], Boqii Holding[100], Nordstrom [100], SunCar Technology[100], Boot Barn[100], Arhaus [100], Best Buy[100], Signet Jewelers[100], Nathan s[100], Barrett Business[100], Newtek Business[100]
Best Consumer Services Stocks Year-to-Date:
U Power[2896.65%], Vroom [1650.37%], Fluent [450.75%], Yatsen Holding[364.73%], Zhihu [244.75%], Sweetgreen [172.12%], Codere Online[156.85%], Faraday Future[152.88%], Research[128.72%], RealReal [114.43%], CAVA [112.86%] Best Consumer Services Stocks This Week:
Gap [38.04%], Chewy [28%], Boqii Holding[22.37%], GameStop [21.79%], Sunnova Energy[21.11%], D-Market Elektronik[20.72%], DICK S[19.83%], Burlington Stores[19.8%], Red Robin[19.29%], Best Buy[18.63%], Traeger [18%] Best Consumer Services Stocks Daily:
Gap [28.60%], Penn National[19.62%], Slair Broadcast[12.08%], Caesars Entertainment[11.65%], Conn s[10.49%], ECARX [10.09%], Yunji [9.95%], Olaplex [9.88%], IHS Holding[8.96%], Stitch Fix[8.81%], Boqii Holding[8.78%]