
 Login Sign Up


| |||||
 |  | ||||

| 12Stocks.com Market Intelligence |
Best Consumer Services Stocks
| In a hurry? Services & Goods Stocks: Performance Trends Table, Stock Charts
Sort Consumer Services: Daily, Weekly, Year-to-Date, Market Cap & Trends. Filter Services & Goods stocks list by size: All Large Mid-Range Small |
| 12Stocks.com Consumer Services Stocks Performances & Trends Daily | |||||||||
|
|  The overall Smart Investing & Trading Score is 25 (0-bearish to 100-bullish) which puts Consumer Services sector in short term bearish to neutral trend. The Smart Investing & Trading Score from previous trading session is 8 and an improvement of trend continues.
| ||||||||
Here are the Smart Investing & Trading Scores of the most requested Consumer Services stocks at 12Stocks.com (click stock name for detailed review):
|


| Consider signing up for our daily 12Stocks.com "Best Stocks Newsletter". You will never ever miss a big stock move again! |
| 12Stocks.com: Investing in Consumer Services sector with Stocks | |
|
The following table helps investors and traders sort through current performance and trends (as measured by Smart Investing & Trading Score) of various
stocks in the Consumer Services sector. Quick View: Move mouse or cursor over stock symbol (ticker) to view short-term Technical chart and over stock name to view long term chart. Click on  to add stock symbol to your watchlist and to add stock symbol to your watchlist and  to view watchlist. Click on any ticker or stock name for detailed market intelligence report for that stock. to view watchlist. Click on any ticker or stock name for detailed market intelligence report for that stock. |
12Stocks.com Performance of Stocks in Consumer Services Sector
| Ticker | Stock Name | Watchlist | Category | Recent Price | Smart Investing & Trading Score | Change % | YTD Change% |
| PAYX | Paychex |   | Staffing | 120.16 | 40 | 1.48% | 0.88% |
| SAH | Sonic Automotive | | Automobile | 56.67 | 56 | 1.43% | 0.82% |
| DG | Dollar General | | Retail | 136.91 | 35 | 7.01% | 0.71% |
| PFGC | Performance Food | | Restaurants | 69.60 | 32 | 2.28% | 0.65% |
| STN | Stantec | | Services | 80.68 | 35 | 2.36% | 0.61% |
| KELYA | Kelly Services | | Staffing | 21.74 | 25 | 0.74% | 0.56% |
| FTDR | frontdoor | | Services | 35.37 | 78 | 1.43% | 0.43% |
| CARG | CarGurus | | Automobile | 24.21 | 95 | 2.28% | 0.21% |
| LYV | Live Nation | | Entertainment | 93.74 | 0 | 0.45% | 0.15% |
| CHH | Choice Hotels | | Lodging | 113.19 | 58 | 2.30% | -0.10% |
| TV | Grupo Televisa | | Broadcasting | 3.33 | 83 | 0.91% | -0.30% |
| NEWT | Newtek Business | | Services | 13.75 | 100 | 2.54% | -0.36% |
| QGEN | QIAGEN N.V | | Research | 43.26 | 76 | 1.45% | -0.39% |
| LOW | Lowe s | | Retail | 221.29 | 32 | 2.71% | -0.57% |
| FWRG | First Watch | | Restaurants | 19.68 | 32 | 1.18% | -1.25% |
| PLYA | Playa Hotels | | Casinos | 8.52 | 32 | 0.95% | -1.50% |
| CAH | Cardinal Health | | Pharmacy | 99.27 | 49 | 1.60% | -1.52% |
| BATRA | Liberty Braves | | Broadcasting | 42.03 | 63 | 2.19% | -1.75% |
| PSO | Pearson | | Publishing | 12.07 | 32 | 1.34% | -1.79% |
| BKR | Baker Hughes | | Services | 33.48 | 83 | 3.08% | -2.05% |
| DFIN | Donnelley Financial | | Services | 60.96 | 18 | 1.97% | -2.26% |
| ASGN | ASGN | | Staffing | 93.91 | 25 | 1.91% | -2.35% |
| BZUN | Baozun | | Retail | 2.67 | 31 | -3.96% | -2.55% |
| TGNA | TEGNA | | Broadcasting | 14.91 | 78 | 1.50% | -2.55% |
| BJRI | BJ s | | Restaurants | 35.04 | 55 | -0.34% | -2.69% |
| For chart view version of above stock list: Chart View ➞ 0 - 25 , 25 - 50 , 50 - 75 , 75 - 100 , 100 - 125 , 125 - 150 , 150 - 175 , 175 - 200 , 200 - 225 , 225 - 250 , 250 - 275 , 275 - 300 , 300 - 325 , 325 - 350 , 350 - 375 , 375 - 400 , 400 - 425 , 425 - 450 , 450 - 475 | ||
 | Click To Change The Sort Order: By Market Cap or Company Size Performance: Year-to-date, Week and Day |  |
|
Get the most comprehensive stock market coverage daily at 12Stocks.com ➞ Best Stocks Today ➞ Best Stocks Weekly ➞ Best Stocks Year-to-Date ➞ Best Stocks Trends ➞  Best Stocks Today 12Stocks.com Best Nasdaq Stocks ➞ Best S&P 500 Stocks ➞ Best Tech Stocks ➞ Best Biotech Stocks ➞ |
| Detailed Overview of Consumer Services Stocks |
| Consumer Services Technical Overview, Leaders & Laggards, Top Consumer Services ETF Funds & Detailed Consumer Services Stocks List, Charts, Trends & More |
| Consumer Services Sector: Technical Analysis, Trends & YTD Performance | |
| Consumer Services sector is composed of stocks
from retail, entertainment, media/publishing, consumer goods
and services subsectors. Consumer Services sector, as represented by XLY, an exchange-traded fund [ETF] that holds basket of Consumer Services stocks (e.g, Walmart, Alibaba) is down by -1.59% and is currently underperforming the overall market by -11.38% year-to-date. Below is a quick view of Technical charts and trends: |
|
 XLY Weekly Chart |
|
| Long Term Trend: Not Good | |
| Medium Term Trend: Not Good | |
 XLY Daily Chart |
|
| Short Term Trend: Very Good | |
| Overall Trend Score: 25 | |
| YTD Performance: -1.59% | |
| **Trend Scores & Views Are Only For Educational Purposes And Not For Investing | |
| 12Stocks.com: Top Performing Consumer Services Sector Stocks | ||||||||||||||||||||||||||||||||||||||||||||||||
 The top performing Consumer Services sector stocks year to date are
Now, more recently, over last week, the top performing Consumer Services sector stocks on the move are


|
||||||||||||||||||||||||||||||||||||||||||||||||
| 12Stocks.com: Investing in Consumer Services Sector using Exchange Traded Funds | |
|
The following table shows list of key exchange traded funds (ETF) that
help investors track Consumer Services Index. For detailed view, check out our ETF Funds section of our website. Quick View: Move mouse or cursor over ETF symbol (ticker) to view short-term Technical chart and over ETF name to view long term chart. Click on ticker or stock name for detailed view. Click on to add stock symbol to your watchlist and to view watchlist. |
12Stocks.com List of ETFs that track Consumer Services Index
| Ticker | ETF Name | Watchlist | Recent Price | Smart Investing & Trading Score | Change % | Week % | Year-to-date % |
| XLY | Consumer Discret Sel | | 175.97 | 25 | 0.56 | 0.24 | -1.59% |
| RTH | Retail | | 200.42 | 32 | 0.79 | 0.6 | 6.48% |
| IYC | Consumer Services | | 78.26 | 8 | -0.36 | -0.92 | 3.29% |
| XRT | Retail | | 77.52 | 100 | 2.24 | 3.43 | 7.19% |
| IYK | Consumer Goods | | 65.97 | 61 | 0.59 | -1.18 | 3.23% |
| UCC | Consumer Services | | 33.50 | 42 | 1.25 | 0.24 | -6.7% |
| RETL | Retail Bull 3X | | 9.76 | 69 | 2.63 | 5.57 | 6.96% |
| RXI | Globl Consumer Discretionary | | 159.55 | 18 | 0.81 | -0.73 | 0.31% |
| SCC | Short Consumer Services | | 15.90 | 68 | -0.93 | -0.14 | 3.78% |
| UGE | Consumer Goods | | 17.74 | 83 | 2.95 | 0.34 | 12.68% |
| 12Stocks.com: Charts, Trends, Fundamental Data and Performances of Consumer Services Stocks | |
|
We now take in-depth look at all Consumer Services stocks including charts, multi-period performances and overall trends (as measured by Smart Investing & Trading Score). One can sort Consumer Services stocks (click link to choose) by Daily, Weekly and by Year-to-Date performances. Also, one can sort by size of the company or by market capitalization. |
| Select Your Default Chart Type: | |||||
| |||||
| Click on stock symbol or name for detailed view. Click on to add stock symbol to your watchlist and to view watchlist. Quick View: Move mouse or cursor over "Daily" to quickly view daily Technical stock chart and over "Weekly" to view weekly Technical stock chart. | |||||

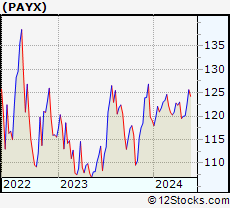 | PAYX Paychex, Inc. |
| Sector: Services & Goods | |
| SubSector: Staffing & Outsourcing Services | |
| MarketCap: 20928.8 Millions | |
| Recent Price: 120.16 Smart Investing & Trading Score: 40 | |
| Day Percent Change: 1.48% Day Change: 1.75 | |
| Week Change: -3.28% Year-to-date Change: 0.9% | |
| PAYX Links: Profile News Message Board | |
| Charts:- Daily , Weekly | |
| Add PAYX to Watchlist: View: Get Complete PAYX Trend Analysis ➞ | |
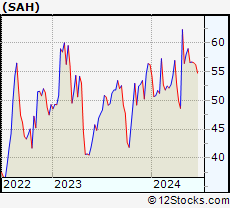 | SAH Sonic Automotive, Inc. |
| Sector: Services & Goods | |
| SubSector: Auto Dealerships | |
| MarketCap: 581.321 Millions | |
| Recent Price: 56.67 Smart Investing & Trading Score: 56 | |
| Day Percent Change: 1.43% Day Change: 0.80 | |
| Week Change: 0.12% Year-to-date Change: 0.8% | |
| SAH Links: Profile News Message Board | |
| Charts:- Daily , Weekly | |
| Add SAH to Watchlist: View: Get Complete SAH Trend Analysis ➞ | |
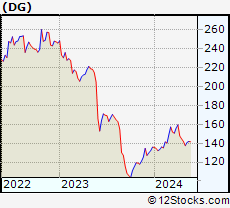 | DG Dollar General Corporation |
| Sector: Services & Goods | |
| SubSector: Discount, Variety Stores | |
| MarketCap: 39611.9 Millions | |
| Recent Price: 136.91 Smart Investing & Trading Score: 35 | |
| Day Percent Change: 7.01% Day Change: 8.97 | |
| Week Change: -5.73% Year-to-date Change: 0.7% | |
| DG Links: Profile News Message Board | |
| Charts:- Daily , Weekly | |
| Add DG to Watchlist: View: Get Complete DG Trend Analysis ➞ | |
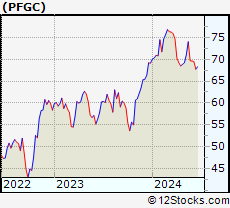 | PFGC Performance Food Group Company |
| Sector: Services & Goods | |
| SubSector: Restaurants | |
| MarketCap: 2457.5 Millions | |
| Recent Price: 69.60 Smart Investing & Trading Score: 32 | |
| Day Percent Change: 2.28% Day Change: 1.55 | |
| Week Change: -0.1% Year-to-date Change: 0.7% | |
| PFGC Links: Profile News Message Board | |
| Charts:- Daily , Weekly | |
| Add PFGC to Watchlist: View: Get Complete PFGC Trend Analysis ➞ | |
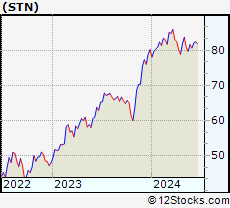 | STN Stantec Inc. |
| Sector: Services & Goods | |
| SubSector: Business Services | |
| MarketCap: 2855.92 Millions | |
| Recent Price: 80.68 Smart Investing & Trading Score: 35 | |
| Day Percent Change: 2.36% Day Change: 1.86 | |
| Week Change: -1.19% Year-to-date Change: 0.6% | |
| STN Links: Profile News Message Board | |
| Charts:- Daily , Weekly | |
| Add STN to Watchlist: View: Get Complete STN Trend Analysis ➞ | |
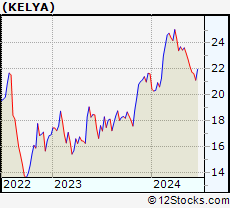 | KELYA Kelly Services, Inc. |
| Sector: Services & Goods | |
| SubSector: Staffing & Outsourcing Services | |
| MarketCap: 587.228 Millions | |
| Recent Price: 21.74 Smart Investing & Trading Score: 25 | |
| Day Percent Change: 0.74% Day Change: 0.16 | |
| Week Change: -1.98% Year-to-date Change: 0.6% | |
| KELYA Links: Profile News Message Board | |
| Charts:- Daily , Weekly | |
| Add KELYA to Watchlist: View: Get Complete KELYA Trend Analysis ➞ | |
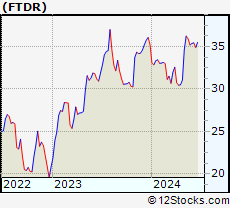 | FTDR frontdoor, inc. |
| Sector: Services & Goods | |
| SubSector: Business Services | |
| MarketCap: 2974.22 Millions | |
| Recent Price: 35.37 Smart Investing & Trading Score: 78 | |
| Day Percent Change: 1.43% Day Change: 0.50 | |
| Week Change: 0.51% Year-to-date Change: 0.4% | |
| FTDR Links: Profile News Message Board | |
| Charts:- Daily , Weekly | |
| Add FTDR to Watchlist: View: Get Complete FTDR Trend Analysis ➞ | |
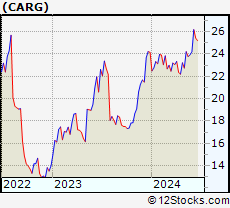 | CARG CarGurus, Inc. |
| Sector: Services & Goods | |
| SubSector: Auto Dealerships | |
| MarketCap: 2099.31 Millions | |
| Recent Price: 24.21 Smart Investing & Trading Score: 95 | |
| Day Percent Change: 2.28% Day Change: 0.54 | |
| Week Change: 1.17% Year-to-date Change: 0.2% | |
| CARG Links: Profile News Message Board | |
| Charts:- Daily , Weekly | |
| Add CARG to Watchlist: View: Get Complete CARG Trend Analysis ➞ | |
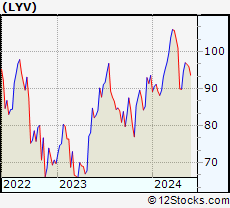 | LYV Live Nation Entertainment, Inc. |
| Sector: Services & Goods | |
| SubSector: Entertainment - Diversified | |
| MarketCap: 8457.17 Millions | |
| Recent Price: 93.74 Smart Investing & Trading Score: 0 | |
| Day Percent Change: 0.45% Day Change: 0.42 | |
| Week Change: -2.34% Year-to-date Change: 0.2% | |
| LYV Links: Profile News Message Board | |
| Charts:- Daily , Weekly | |
| Add LYV to Watchlist: View: Get Complete LYV Trend Analysis ➞ | |
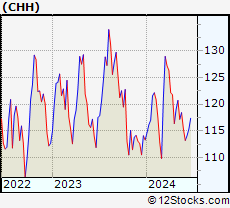 | CHH Choice Hotels International, Inc. |
| Sector: Services & Goods | |
| SubSector: Lodging | |
| MarketCap: 3427.56 Millions | |
| Recent Price: 113.19 Smart Investing & Trading Score: 58 | |
| Day Percent Change: 2.30% Day Change: 2.55 | |
| Week Change: -1.93% Year-to-date Change: -0.1% | |
| CHH Links: Profile News Message Board | |
| Charts:- Daily , Weekly | |
| Add CHH to Watchlist: View: Get Complete CHH Trend Analysis ➞ | |
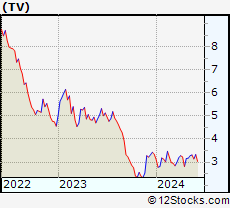 | TV Grupo Televisa, S.A.B. |
| Sector: Services & Goods | |
| SubSector: Broadcasting - TV | |
| MarketCap: 3740.43 Millions | |
| Recent Price: 3.33 Smart Investing & Trading Score: 83 | |
| Day Percent Change: 0.91% Day Change: 0.03 | |
| Week Change: 6.05% Year-to-date Change: -0.3% | |
| TV Links: Profile News Message Board | |
| Charts:- Daily , Weekly | |
| Add TV to Watchlist: View: Get Complete TV Trend Analysis ➞ | |
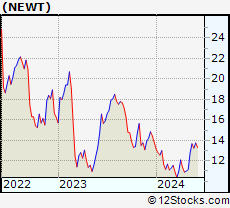 | NEWT Newtek Business Services Corp. |
| Sector: Services & Goods | |
| SubSector: Business Services | |
| MarketCap: 243.982 Millions | |
| Recent Price: 13.75 Smart Investing & Trading Score: 100 | |
| Day Percent Change: 2.54% Day Change: 0.34 | |
| Week Change: 3.77% Year-to-date Change: -0.4% | |
| NEWT Links: Profile News Message Board | |
| Charts:- Daily , Weekly | |
| Add NEWT to Watchlist: View: Get Complete NEWT Trend Analysis ➞ | |
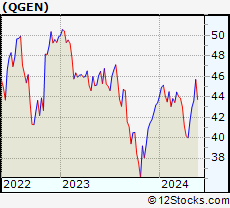 | QGEN QIAGEN N.V. |
| Sector: Services & Goods | |
| SubSector: Research Services | |
| MarketCap: 8698.94 Millions | |
| Recent Price: 43.26 Smart Investing & Trading Score: 76 | |
| Day Percent Change: 1.45% Day Change: 0.62 | |
| Week Change: -1.07% Year-to-date Change: -0.4% | |
| QGEN Links: Profile News Message Board | |
| Charts:- Daily , Weekly | |
| Add QGEN to Watchlist: View: Get Complete QGEN Trend Analysis ➞ | |
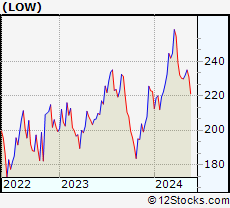 | LOW Lowe s Companies, Inc. |
| Sector: Services & Goods | |
| SubSector: Home Improvement Stores | |
| MarketCap: 56084.2 Millions | |
| Recent Price: 221.29 Smart Investing & Trading Score: 32 | |
| Day Percent Change: 2.71% Day Change: 5.83 | |
| Week Change: 2.83% Year-to-date Change: -0.6% | |
| LOW Links: Profile News Message Board | |
| Charts:- Daily , Weekly | |
| Add LOW to Watchlist: View: Get Complete LOW Trend Analysis ➞ | |
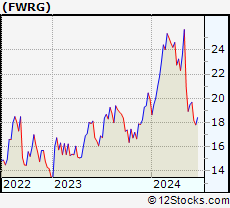 | FWRG First Watch Restaurant Group, Inc. |
| Sector: Services & Goods | |
| SubSector: Restaurants | |
| MarketCap: 1000 Millions | |
| Recent Price: 19.68 Smart Investing & Trading Score: 32 | |
| Day Percent Change: 1.18% Day Change: 0.23 | |
| Week Change: 0.92% Year-to-date Change: -1.3% | |
| FWRG Links: Profile News Message Board | |
| Charts:- Daily , Weekly | |
| Add FWRG to Watchlist: View: Get Complete FWRG Trend Analysis ➞ | |
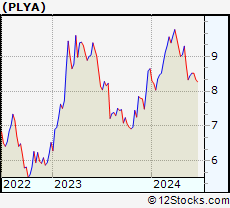 | PLYA Playa Hotels & Resorts N.V. |
| Sector: Services & Goods | |
| SubSector: Resorts & Casinos | |
| MarketCap: 360.194 Millions | |
| Recent Price: 8.52 Smart Investing & Trading Score: 32 | |
| Day Percent Change: 0.95% Day Change: 0.08 | |
| Week Change: 0.83% Year-to-date Change: -1.5% | |
| PLYA Links: Profile News Message Board | |
| Charts:- Daily , Weekly | |
| Add PLYA to Watchlist: View: Get Complete PLYA Trend Analysis ➞ | |
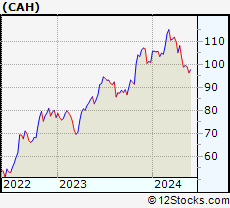 | CAH Cardinal Health, Inc. |
| Sector: Services & Goods | |
| SubSector: Drugs Wholesale | |
| MarketCap: 14509.9 Millions | |
| Recent Price: 99.27 Smart Investing & Trading Score: 49 | |
| Day Percent Change: 1.60% Day Change: 1.56 | |
| Week Change: 2.99% Year-to-date Change: -1.5% | |
| CAH Links: Profile News Message Board | |
| Charts:- Daily , Weekly | |
| Add CAH to Watchlist: View: Get Complete CAH Trend Analysis ➞ | |
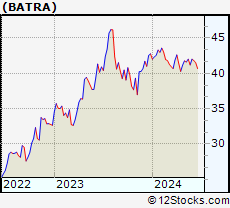 | BATRA The Liberty Braves Group |
| Sector: Services & Goods | |
| SubSector: Broadcasting - TV | |
| MarketCap: 18873.5 Millions | |
| Recent Price: 42.03 Smart Investing & Trading Score: 63 | |
| Day Percent Change: 2.19% Day Change: 0.90 | |
| Week Change: 2.01% Year-to-date Change: -1.8% | |
| BATRA Links: Profile News Message Board | |
| Charts:- Daily , Weekly | |
| Add BATRA to Watchlist: View: Get Complete BATRA Trend Analysis ➞ | |
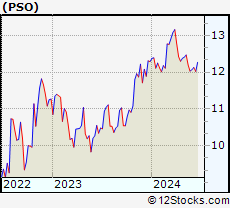 | PSO Pearson plc |
| Sector: Services & Goods | |
| SubSector: Publishing - Books | |
| MarketCap: 4595.42 Millions | |
| Recent Price: 12.07 Smart Investing & Trading Score: 32 | |
| Day Percent Change: 1.34% Day Change: 0.16 | |
| Week Change: 0.33% Year-to-date Change: -1.8% | |
| PSO Links: Profile News Message Board | |
| Charts:- Daily , Weekly | |
| Add PSO to Watchlist: View: Get Complete PSO Trend Analysis ➞ | |
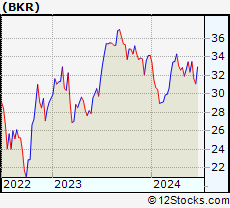 | BKR Baker Hughes Company |
| Sector: Services & Goods | |
| SubSector: Technical Services | |
| MarketCap: 1330 Millions | |
| Recent Price: 33.48 Smart Investing & Trading Score: 83 | |
| Day Percent Change: 3.08% Day Change: 1.00 | |
| Week Change: 3.43% Year-to-date Change: -2.1% | |
| BKR Links: Profile News Message Board | |
| Charts:- Daily , Weekly | |
| Add BKR to Watchlist: View: Get Complete BKR Trend Analysis ➞ | |
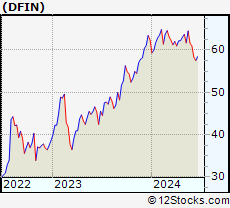 | DFIN Donnelley Financial Solutions, Inc. |
| Sector: Services & Goods | |
| SubSector: Business Services | |
| MarketCap: 229.882 Millions | |
| Recent Price: 60.96 Smart Investing & Trading Score: 18 | |
| Day Percent Change: 1.97% Day Change: 1.18 | |
| Week Change: -1.09% Year-to-date Change: -2.3% | |
| DFIN Links: Profile News Message Board | |
| Charts:- Daily , Weekly | |
| Add DFIN to Watchlist: View: Get Complete DFIN Trend Analysis ➞ | |
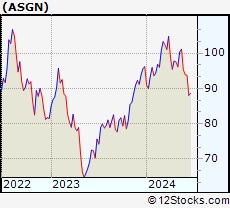 | ASGN ASGN Incorporated |
| Sector: Services & Goods | |
| SubSector: Staffing & Outsourcing Services | |
| MarketCap: 2035.88 Millions | |
| Recent Price: 93.91 Smart Investing & Trading Score: 25 | |
| Day Percent Change: 1.91% Day Change: 1.76 | |
| Week Change: -1.5% Year-to-date Change: -2.4% | |
| ASGN Links: Profile News Message Board | |
| Charts:- Daily , Weekly | |
| Add ASGN to Watchlist: View: Get Complete ASGN Trend Analysis ➞ | |
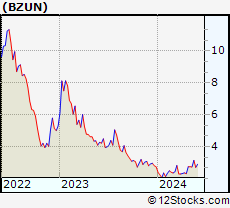 | BZUN Baozun Inc. |
| Sector: Services & Goods | |
| SubSector: Catalog & Mail Order Houses | |
| MarketCap: 1668.92 Millions | |
| Recent Price: 2.67 Smart Investing & Trading Score: 31 | |
| Day Percent Change: -3.96% Day Change: -0.11 | |
| Week Change: -1.48% Year-to-date Change: -2.6% | |
| BZUN Links: Profile News Message Board | |
| Charts:- Daily , Weekly | |
| Add BZUN to Watchlist: View: Get Complete BZUN Trend Analysis ➞ | |
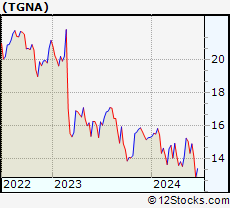 | TGNA TEGNA Inc. |
| Sector: Services & Goods | |
| SubSector: Broadcasting - TV | |
| MarketCap: 2791.83 Millions | |
| Recent Price: 14.91 Smart Investing & Trading Score: 78 | |
| Day Percent Change: 1.50% Day Change: 0.22 | |
| Week Change: 3.97% Year-to-date Change: -2.6% | |
| TGNA Links: Profile News Message Board | |
| Charts:- Daily , Weekly | |
| Add TGNA to Watchlist: View: Get Complete TGNA Trend Analysis ➞ | |
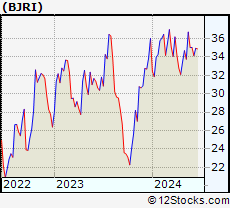 | BJRI BJ s Restaurants, Inc. |
| Sector: Services & Goods | |
| SubSector: Restaurants | |
| MarketCap: 183.67 Millions | |
| Recent Price: 35.04 Smart Investing & Trading Score: 55 | |
| Day Percent Change: -0.34% Day Change: -0.12 | |
| Week Change: 0.03% Year-to-date Change: -2.7% | |
| BJRI Links: Profile News Message Board | |
| Charts:- Daily , Weekly | |
| Add BJRI to Watchlist: View: Get Complete BJRI Trend Analysis ➞ | |
| For tabular summary view of above stock list: Summary View ➞ 0 - 25 , 25 - 50 , 50 - 75 , 75 - 100 , 100 - 125 , 125 - 150 , 150 - 175 , 175 - 200 , 200 - 225 , 225 - 250 , 250 - 275 , 275 - 300 , 300 - 325 , 325 - 350 , 350 - 375 , 375 - 400 , 400 - 425 , 425 - 450 , 450 - 475 | ||
| Click To Change The Sort Order: By Market Cap or Company Size Performance: Year-to-date, Week and Day | |
| Select Chart Type: | ||
|
Best Stocks Today 12Stocks.com |
© 2024 12Stocks.com Terms & Conditions Privacy Contact Us
All Information Provided Only For Education And Not To Be Used For Investing or Trading. See Terms & Conditions


One More Thing ... Get Best Stocks Delivered Daily!
Never Ever Miss A Move With Our Top Ten Stocks Lists
Find Best Stocks In Any Market - Bull or Bear Market
Take A Peek At Our Top Ten Stocks Lists: Daily, Weekly, Year-to-Date & Top Trends
Find Best Stocks In Any Market - Bull or Bear Market
Take A Peek At Our Top Ten Stocks Lists: Daily, Weekly, Year-to-Date & Top Trends
Consumer Services Stocks With Best Up Trends [0-bearish to 100-bullish]: Gap [100], Boqii Holding[100], Nordstrom [100], SunCar Technology[100], Boot Barn[100], Arhaus [100], Best Buy[100], Signet Jewelers[100], Nathan s[100], Barrett Business[100], Newtek Business[100]
Best Consumer Services Stocks Year-to-Date:
U Power[2896.65%], Vroom [1650.37%], Fluent [450.75%], Yatsen Holding[364.73%], Zhihu [244.75%], Sweetgreen [172.12%], Codere Online[156.85%], Faraday Future[152.88%], Research[128.72%], RealReal [114.43%], CAVA [112.86%] Best Consumer Services Stocks This Week:
Gap [38.04%], Chewy [28%], Boqii Holding[22.37%], GameStop [21.79%], Sunnova Energy[21.11%], D-Market Elektronik[20.72%], DICK S[19.83%], Burlington Stores[19.8%], Red Robin[19.29%], Best Buy[18.63%], Traeger [18%] Best Consumer Services Stocks Daily:
Gap [28.60%], Penn National[19.62%], Slair Broadcast[12.08%], Caesars Entertainment[11.65%], Conn s[10.49%], ECARX [10.09%], Yunji [9.95%], Olaplex [9.88%], IHS Holding[8.96%], Stitch Fix[8.81%], Boqii Holding[8.78%]