
 Login Sign Up


| |||||
 |  | ||||

| 12Stocks.com Market Intelligence |
Best Consumer Services Stocks
| In a hurry? Services & Goods Stocks: Performance Trends Table, Stock Charts
Sort Consumer Services: Daily, Weekly, Year-to-Date, Market Cap & Trends. Filter Services & Goods stocks list by size: All Large Mid-Range Small |
| 12Stocks.com Consumer Services Stocks Performances & Trends Daily | |||||||||
|
|  The overall Smart Investing & Trading Score is 25 (0-bearish to 100-bullish) which puts Consumer Services sector in short term bearish to neutral trend. The Smart Investing & Trading Score from previous trading session is 8 and an improvement of trend continues.
| ||||||||
Here are the Smart Investing & Trading Scores of the most requested Consumer Services stocks at 12Stocks.com (click stock name for detailed review):
|


| Consider signing up for our daily 12Stocks.com "Best Stocks Newsletter". You will never ever miss a big stock move again! |
| 12Stocks.com: Investing in Consumer Services sector with Stocks | |
|
The following table helps investors and traders sort through current performance and trends (as measured by Smart Investing & Trading Score) of various
stocks in the Consumer Services sector. Quick View: Move mouse or cursor over stock symbol (ticker) to view short-term Technical chart and over stock name to view long term chart. Click on  to add stock symbol to your watchlist and to add stock symbol to your watchlist and  to view watchlist. Click on any ticker or stock name for detailed market intelligence report for that stock. to view watchlist. Click on any ticker or stock name for detailed market intelligence report for that stock. |
12Stocks.com Performance of Stocks in Consumer Services Sector
| Ticker | Stock Name | Watchlist | Category | Recent Price | Smart Investing & Trading Score | Change % | YTD Change% |
| MAN | Manpower |   | Staffing | 74.62 | 61 | 1.91% | -6.10% |
| KBR | KBR | | Services | 65.66 | 61 | 1.25% | 18.50% |
| DXPE | DXP Enterprises | | Equipment | 49.68 | 61 | 1.20% | 47.42% |
| YUM | Yum! Brands | | Restaurants | 137.43 | 60 | 1.92% | 5.18% |
| TBI | TrueBlue | | Staffing | 10.80 | 60 | 1.41% | -29.60% |
| ASPS | Altisource Portfolio | | Services | 1.88 | 59 | 5.62% | -47.19% |
| BOWL | Bowlero | | Leisure | 12.45 | 59 | 2.72% | -11.83% |
| MED | Medifast | | Retail | 25.74 | 59 | -1.38% | -61.71% |
| SG | Sweetgreen | | Restaurants | 30.75 | 58 | 3.81% | 172.12% |
| CHH | Choice Hotels | | Lodging | 113.19 | 58 | 2.30% | -0.10% |
| TTEK | Tetra Tech | | Services | 209.49 | 58 | 0.20% | 25.50% |
| APEI | American Public | | Education | 17.40 | 58 | -4.24% | 80.31% |
| UTI | Universal Technical | | Education | 15.81 | 58 | -1.50% | 26.28% |
| LAUR | Laureate Education | | Education | 15.66 | 58 | -0.32% | 14.22% |
| IHG | InterContinental Hotels | | Lodging | 101.55 | 57 | 2.37% | 11.37% |
| FLWS | 1-800-FLOWERS.COM | | Retail | 9.68 | 57 | 2.11% | -10.20% |
| HURN | Huron Consulting | | Services | 88.31 | 57 | 2.78% | -14.10% |
| CATO | Cato | | Apparel | 6.00 | 57 | 0.33% | -15.97% |
| FCN | FTI Consulting | | Services | 214.80 | 56 | 0.66% | 7.86% |
| MCO | Moody s | | Services | 396.99 | 56 | 0.38% | 1.65% |
| BAH | Booz Allen | | Services | 152.21 | 56 | 0.32% | 19.00% |
| LOPE | Grand Canyon | | Education | 142.46 | 56 | 0.14% | 7.89% |
| WSO | Watsco | | Retail | 474.90 | 56 | 0.05% | 10.84% |
| RSVR | Reservoir Media | | Entertainment | 8.04 | 56 | -2.78% | 12.92% |
| ZH | Zhihu | | Internet Content & Information | 3.26 | 56 | -2.40% | 244.75% |
| For chart view version of above stock list: Chart View ➞ 0 - 25 , 25 - 50 , 50 - 75 , 75 - 100 , 100 - 125 , 125 - 150 , 150 - 175 , 175 - 200 , 200 - 225 , 225 - 250 , 250 - 275 , 275 - 300 , 300 - 325 , 325 - 350 , 350 - 375 , 375 - 400 , 400 - 425 , 425 - 450 , 450 - 475 | ||
 | Click To Change The Sort Order: By Market Cap or Company Size Performance: Year-to-date, Week and Day |  |
|
Get the most comprehensive stock market coverage daily at 12Stocks.com ➞ Best Stocks Today ➞ Best Stocks Weekly ➞ Best Stocks Year-to-Date ➞ Best Stocks Trends ➞  Best Stocks Today 12Stocks.com Best Nasdaq Stocks ➞ Best S&P 500 Stocks ➞ Best Tech Stocks ➞ Best Biotech Stocks ➞ |
| Detailed Overview of Consumer Services Stocks |
| Consumer Services Technical Overview, Leaders & Laggards, Top Consumer Services ETF Funds & Detailed Consumer Services Stocks List, Charts, Trends & More |
| Consumer Services Sector: Technical Analysis, Trends & YTD Performance | |
| Consumer Services sector is composed of stocks
from retail, entertainment, media/publishing, consumer goods
and services subsectors. Consumer Services sector, as represented by XLY, an exchange-traded fund [ETF] that holds basket of Consumer Services stocks (e.g, Walmart, Alibaba) is down by -1.59% and is currently underperforming the overall market by -11.38% year-to-date. Below is a quick view of Technical charts and trends: |
|
 XLY Weekly Chart |
|
| Long Term Trend: Not Good | |
| Medium Term Trend: Not Good | |
 XLY Daily Chart |
|
| Short Term Trend: Very Good | |
| Overall Trend Score: 25 | |
| YTD Performance: -1.59% | |
| **Trend Scores & Views Are Only For Educational Purposes And Not For Investing | |
| 12Stocks.com: Top Performing Consumer Services Sector Stocks | ||||||||||||||||||||||||||||||||||||||||||||||||
 The top performing Consumer Services sector stocks year to date are
Now, more recently, over last week, the top performing Consumer Services sector stocks on the move are


|
||||||||||||||||||||||||||||||||||||||||||||||||
| 12Stocks.com: Investing in Consumer Services Sector using Exchange Traded Funds | |
|
The following table shows list of key exchange traded funds (ETF) that
help investors track Consumer Services Index. For detailed view, check out our ETF Funds section of our website. Quick View: Move mouse or cursor over ETF symbol (ticker) to view short-term Technical chart and over ETF name to view long term chart. Click on ticker or stock name for detailed view. Click on to add stock symbol to your watchlist and to view watchlist. |
12Stocks.com List of ETFs that track Consumer Services Index
| Ticker | ETF Name | Watchlist | Recent Price | Smart Investing & Trading Score | Change % | Week % | Year-to-date % |
| XLY | Consumer Discret Sel | | 175.97 | 25 | 0.56 | 0.24 | -1.59% |
| RTH | Retail | | 200.42 | 32 | 0.79 | 0.6 | 6.48% |
| IYC | Consumer Services | | 78.26 | 8 | -0.36 | -0.92 | 3.29% |
| XRT | Retail | | 77.52 | 100 | 2.24 | 3.43 | 7.19% |
| IYK | Consumer Goods | | 65.97 | 61 | 0.59 | -1.18 | 3.23% |
| UCC | Consumer Services | | 33.50 | 42 | 1.25 | 0.24 | -6.7% |
| RETL | Retail Bull 3X | | 9.76 | 69 | 2.63 | 5.57 | 6.96% |
| RXI | Globl Consumer Discretionary | | 159.55 | 18 | 0.81 | -0.73 | 0.31% |
| SCC | Short Consumer Services | | 15.90 | 68 | -0.93 | -0.14 | 3.78% |
| UGE | Consumer Goods | | 17.74 | 83 | 2.95 | 0.34 | 12.68% |
| 12Stocks.com: Charts, Trends, Fundamental Data and Performances of Consumer Services Stocks | |
|
We now take in-depth look at all Consumer Services stocks including charts, multi-period performances and overall trends (as measured by Smart Investing & Trading Score). One can sort Consumer Services stocks (click link to choose) by Daily, Weekly and by Year-to-Date performances. Also, one can sort by size of the company or by market capitalization. |
| Select Your Default Chart Type: | |||||
| |||||
| Click on stock symbol or name for detailed view. Click on to add stock symbol to your watchlist and to view watchlist. Quick View: Move mouse or cursor over "Daily" to quickly view daily Technical stock chart and over "Weekly" to view weekly Technical stock chart. | |||||

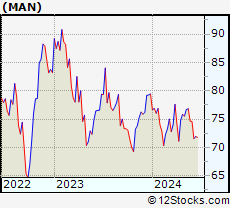 | MAN ManpowerGroup Inc. |
| Sector: Services & Goods | |
| SubSector: Staffing & Outsourcing Services | |
| MarketCap: 3436.28 Millions | |
| Recent Price: 74.62 Smart Investing & Trading Score: 61 | |
| Day Percent Change: 1.91% Day Change: 1.40 | |
| Week Change: -0.05% Year-to-date Change: -6.1% | |
| MAN Links: Profile News Message Board | |
| Charts:- Daily , Weekly | |
| Add MAN to Watchlist: View: Get Complete MAN Trend Analysis ➞ | |
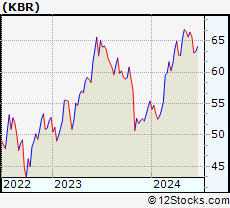 | KBR KBR, Inc. |
| Sector: Services & Goods | |
| SubSector: Technical Services | |
| MarketCap: 2526.1 Millions | |
| Recent Price: 65.66 Smart Investing & Trading Score: 61 | |
| Day Percent Change: 1.25% Day Change: 0.81 | |
| Week Change: -1.07% Year-to-date Change: 18.5% | |
| KBR Links: Profile News Message Board | |
| Charts:- Daily , Weekly | |
| Add KBR to Watchlist: View: Get Complete KBR Trend Analysis ➞ | |
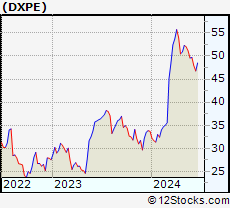 | DXPE DXP Enterprises, Inc. |
| Sector: Services & Goods | |
| SubSector: Industrial Equipment Wholesale | |
| MarketCap: 243.758 Millions | |
| Recent Price: 49.68 Smart Investing & Trading Score: 61 | |
| Day Percent Change: 1.20% Day Change: 0.59 | |
| Week Change: 0.16% Year-to-date Change: 47.4% | |
| DXPE Links: Profile News Message Board | |
| Charts:- Daily , Weekly | |
| Add DXPE to Watchlist: View: Get Complete DXPE Trend Analysis ➞ | |
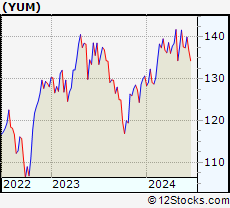 | YUM Yum! Brands, Inc. |
| Sector: Services & Goods | |
| SubSector: Restaurants | |
| MarketCap: 18033.3 Millions | |
| Recent Price: 137.43 Smart Investing & Trading Score: 60 | |
| Day Percent Change: 1.92% Day Change: 2.59 | |
| Week Change: -0.16% Year-to-date Change: 5.2% | |
| YUM Links: Profile News Message Board | |
| Charts:- Daily , Weekly | |
| Add YUM to Watchlist: View: Get Complete YUM Trend Analysis ➞ | |
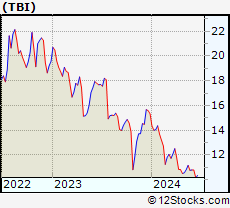 | TBI TrueBlue, Inc. |
| Sector: Services & Goods | |
| SubSector: Staffing & Outsourcing Services | |
| MarketCap: 563.228 Millions | |
| Recent Price: 10.80 Smart Investing & Trading Score: 60 | |
| Day Percent Change: 1.41% Day Change: 0.15 | |
| Week Change: 0.28% Year-to-date Change: -29.6% | |
| TBI Links: Profile News Message Board | |
| Charts:- Daily , Weekly | |
| Add TBI to Watchlist: View: Get Complete TBI Trend Analysis ➞ | |
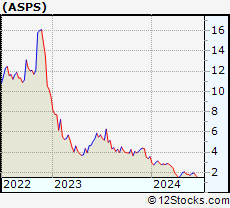 | ASPS Altisource Portfolio Solutions S.A. |
| Sector: Services & Goods | |
| SubSector: Business Services | |
| MarketCap: 120.382 Millions | |
| Recent Price: 1.88 Smart Investing & Trading Score: 59 | |
| Day Percent Change: 5.62% Day Change: 0.10 | |
| Week Change: 9.94% Year-to-date Change: -47.2% | |
| ASPS Links: Profile News Message Board | |
| Charts:- Daily , Weekly | |
| Add ASPS to Watchlist: View: Get Complete ASPS Trend Analysis ➞ | |
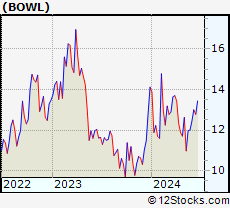 | BOWL Bowlero Corp. |
| Sector: Services & Goods | |
| SubSector: Leisure | |
| MarketCap: 2000 Millions | |
| Recent Price: 12.45 Smart Investing & Trading Score: 59 | |
| Day Percent Change: 2.72% Day Change: 0.33 | |
| Week Change: 3.71% Year-to-date Change: -11.8% | |
| BOWL Links: Profile News Message Board | |
| Charts:- Daily , Weekly | |
| Add BOWL to Watchlist: View: Get Complete BOWL Trend Analysis ➞ | |
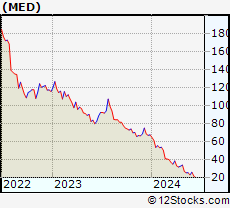 | MED Medifast, Inc. |
| Sector: Services & Goods | |
| SubSector: Specialty Retail, Other | |
| MarketCap: 681.044 Millions | |
| Recent Price: 25.74 Smart Investing & Trading Score: 59 | |
| Day Percent Change: -1.38% Day Change: -0.36 | |
| Week Change: 12.75% Year-to-date Change: -61.7% | |
| MED Links: Profile News Message Board | |
| Charts:- Daily , Weekly | |
| Add MED to Watchlist: View: Get Complete MED Trend Analysis ➞ | |
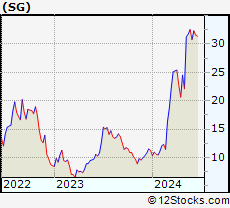 | SG Sweetgreen, Inc. |
| Sector: Services & Goods | |
| SubSector: Restaurants | |
| MarketCap: 1420 Millions | |
| Recent Price: 30.75 Smart Investing & Trading Score: 58 | |
| Day Percent Change: 3.81% Day Change: 1.13 | |
| Week Change: -5.44% Year-to-date Change: 172.1% | |
| SG Links: Profile News Message Board | |
| Charts:- Daily , Weekly | |
| Add SG to Watchlist: View: Get Complete SG Trend Analysis ➞ | |
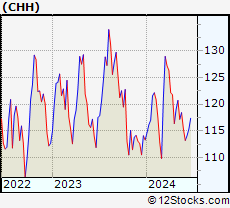 | CHH Choice Hotels International, Inc. |
| Sector: Services & Goods | |
| SubSector: Lodging | |
| MarketCap: 3427.56 Millions | |
| Recent Price: 113.19 Smart Investing & Trading Score: 58 | |
| Day Percent Change: 2.30% Day Change: 2.55 | |
| Week Change: -1.93% Year-to-date Change: -0.1% | |
| CHH Links: Profile News Message Board | |
| Charts:- Daily , Weekly | |
| Add CHH to Watchlist: View: Get Complete CHH Trend Analysis ➞ | |
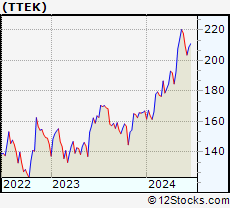 | TTEK Tetra Tech, Inc. |
| Sector: Services & Goods | |
| SubSector: Technical Services | |
| MarketCap: 3985.5 Millions | |
| Recent Price: 209.49 Smart Investing & Trading Score: 58 | |
| Day Percent Change: 0.20% Day Change: 0.42 | |
| Week Change: -3.85% Year-to-date Change: 25.5% | |
| TTEK Links: Profile News Message Board | |
| Charts:- Daily , Weekly | |
| Add TTEK to Watchlist: View: Get Complete TTEK Trend Analysis ➞ | |
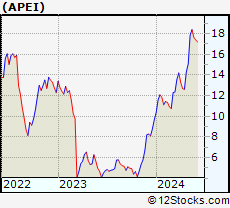 | APEI American Public Education, Inc. |
| Sector: Services & Goods | |
| SubSector: Education & Training Services | |
| MarketCap: 361.306 Millions | |
| Recent Price: 17.40 Smart Investing & Trading Score: 58 | |
| Day Percent Change: -4.24% Day Change: -0.77 | |
| Week Change: -1.3% Year-to-date Change: 80.3% | |
| APEI Links: Profile News Message Board | |
| Charts:- Daily , Weekly | |
| Add APEI to Watchlist: View: Get Complete APEI Trend Analysis ➞ | |
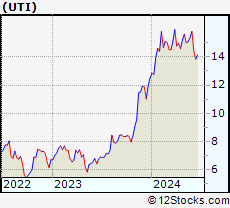 | UTI Universal Technical Institute, Inc. |
| Sector: Services & Goods | |
| SubSector: Education & Training Services | |
| MarketCap: 163.506 Millions | |
| Recent Price: 15.81 Smart Investing & Trading Score: 58 | |
| Day Percent Change: -1.50% Day Change: -0.24 | |
| Week Change: 3% Year-to-date Change: 26.3% | |
| UTI Links: Profile News Message Board | |
| Charts:- Daily , Weekly | |
| Add UTI to Watchlist: View: Get Complete UTI Trend Analysis ➞ | |
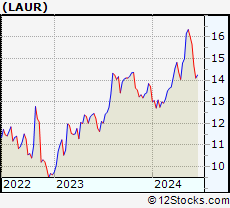 | LAUR Laureate Education, Inc. |
| Sector: Services & Goods | |
| SubSector: Education & Training Services | |
| MarketCap: 2258.56 Millions | |
| Recent Price: 15.66 Smart Investing & Trading Score: 58 | |
| Day Percent Change: -0.32% Day Change: -0.05 | |
| Week Change: -2.25% Year-to-date Change: 14.2% | |
| LAUR Links: Profile News Message Board | |
| Charts:- Daily , Weekly | |
| Add LAUR to Watchlist: View: Get Complete LAUR Trend Analysis ➞ | |
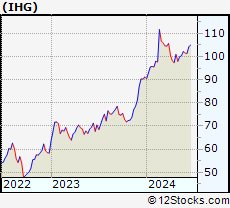 | IHG InterContinental Hotels Group PLC |
| Sector: Services & Goods | |
| SubSector: Lodging | |
| MarketCap: 6387.46 Millions | |
| Recent Price: 101.55 Smart Investing & Trading Score: 57 | |
| Day Percent Change: 2.37% Day Change: 2.35 | |
| Week Change: -0.66% Year-to-date Change: 11.4% | |
| IHG Links: Profile News Message Board | |
| Charts:- Daily , Weekly | |
| Add IHG to Watchlist: View: Get Complete IHG Trend Analysis ➞ | |
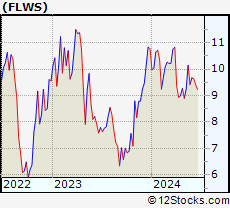 | FLWS 1-800-FLOWERS.COM, Inc. |
| Sector: Services & Goods | |
| SubSector: Specialty Retail, Other | |
| MarketCap: 940 Millions | |
| Recent Price: 9.68 Smart Investing & Trading Score: 57 | |
| Day Percent Change: 2.11% Day Change: 0.20 | |
| Week Change: 2.76% Year-to-date Change: -10.2% | |
| FLWS Links: Profile News Message Board | |
| Charts:- Daily , Weekly | |
| Add FLWS to Watchlist: View: Get Complete FLWS Trend Analysis ➞ | |
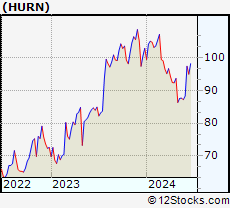 | HURN Huron Consulting Group Inc. |
| Sector: Services & Goods | |
| SubSector: Management Services | |
| MarketCap: 968.645 Millions | |
| Recent Price: 88.31 Smart Investing & Trading Score: 57 | |
| Day Percent Change: 2.78% Day Change: 2.39 | |
| Week Change: 1.31% Year-to-date Change: -14.1% | |
| HURN Links: Profile News Message Board | |
| Charts:- Daily , Weekly | |
| Add HURN to Watchlist: View: Get Complete HURN Trend Analysis ➞ | |
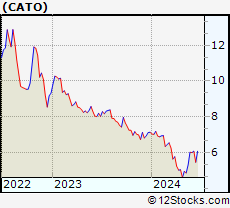 | CATO The Cato Corporation |
| Sector: Services & Goods | |
| SubSector: Apparel Stores | |
| MarketCap: 305.208 Millions | |
| Recent Price: 6.00 Smart Investing & Trading Score: 57 | |
| Day Percent Change: 0.33% Day Change: 0.02 | |
| Week Change: -0.33% Year-to-date Change: -16.0% | |
| CATO Links: Profile News Message Board | |
| Charts:- Daily , Weekly | |
| Add CATO to Watchlist: View: Get Complete CATO Trend Analysis ➞ | |
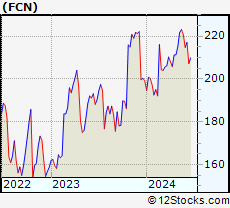 | FCN FTI Consulting, Inc. |
| Sector: Services & Goods | |
| SubSector: Management Services | |
| MarketCap: 4485.05 Millions | |
| Recent Price: 214.80 Smart Investing & Trading Score: 56 | |
| Day Percent Change: 0.66% Day Change: 1.40 | |
| Week Change: -2.71% Year-to-date Change: 7.9% | |
| FCN Links: Profile News Message Board | |
| Charts:- Daily , Weekly | |
| Add FCN to Watchlist: View: Get Complete FCN Trend Analysis ➞ | |
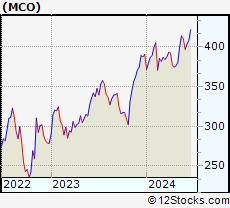 | MCO Moody s Corporation |
| Sector: Services & Goods | |
| SubSector: Business Services | |
| MarketCap: 35998.5 Millions | |
| Recent Price: 396.99 Smart Investing & Trading Score: 56 | |
| Day Percent Change: 0.38% Day Change: 1.49 | |
| Week Change: -3.31% Year-to-date Change: 1.7% | |
| MCO Links: Profile News Message Board | |
| Charts:- Daily , Weekly | |
| Add MCO to Watchlist: View: Get Complete MCO Trend Analysis ➞ | |
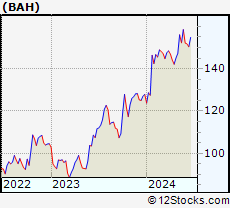 | BAH Booz Allen Hamilton Holding Corporation |
| Sector: Services & Goods | |
| SubSector: Management Services | |
| MarketCap: 9037.35 Millions | |
| Recent Price: 152.21 Smart Investing & Trading Score: 56 | |
| Day Percent Change: 0.32% Day Change: 0.48 | |
| Week Change: -3.97% Year-to-date Change: 19.0% | |
| BAH Links: Profile News Message Board | |
| Charts:- Daily , Weekly | |
| Add BAH to Watchlist: View: Get Complete BAH Trend Analysis ➞ | |
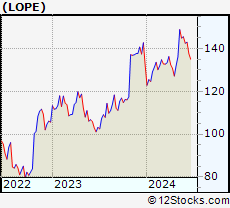 | LOPE Grand Canyon Education, Inc. |
| Sector: Services & Goods | |
| SubSector: Education & Training Services | |
| MarketCap: 3073.56 Millions | |
| Recent Price: 142.46 Smart Investing & Trading Score: 56 | |
| Day Percent Change: 0.14% Day Change: 0.20 | |
| Week Change: -2.06% Year-to-date Change: 7.9% | |
| LOPE Links: Profile News Message Board | |
| Charts:- Daily , Weekly | |
| Add LOPE to Watchlist: View: Get Complete LOPE Trend Analysis ➞ | |
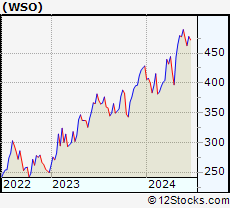 | WSO Watsco, Inc. |
| Sector: Services & Goods | |
| SubSector: Electronics Wholesale | |
| MarketCap: 6000.33 Millions | |
| Recent Price: 474.90 Smart Investing & Trading Score: 56 | |
| Day Percent Change: 0.05% Day Change: 0.25 | |
| Week Change: -2.99% Year-to-date Change: 10.8% | |
| WSO Links: Profile News Message Board | |
| Charts:- Daily , Weekly | |
| Add WSO to Watchlist: View: Get Complete WSO Trend Analysis ➞ | |
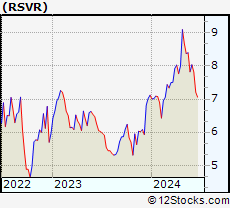 | RSVR Reservoir Media, Inc. |
| Sector: Services & Goods | |
| SubSector: Entertainment | |
| MarketCap: 389 Millions | |
| Recent Price: 8.04 Smart Investing & Trading Score: 56 | |
| Day Percent Change: -2.78% Day Change: -0.23 | |
| Week Change: 2.75% Year-to-date Change: 12.9% | |
| RSVR Links: Profile News Message Board | |
| Charts:- Daily , Weekly | |
| Add RSVR to Watchlist: View: Get Complete RSVR Trend Analysis ➞ | |
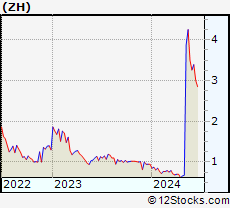 | ZH Zhihu Inc. |
| Sector: Services & Goods | |
| SubSector: Internet Content & Information | |
| MarketCap: 741 Millions | |
| Recent Price: 3.26 Smart Investing & Trading Score: 56 | |
| Day Percent Change: -2.40% Day Change: -0.08 | |
| Week Change: -6.72% Year-to-date Change: 244.8% | |
| ZH Links: Profile News Message Board | |
| Charts:- Daily , Weekly | |
| Add ZH to Watchlist: View: Get Complete ZH Trend Analysis ➞ | |
| For tabular summary view of above stock list: Summary View ➞ 0 - 25 , 25 - 50 , 50 - 75 , 75 - 100 , 100 - 125 , 125 - 150 , 150 - 175 , 175 - 200 , 200 - 225 , 225 - 250 , 250 - 275 , 275 - 300 , 300 - 325 , 325 - 350 , 350 - 375 , 375 - 400 , 400 - 425 , 425 - 450 , 450 - 475 | ||
| Click To Change The Sort Order: By Market Cap or Company Size Performance: Year-to-date, Week and Day | |
| Select Chart Type: | ||
|
Best Stocks Today 12Stocks.com |
© 2024 12Stocks.com Terms & Conditions Privacy Contact Us
All Information Provided Only For Education And Not To Be Used For Investing or Trading. See Terms & Conditions


One More Thing ... Get Best Stocks Delivered Daily!
Never Ever Miss A Move With Our Top Ten Stocks Lists
Find Best Stocks In Any Market - Bull or Bear Market
Take A Peek At Our Top Ten Stocks Lists: Daily, Weekly, Year-to-Date & Top Trends
Find Best Stocks In Any Market - Bull or Bear Market
Take A Peek At Our Top Ten Stocks Lists: Daily, Weekly, Year-to-Date & Top Trends
Consumer Services Stocks With Best Up Trends [0-bearish to 100-bullish]: Gap [100], Boqii Holding[100], Nordstrom [100], SunCar Technology[100], Boot Barn[100], Arhaus [100], Best Buy[100], Signet Jewelers[100], Nathan s[100], Barrett Business[100], Newtek Business[100]
Best Consumer Services Stocks Year-to-Date:
U Power[2896.65%], Vroom [1650.37%], Fluent [450.75%], Yatsen Holding[364.73%], Zhihu [244.75%], Sweetgreen [172.12%], Codere Online[156.85%], Faraday Future[152.88%], Research[128.72%], RealReal [114.43%], CAVA [112.86%] Best Consumer Services Stocks This Week:
Gap [38.04%], Chewy [28%], Boqii Holding[22.37%], GameStop [21.79%], Sunnova Energy[21.11%], D-Market Elektronik[20.72%], DICK S[19.83%], Burlington Stores[19.8%], Red Robin[19.29%], Best Buy[18.63%], Traeger [18%] Best Consumer Services Stocks Daily:
Gap [28.60%], Penn National[19.62%], Slair Broadcast[12.08%], Caesars Entertainment[11.65%], Conn s[10.49%], ECARX [10.09%], Yunji [9.95%], Olaplex [9.88%], IHS Holding[8.96%], Stitch Fix[8.81%], Boqii Holding[8.78%]