
 Login Sign Up


| |||||
 |  | ||||

| 12Stocks.com Market Intelligence |
Best Tech Stocks
| In a hurry? Tech Stocks Lists: Performance & Trends, Stock Charts, FANG Stocks
Sort Tech stocks: Daily, Weekly, Year-to-Date, Market Cap & Trends. Filter Tech stocks list by size:All Tech Large Mid-Range Small and MicroCap |
| 12Stocks.com Tech Stocks Performances & Trends Daily | |||||||||
|
|  The overall Smart Investing & Trading Score is 100 (0-bearish to 100-bullish) which puts Technology sector in short term bullish trend. The Smart Investing & Trading Score from previous trading session is 80 and an improvement of trend continues.
| ||||||||
Here are the Smart Investing & Trading Scores of the most requested Technology stocks at 12Stocks.com (click stock name for detailed review):
|


| 12Stocks.com: Investing in Technology sector with Stocks | |
|
The following table helps investors and traders sort through current performance and trends (as measured by Smart Investing & Trading Score) of various
stocks in the Tech sector. Quick View: Move mouse or cursor over stock symbol (ticker) to view short-term technical chart and over stock name to view long term chart. Click on  to add stock symbol to your watchlist and to add stock symbol to your watchlist and  to view watchlist. Click on any ticker or stock name for detailed market intelligence report for that stock. to view watchlist. Click on any ticker or stock name for detailed market intelligence report for that stock. |
12Stocks.com Performance of Stocks in Tech Sector
| Ticker | Stock Name | Watchlist | Category | Recent Price | Smart Investing & Trading Score | Change % | Weekly Change% |
| ELTK | Eltek |   | Circuit Boards | 11.10 | 48 | 2.87% | 3.11% |
| VUZI | Vuzix | | Electronic | 1.40 | 73 | 1.82% | 2.94% |
| GIGM | GigaMedia | | Software | 1.36 | 90 | 2.26% | 2.64% |
| AWRE | Aware | | Software | 1.88 | 85 | 1.08% | 2.45% |
| AIRG | Airgain | | Communication | 5.46 | 70 | -2.24% | 2.15% |
| BOSC | B.O.S. Better | | Communication | 2.87 | 52 | 0.35% | 2.14% |
| NSYS | Nortech Systems | | Electronics | 11.12 | 32 | 2.77% | 2.11% |
| NTIP | Network-1 | | Communication | 1.69 | 42 | 3.37% | 1.81% |
| SOL | ReneSola | | Semiconductor | 1.73 | 42 | 4.22% | 1.76% |
| WORX | SCWorx | | Internet | 2.05 | 57 | 4.06% | 1.49% |
| ELSE | Electro-Sensors | | Instruments | 4.10 | 74 | 0.99% | 1.47% |
| QUIK | QuickLogic | | Semiconductor | 12.13 | 42 | 4.30% | 1.17% |
| VTSI | VirTra | | Software | 8.23 | 25 | 1.48% | 0.73% |
| BKTI | BK | | Communication | 13.24 | 25 | 0.99% | 0.68% |
| LIVE | Live Ventures | | Internet | 24.68 | 42 | -2.45% | 0.65% |
| MVIS | MicroVision | | Instruments | 1.06 | 25 | -1.85% | 0.47% |
| XELA | Exela | | Software | 2.36 | 10 | 2.16% | 0.43% |
| TSRI | TSR | | Software | 13.30 | 71 | 0.14% | 0.30% |
| CPSH | CPS | | Electronics | 1.72 | 28 | -0.29% | 0.29% |
| MSN | Emerson Radio | | Electronic | 0.54 | 32 | 1.17% | 0.28% |
| MNDO | MIND C.T.I | | IT | 1.87 | 40 | 0.27% | 0.27% |
| LINK | Interlink Electronics | | Electronics | 4.41 | 35 | 6.59% | 0.07% |
| CLPS | CLPS In | | IT | 0.91 | 17 | 2.25% | 0.00% |
| EMKR | EMCORE | | Semiconductor | 0.89 | 51 | 9.48% | -0.02% |
| SGMA | SigmaTron | | Circuit Boards | 4.96 | 66 | -2.46% | -0.10% |
| For chart view version of above stock list: Chart View ➞ 0 - 25 , 25 - 50 , 50 - 75 , 75 - 100 | ||
 | Click To Change The Sort Order: By Market Cap or Company Size Performance: Year-to-date, Week and Day |  |
|
Get the most comprehensive stock market coverage daily at 12Stocks.com ➞ Best Stocks Today ➞ Best Stocks Weekly ➞ Best Stocks Year-to-Date ➞ Best Stocks Trends ➞  Best Stocks Today 12Stocks.com Best Nasdaq Stocks ➞ Best S&P 500 Stocks ➞ Best Tech Stocks ➞ Best Biotech Stocks ➞ |
| Detailed Overview of Tech Stocks |
| Tech Technical Overview, Leaders & Laggards, Top Tech ETF Funds & Detailed Tech Stocks List, Charts, Trends & More |
| Tech Sector: Technical Analysis, Trends & YTD Performance | |
| Technology sector is composed of stocks
from semiconductors, software, web, social media
and services subsectors. Technology sector, as represented by XLK, an exchange-traded fund [ETF] that holds basket of tech stocks (e.g, Intel, Google) is up by 16.92% and is currently outperforming the overall market by 4.46% year-to-date. Below is a quick view of technical charts and trends: |
|
 XLK Weekly Chart |
|
| Long Term Trend: Very Good | |
| Medium Term Trend: Very Good | |
 XLK Daily Chart |
|
| Short Term Trend: Very Good | |
| Overall Trend Score: 100 | |
| YTD Performance: 16.92% | |
| **Trend Scores & Views Are Only For Educational Purposes And Not For Investing | |
| 12Stocks.com: Top Performing Technology Sector Stocks | ||||||||||||||||||||||||||||||||||||||||||||||||
 The top performing Technology sector stocks year to date are
Now, more recently, over last week, the top performing Technology sector stocks on the move are


|
||||||||||||||||||||||||||||||||||||||||||||||||
| 12Stocks.com: Investing in Tech Sector using Exchange Traded Funds | |
|
The following table shows list of key exchange traded funds (ETF) that
help investors track Tech Index. For detailed view, check out our ETF Funds section of our website. Quick View: Move mouse or cursor over ETF symbol (ticker) to view short-term technical chart and over ETF name to view long term chart. Click on ticker or stock name for detailed view. Click on to add stock symbol to your watchlist and to view watchlist. |
12Stocks.com List of ETFs that track Tech Index
| Ticker | ETF Name | Watchlist | Recent Price | Smart Investing & Trading Score | Change % | Week % | Year-to-date % |
| XLK | Technology | | 225.04 | 100 | 2.21 | 4.38 | 16.92% |
| QQQ | QQQ | | 474.15 | 100 | 1.32 | 2.45 | 15.78% |
| IYW | Technology | | 149.26 | 100 | 2.25 | 4.2 | 21.6% |
| VGT | Information Technology | | 571.52 | 100 | 2.15 | 4.36 | 18.08% |
| IXN | Global Tech | | 82.49 | 95 | 2.69 | 4.19 | 20.99% |
| IGV | Tech-Software | | 82.72 | 57 | 2.27 | 3.08 | 1.96% |
| XSD | Semiconductor | | 256.17 | 100 | 2.76 | 4.82 | 13.96% |
| TQQQ | QQQ | | 71.98 | 100 | 3.97 | 7.24 | 41.97% |
| SQQQ | Short QQQ | | 8.68 | 0 | -3.88 | -6.87 | -35.46% |
| SOXL | Semicondct Bull 3X | | 58.72 | 100 | 8.40 | 13.21 | 87.01% |
| SOXS | Semicondct Bear 3X | | 22.10 | 26 | -8.26 | -12.96 | 279.73% |
| SOXX | PHLX Semiconductor | | 250.23 | 100 | 2.82 | 4.46 | 30.31% |
| QTEC | First -100-Tech | | 196.13 | 95 | 1.88 | 3.5 | 11.77% |
| SMH | Semiconductor | | 263.09 | 100 | 2.98 | 4.31 | 50.45% |
| 12Stocks.com: Charts, Trends, Fundamental Data and Performances of Tech Stocks | |
|
We now take in-depth look at all Tech stocks including charts, multi-period performances and overall trends (as measured by Smart Investing & Trading Score). One can sort Tech stocks (click link to choose) by Daily, Weekly and by Year-to-Date performances. Also, one can sort by size of the company or by market capitalization. |
| Select Your Default Chart Type: | |||||
| |||||
| Click on stock symbol or name for detailed view. Click on to add stock symbol to your watchlist and to view watchlist. Quick View: Move mouse or cursor over "Daily" to quickly view daily technical stock chart and over "Weekly" to view weekly technical stock chart. | |||||


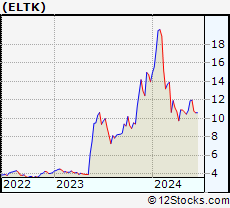 | ELTK Eltek Ltd. |
| Sector: Technology | |
| SubSector: Printed Circuit Boards | |
| MarketCap: 14.1235 Millions | |
| Recent Price: 11.10 Smart Investing & Trading Score: 48 | |
| Day Percent Change: 2.87% Day Change: 0.31 | |
| Week Change: 3.11% Year-to-date Change: -20.4% | |
| ELTK Links: Profile News Message Board | |
| Charts:- Daily , Weekly | |
| Add ELTK to Watchlist: View: Get Complete ELTK Trend Analysis ➞ | |
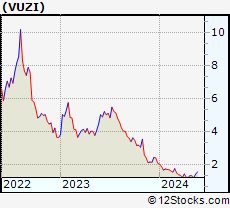 | VUZI Vuzix Corporation |
| Sector: Technology | |
| SubSector: Electronic Equipment | |
| MarketCap: 44.37 Millions | |
| Recent Price: 1.40 Smart Investing & Trading Score: 73 | |
| Day Percent Change: 1.82% Day Change: 0.02 | |
| Week Change: 2.94% Year-to-date Change: -32.9% | |
| VUZI Links: Profile News Message Board | |
| Charts:- Daily , Weekly | |
| Add VUZI to Watchlist: View: Get Complete VUZI Trend Analysis ➞ | |
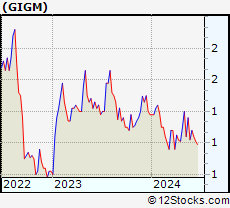 | GIGM GigaMedia Limited |
| Sector: Technology | |
| SubSector: Multimedia & Graphics Software | |
| MarketCap: 25.6586 Millions | |
| Recent Price: 1.36 Smart Investing & Trading Score: 90 | |
| Day Percent Change: 2.26% Day Change: 0.03 | |
| Week Change: 2.64% Year-to-date Change: -2.5% | |
| GIGM Links: Profile News Message Board | |
| Charts:- Daily , Weekly | |
| Add GIGM to Watchlist: View: Get Complete GIGM Trend Analysis ➞ | |
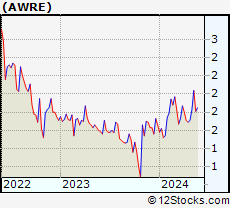 | AWRE Aware, Inc. |
| Sector: Technology | |
| SubSector: Application Software | |
| MarketCap: 56.0662 Millions | |
| Recent Price: 1.88 Smart Investing & Trading Score: 85 | |
| Day Percent Change: 1.08% Day Change: 0.02 | |
| Week Change: 2.45% Year-to-date Change: 13.3% | |
| AWRE Links: Profile News Message Board | |
| Charts:- Daily , Weekly | |
| Add AWRE to Watchlist: View: Get Complete AWRE Trend Analysis ➞ | |
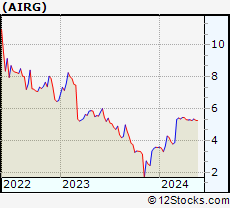 | AIRG Airgain, Inc. |
| Sector: Technology | |
| SubSector: Communication Equipment | |
| MarketCap: 65.9539 Millions | |
| Recent Price: 5.46 Smart Investing & Trading Score: 70 | |
| Day Percent Change: -2.24% Day Change: -0.13 | |
| Week Change: 2.15% Year-to-date Change: 53.5% | |
| AIRG Links: Profile News Message Board | |
| Charts:- Daily , Weekly | |
| Add AIRG to Watchlist: View: Get Complete AIRG Trend Analysis ➞ | |
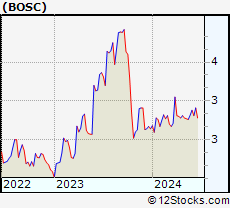 | BOSC B.O.S. Better Online Solutions Ltd. |
| Sector: Technology | |
| SubSector: Communication Equipment | |
| MarketCap: 6.23539 Millions | |
| Recent Price: 2.87 Smart Investing & Trading Score: 52 | |
| Day Percent Change: 0.35% Day Change: 0.01 | |
| Week Change: 2.14% Year-to-date Change: 8.7% | |
| BOSC Links: Profile News Message Board | |
| Charts:- Daily , Weekly | |
| Add BOSC to Watchlist: View: Get Complete BOSC Trend Analysis ➞ | |
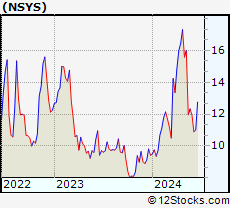 | NSYS Nortech Systems Incorporated |
| Sector: Technology | |
| SubSector: Diversified Electronics | |
| MarketCap: 7.77396 Millions | |
| Recent Price: 11.12 Smart Investing & Trading Score: 32 | |
| Day Percent Change: 2.77% Day Change: 0.30 | |
| Week Change: 2.11% Year-to-date Change: 18.1% | |
| NSYS Links: Profile News Message Board | |
| Charts:- Daily , Weekly | |
| Add NSYS to Watchlist: View: Get Complete NSYS Trend Analysis ➞ | |
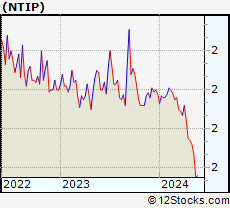 | NTIP Network-1 Technologies, Inc. |
| Sector: Technology | |
| SubSector: Communication Equipment | |
| MarketCap: 48.4539 Millions | |
| Recent Price: 1.69 Smart Investing & Trading Score: 42 | |
| Day Percent Change: 3.37% Day Change: 0.06 | |
| Week Change: 1.81% Year-to-date Change: -22.7% | |
| NTIP Links: Profile News Message Board | |
| Charts:- Daily , Weekly | |
| Add NTIP to Watchlist: View: Get Complete NTIP Trend Analysis ➞ | |
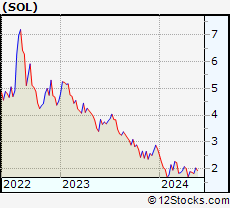 | SOL ReneSola Ltd |
| Sector: Technology | |
| SubSector: Semiconductor - Specialized | |
| MarketCap: 45.366 Millions | |
| Recent Price: 1.73 Smart Investing & Trading Score: 42 | |
| Day Percent Change: 4.22% Day Change: 0.07 | |
| Week Change: 1.76% Year-to-date Change: -36.6% | |
| SOL Links: Profile News Message Board | |
| Charts:- Daily , Weekly | |
| Add SOL to Watchlist: View: Get Complete SOL Trend Analysis ➞ | |
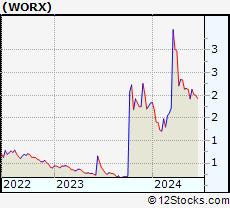 | WORX SCWorx Corp. |
| Sector: Technology | |
| SubSector: Internet Software & Services | |
| MarketCap: 16.1991 Millions | |
| Recent Price: 2.05 Smart Investing & Trading Score: 57 | |
| Day Percent Change: 4.06% Day Change: 0.08 | |
| Week Change: 1.49% Year-to-date Change: 12.0% | |
| WORX Links: Profile News Message Board | |
| Charts:- Daily , Weekly | |
| Add WORX to Watchlist: View: Get Complete WORX Trend Analysis ➞ | |
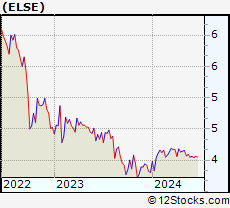 | ELSE Electro-Sensors, Inc. |
| Sector: Technology | |
| SubSector: Scientific & Technical Instruments | |
| MarketCap: 9.72553 Millions | |
| Recent Price: 4.10 Smart Investing & Trading Score: 74 | |
| Day Percent Change: 0.99% Day Change: 0.04 | |
| Week Change: 1.47% Year-to-date Change: 7.9% | |
| ELSE Links: Profile News Message Board | |
| Charts:- Daily , Weekly | |
| Add ELSE to Watchlist: View: Get Complete ELSE Trend Analysis ➞ | |
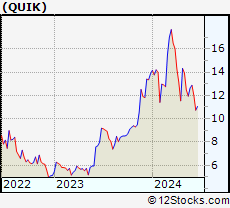 | QUIK QuickLogic Corporation |
| Sector: Technology | |
| SubSector: Semiconductor - Integrated Circuits | |
| MarketCap: 25.751 Millions | |
| Recent Price: 12.13 Smart Investing & Trading Score: 42 | |
| Day Percent Change: 4.30% Day Change: 0.50 | |
| Week Change: 1.17% Year-to-date Change: -12.5% | |
| QUIK Links: Profile News Message Board | |
| Charts:- Daily , Weekly | |
| Add QUIK to Watchlist: View: Get Complete QUIK Trend Analysis ➞ | |
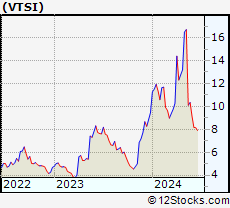 | VTSI VirTra, Inc. |
| Sector: Technology | |
| SubSector: Multimedia & Graphics Software | |
| MarketCap: 17.5586 Millions | |
| Recent Price: 8.23 Smart Investing & Trading Score: 25 | |
| Day Percent Change: 1.48% Day Change: 0.12 | |
| Week Change: 0.73% Year-to-date Change: -13.0% | |
| VTSI Links: Profile News Message Board | |
| Charts:- Daily , Weekly | |
| Add VTSI to Watchlist: View: Get Complete VTSI Trend Analysis ➞ | |
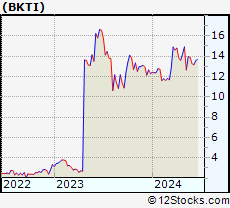 | BKTI BK Technologies Corporation |
| Sector: Technology | |
| SubSector: Communication Equipment | |
| MarketCap: 15.6539 Millions | |
| Recent Price: 13.24 Smart Investing & Trading Score: 25 | |
| Day Percent Change: 0.99% Day Change: 0.13 | |
| Week Change: 0.68% Year-to-date Change: 7.8% | |
| BKTI Links: Profile News Message Board | |
| Charts:- Daily , Weekly | |
| Add BKTI to Watchlist: View: Get Complete BKTI Trend Analysis ➞ | |
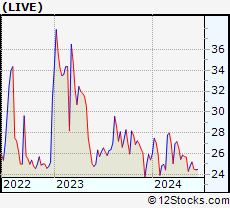 | LIVE Live Ventures Incorporated |
| Sector: Technology | |
| SubSector: Internet Information Providers | |
| MarketCap: 7.7808 Millions | |
| Recent Price: 24.68 Smart Investing & Trading Score: 42 | |
| Day Percent Change: -2.45% Day Change: -0.62 | |
| Week Change: 0.65% Year-to-date Change: -2.8% | |
| LIVE Links: Profile News Message Board | |
| Charts:- Daily , Weekly | |
| Add LIVE to Watchlist: View: Get Complete LIVE Trend Analysis ➞ | |
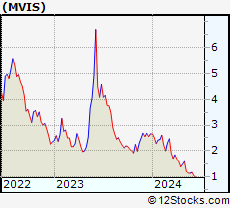 | MVIS MicroVision, Inc. |
| Sector: Technology | |
| SubSector: Scientific & Technical Instruments | |
| MarketCap: 32.1553 Millions | |
| Recent Price: 1.06 Smart Investing & Trading Score: 25 | |
| Day Percent Change: -1.85% Day Change: -0.02 | |
| Week Change: 0.47% Year-to-date Change: -60.2% | |
| MVIS Links: Profile News Message Board | |
| Charts:- Daily , Weekly | |
| Add MVIS to Watchlist: View: Get Complete MVIS Trend Analysis ➞ | |
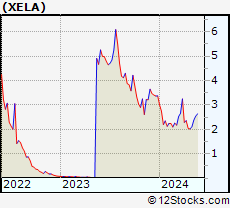 | XELA Exela Technologies, Inc. |
| Sector: Technology | |
| SubSector: Business Software & Services | |
| MarketCap: 36.8758 Millions | |
| Recent Price: 2.36 Smart Investing & Trading Score: 10 | |
| Day Percent Change: 2.16% Day Change: 0.05 | |
| Week Change: 0.43% Year-to-date Change: -30.1% | |
| XELA Links: Profile News Message Board | |
| Charts:- Daily , Weekly | |
| Add XELA to Watchlist: View: Get Complete XELA Trend Analysis ➞ | |
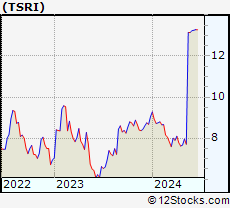 | TSRI TSR, Inc. |
| Sector: Technology | |
| SubSector: Business Software & Services | |
| MarketCap: 6.01758 Millions | |
| Recent Price: 13.30 Smart Investing & Trading Score: 71 | |
| Day Percent Change: 0.14% Day Change: 0.02 | |
| Week Change: 0.3% Year-to-date Change: 46.9% | |
| TSRI Links: Profile News Message Board | |
| Charts:- Daily , Weekly | |
| Add TSRI to Watchlist: View: Get Complete TSRI Trend Analysis ➞ | |
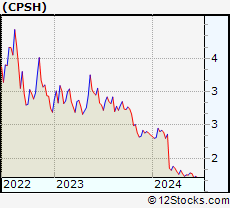 | CPSH CPS Technologies Corporation |
| Sector: Technology | |
| SubSector: Diversified Electronics | |
| MarketCap: 13.7396 Millions | |
| Recent Price: 1.72 Smart Investing & Trading Score: 28 | |
| Day Percent Change: -0.29% Day Change: 0.00 | |
| Week Change: 0.29% Year-to-date Change: -27.0% | |
| CPSH Links: Profile News Message Board | |
| Charts:- Daily , Weekly | |
| Add CPSH to Watchlist: View: Get Complete CPSH Trend Analysis ➞ | |
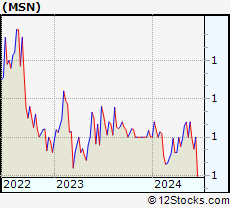 | MSN Emerson Radio Corp. |
| Sector: Technology | |
| SubSector: Electronic Equipment | |
| MarketCap: 15.07 Millions | |
| Recent Price: 0.54 Smart Investing & Trading Score: 32 | |
| Day Percent Change: 1.17% Day Change: 0.01 | |
| Week Change: 0.28% Year-to-date Change: -2.7% | |
| MSN Links: Profile News Message Board | |
| Charts:- Daily , Weekly | |
| Add MSN to Watchlist: View: Get Complete MSN Trend Analysis ➞ | |
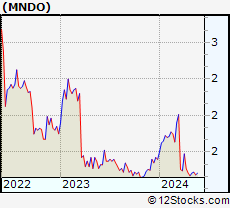 | MNDO MIND C.T.I. Ltd |
| Sector: Technology | |
| SubSector: Information Technology Services | |
| MarketCap: 39.5468 Millions | |
| Recent Price: 1.87 Smart Investing & Trading Score: 40 | |
| Day Percent Change: 0.27% Day Change: 0.00 | |
| Week Change: 0.27% Year-to-date Change: -4.9% | |
| MNDO Links: Profile News Message Board | |
| Charts:- Daily , Weekly | |
| Add MNDO to Watchlist: View: Get Complete MNDO Trend Analysis ➞ | |
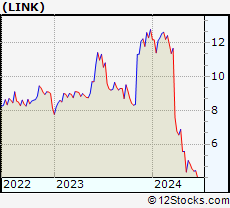 | LINK Interlink Electronics, Inc. |
| Sector: Technology | |
| SubSector: Diversified Electronics | |
| MarketCap: 22.3396 Millions | |
| Recent Price: 4.41 Smart Investing & Trading Score: 35 | |
| Day Percent Change: 6.59% Day Change: 0.27 | |
| Week Change: 0.07% Year-to-date Change: -65.5% | |
| LINK Links: Profile News Message Board | |
| Charts:- Daily , Weekly | |
| Add LINK to Watchlist: View: Get Complete LINK Trend Analysis ➞ | |
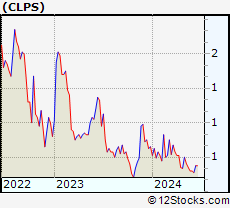 | CLPS CLPS Incorporation |
| Sector: Technology | |
| SubSector: Information Technology Services | |
| MarketCap: 23.7468 Millions | |
| Recent Price: 0.91 Smart Investing & Trading Score: 17 | |
| Day Percent Change: 2.25% Day Change: 0.02 | |
| Week Change: 0% Year-to-date Change: -14.2% | |
| CLPS Links: Profile News Message Board | |
| Charts:- Daily , Weekly | |
| Add CLPS to Watchlist: View: Get Complete CLPS Trend Analysis ➞ | |
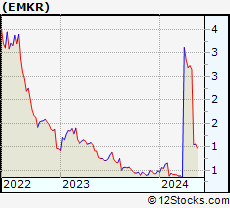 | EMKR EMCORE Corporation |
| Sector: Technology | |
| SubSector: Semiconductor - Integrated Circuits | |
| MarketCap: 44.951 Millions | |
| Recent Price: 0.89 Smart Investing & Trading Score: 51 | |
| Day Percent Change: 9.48% Day Change: 0.08 | |
| Week Change: -0.02% Year-to-date Change: 82.5% | |
| EMKR Links: Profile News Message Board | |
| Charts:- Daily , Weekly | |
| Add EMKR to Watchlist: View: Get Complete EMKR Trend Analysis ➞ | |
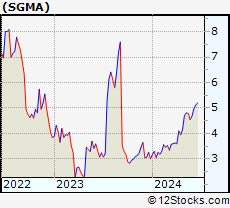 | SGMA SigmaTron International, Inc. |
| Sector: Technology | |
| SubSector: Printed Circuit Boards | |
| MarketCap: 10.6235 Millions | |
| Recent Price: 4.96 Smart Investing & Trading Score: 66 | |
| Day Percent Change: -2.46% Day Change: -0.13 | |
| Week Change: -0.1% Year-to-date Change: 65.0% | |
| SGMA Links: Profile News Message Board | |
| Charts:- Daily , Weekly | |
| Add SGMA to Watchlist: View: Get Complete SGMA Trend Analysis ➞ | |
| For tabular summary view of above stock list: Summary View ➞ 0 - 25 , 25 - 50 , 50 - 75 , 75 - 100 | ||
| Click To Change The Sort Order: By Market Cap or Company Size Performance: Year-to-date, Week and Day | |
| Select Chart Type: | ||
|
Best Stocks Today 12Stocks.com |
© 2024 12Stocks.com Terms & Conditions Privacy Contact Us
All Information Provided Only For Education And Not To Be Used For Investing or Trading. See Terms & Conditions


One More Thing ... Get Best Stocks Delivered Daily!
Never Ever Miss A Move With Our Top Ten Stocks Lists
Find Best Stocks In Any Market - Bull or Bear Market
Take A Peek At Our Top Ten Stocks Lists: Daily, Weekly, Year-to-Date & Top Trends
Find Best Stocks In Any Market - Bull or Bear Market
Take A Peek At Our Top Ten Stocks Lists: Daily, Weekly, Year-to-Date & Top Trends
Technology Stocks With Best Up Trends [0-bearish to 100-bullish]: MediaCo Holding[100], Oracle [100], Karooooo [100], Bitdeer [100], Red Violet[100], Cango [100], Navitas Semiconductor[100], Axcelis [100], Cellebrite DI[100], MKS [100], Amkor [100]
Best Technology Stocks Year-to-Date:
MediaCo Holding[411.74%], MicroCloud Hologram[300%], Uxin [216.69%], Super Micro[172.55%], Smith Micro[168.77%], MicroStrategy [153.9%], Cheetah Mobile[135.09%], CuriosityStream [122.18%], SoundHound AI[117.52%], Zeta Global[96.94%], Phoenix New[94.85%] Best Technology Stocks This Week:
MediaCo Holding[105.66%], Kaltura [46.19%], Karooooo [24.29%], Affirm [18.84%], CuriosityStream [18.81%], Cellebrite DI[18.45%], Nerdy [18.37%], on [15.37%], DXC [14.26%], Zillow [13.79%], Altair Engineering[13.7%] Best Technology Stocks Daily:
MediaCo Holding[37.11%], Oracle [13.32%], Zillow [13.31%], Zillow [12.75%], Karooooo [12.64%], Tucows [10.19%], Amesite [9.33%], Compass [8.24%], Bitdeer [8.02%], Confluent [8.00%], FiscalNote [7.76%]