
 Login Sign Up


| |||||
 |  | ||||

| 12Stocks.com Market Intelligence |
Best Tech Stocks
| In a hurry? Tech Stocks Lists: Performance & Trends, Stock Charts, FANG Stocks
Sort Tech stocks: Daily, Weekly, Year-to-Date, Market Cap & Trends. Filter Tech stocks list by size:All Tech Large Mid-Range Small and MicroCap |
| 12Stocks.com Tech Stocks Performances & Trends Daily | |||||||||
|
|  The overall Smart Investing & Trading Score is 100 (0-bearish to 100-bullish) which puts Technology sector in short term bullish trend. The Smart Investing & Trading Score from previous trading session is 80 and an improvement of trend continues.
| ||||||||
Here are the Smart Investing & Trading Scores of the most requested Technology stocks at 12Stocks.com (click stock name for detailed review):
|


| 12Stocks.com: Investing in Technology sector with Stocks | |
|
The following table helps investors and traders sort through current performance and trends (as measured by Smart Investing & Trading Score) of various
stocks in the Tech sector. Quick View: Move mouse or cursor over stock symbol (ticker) to view short-term technical chart and over stock name to view long term chart. Click on  to add stock symbol to your watchlist and to add stock symbol to your watchlist and  to view watchlist. Click on any ticker or stock name for detailed market intelligence report for that stock. to view watchlist. Click on any ticker or stock name for detailed market intelligence report for that stock. |
12Stocks.com Performance of Stocks in Tech Sector
| Ticker | Stock Name | Watchlist | Category | Recent Price | Smart Investing & Trading Score | Change % | Weekly Change% |
| GSIT | GSI |   | Semiconductor | 2.64 | 42 | -1.49% | 3.94% |
| NET | Cloudflare | | Software | 73.51 | 37 | -2.53% | 3.93% |
| CSIQ | Canadian Solar | | Semiconductor | 18.07 | 43 | -1.63% | 3.91% |
| DELL | Dell | | Personal Computers | 135.02 | 63 | 2.44% | 3.89% |
| MANH | Manhattan Associates | | Software | 229.14 | 57 | -0.83% | 3.89% |
| LITE | Lumentum | | Communication | 47.55 | 80 | 1.36% | 3.84% |
| ON | ON Semiconductor | | Semiconductor | 75.04 | 93 | -1.55% | 3.78% |
| GTLB | GitLab | | Software - | 45.23 | 35 | -2.37% | 3.76% |
| ASUR | Asure Software | | Software | 7.98 | 81 | -0.75% | 3.64% |
| GDS | GDS | | Data Storage | 9.14 | 95 | 1.90% | 3.63% |
| TDC | Teradata | | IT | 33.48 | 52 | -0.68% | 3.62% |
| INTU | Intuit | | Software | 594.62 | 49 | 0.41% | 3.61% |
| TSEM | Tower Semiconductor | | Semiconductor | 38.64 | 71 | -0.80% | 3.59% |
| FENG | Phoenix New | | Internet | 2.65 | 78 | 0.06% | 3.58% |
| MINDP | Mitcham Industries | | Instruments | 14.75 | 63 | 0.00% | 3.51% |
| TEO | Telecom Argentina | | Communication | 7.42 | 32 | 5.10% | 3.49% |
| SRAD | Sportradar | | Software - | 11.08 | 62 | 0.00% | 3.45% |
| AEIS | Advanced Energy | | Electronics | 108.97 | 86 | -0.57% | 3.40% |
| SPNS | Sapiens | | Software | 33.96 | 71 | 0.03% | 3.38% |
| ICG | Intchains | | Semiconductors | 6.77 | 25 | -2.73% | 3.36% |
| MTSI | MACOM | | Semiconductor | 104.79 | 88 | -0.45% | 3.34% |
| INFA | Informatica | | Software - Infrastructure | 29.56 | 49 | -1.00% | 3.32% |
| AYI | Acuity Brands | | Electronics | 259.23 | 25 | 0.88% | 3.27% |
| ADSK | Autodesk | | Software | 223.10 | 64 | 0.04% | 3.26% |
| DIOD | Diodes | | Semiconductor | 73.81 | 74 | -1.73% | 3.22% |
| For chart view version of above stock list: Chart View ➞ 0 - 25 , 25 - 50 , 50 - 75 , 75 - 100 , 100 - 125 , 125 - 150 , 150 - 175 , 175 - 200 , 200 - 225 , 225 - 250 , 250 - 275 , 275 - 300 , 300 - 325 , 325 - 350 , 350 - 375 , 375 - 400 , 400 - 425 , 425 - 450 , 450 - 475 , 475 - 500 , 500 - 525 , 525 - 550 , 550 - 575 , 575 - 600 , 600 - 625 , 625 - 650 | ||
 | Click To Change The Sort Order: By Market Cap or Company Size Performance: Year-to-date, Week and Day |  |
|
Get the most comprehensive stock market coverage daily at 12Stocks.com ➞ Best Stocks Today ➞ Best Stocks Weekly ➞ Best Stocks Year-to-Date ➞ Best Stocks Trends ➞  Best Stocks Today 12Stocks.com Best Nasdaq Stocks ➞ Best S&P 500 Stocks ➞ Best Tech Stocks ➞ Best Biotech Stocks ➞ |
| Detailed Overview of Tech Stocks |
| Tech Technical Overview, Leaders & Laggards, Top Tech ETF Funds & Detailed Tech Stocks List, Charts, Trends & More |
| Tech Sector: Technical Analysis, Trends & YTD Performance | |
| Technology sector is composed of stocks
from semiconductors, software, web, social media
and services subsectors. Technology sector, as represented by XLK, an exchange-traded fund [ETF] that holds basket of tech stocks (e.g, Intel, Google) is up by 17.84% and is currently outperforming the overall market by 5.33% year-to-date. Below is a quick view of technical charts and trends: |
|
 XLK Weekly Chart |
|
| Long Term Trend: Very Good | |
| Medium Term Trend: Very Good | |
 XLK Daily Chart |
|
| Short Term Trend: Very Good | |
| Overall Trend Score: 100 | |
| YTD Performance: 17.84% | |
| **Trend Scores & Views Are Only For Educational Purposes And Not For Investing | |
| 12Stocks.com: Top Performing Technology Sector Stocks | ||||||||||||||||||||||||||||||||||||||||||||||||
 The top performing Technology sector stocks year to date are
Now, more recently, over last week, the top performing Technology sector stocks on the move are


|
||||||||||||||||||||||||||||||||||||||||||||||||
| 12Stocks.com: Investing in Tech Sector using Exchange Traded Funds | |
|
The following table shows list of key exchange traded funds (ETF) that
help investors track Tech Index. For detailed view, check out our ETF Funds section of our website. Quick View: Move mouse or cursor over ETF symbol (ticker) to view short-term technical chart and over ETF name to view long term chart. Click on ticker or stock name for detailed view. Click on to add stock symbol to your watchlist and to view watchlist. |
12Stocks.com List of ETFs that track Tech Index
| Ticker | ETF Name | Watchlist | Recent Price | Smart Investing & Trading Score | Change % | Week % | Year-to-date % |
| XLK | Technology | | 226.82 | 100 | 0.79 | 5.2 | 17.84% |
| QQQ | QQQ | | 476.72 | 100 | 0.54 | 3 | 16.41% |
| IYW | Technology | | 150.24 | 80 | 0.66 | 4.89 | 22.4% |
| VGT | Information Technology | | 577.17 | 80 | 0.99 | 5.39 | 19.25% |
| IXN | Global Tech | | 83.06 | 95 | 0.69 | 4.91 | 21.82% |
| IGV | Tech-Software | | 81.85 | 30 | -1.05 | 2 | 0.89% |
| XSD | Semiconductor | | 255.50 | 73 | -0.26 | 4.55 | 13.66% |
| TQQQ | QQQ | | 73.11 | 100 | 1.57 | 8.92 | 44.2% |
| SQQQ | Short QQQ | | 8.54 | 0 | -1.61 | -8.37 | -36.51% |
| SOXL | Semicondct Bull 3X | | 60.86 | 100 | 3.64 | 17.33 | 93.82% |
| SOXS | Semicondct Bear 3X | | 21.31 | 26 | -3.57 | -16.07 | 266.15% |
| SOXX | PHLX Semiconductor | | 252.95 | 80 | 1.09 | 5.59 | 31.72% |
| QTEC | First -100-Tech | | 195.65 | 68 | -0.24 | 3.24 | 11.5% |
| SMH | Semiconductor | | 267.21 | 100 | 1.57 | 5.95 | 52.8% |
| 12Stocks.com: Charts, Trends, Fundamental Data and Performances of Tech Stocks | |
|
We now take in-depth look at all Tech stocks including charts, multi-period performances and overall trends (as measured by Smart Investing & Trading Score). One can sort Tech stocks (click link to choose) by Daily, Weekly and by Year-to-Date performances. Also, one can sort by size of the company or by market capitalization. |
| Select Your Default Chart Type: | |||||
| |||||
| Click on stock symbol or name for detailed view. Click on to add stock symbol to your watchlist and to view watchlist. Quick View: Move mouse or cursor over "Daily" to quickly view daily technical stock chart and over "Weekly" to view weekly technical stock chart. | |||||


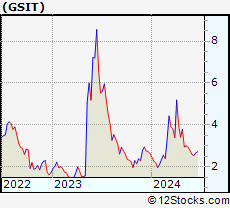 | GSIT GSI Technology, Inc. |
| Sector: Technology | |
| SubSector: Semiconductor - Broad Line | |
| MarketCap: 142.242 Millions | |
| Recent Price: 2.64 Smart Investing & Trading Score: 42 | |
| Day Percent Change: -1.49% Day Change: -0.04 | |
| Week Change: 3.94% Year-to-date Change: 0.0% | |
| GSIT Links: Profile News Message Board | |
| Charts:- Daily , Weekly | |
| Add GSIT to Watchlist: View: Get Complete GSIT Trend Analysis ➞ | |
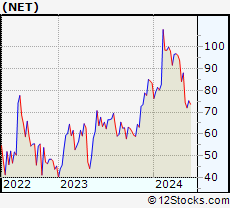 | NET Cloudflare, Inc. |
| Sector: Technology | |
| SubSector: Application Software | |
| MarketCap: 7063.72 Millions | |
| Recent Price: 73.51 Smart Investing & Trading Score: 37 | |
| Day Percent Change: -2.53% Day Change: -1.91 | |
| Week Change: 3.93% Year-to-date Change: -11.7% | |
| NET Links: Profile News Message Board | |
| Charts:- Daily , Weekly | |
| Add NET to Watchlist: View: Get Complete NET Trend Analysis ➞ | |
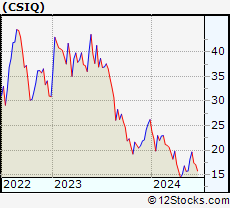 | CSIQ Canadian Solar Inc. |
| Sector: Technology | |
| SubSector: Semiconductor - Specialized | |
| MarketCap: 957.96 Millions | |
| Recent Price: 18.07 Smart Investing & Trading Score: 43 | |
| Day Percent Change: -1.63% Day Change: -0.30 | |
| Week Change: 3.91% Year-to-date Change: -31.1% | |
| CSIQ Links: Profile News Message Board | |
| Charts:- Daily , Weekly | |
| Add CSIQ to Watchlist: View: Get Complete CSIQ Trend Analysis ➞ | |
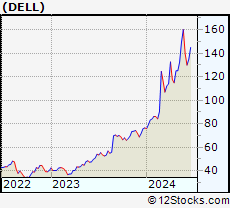 | DELL Dell Technologies Inc. |
| Sector: Technology | |
| SubSector: Personal Computers | |
| MarketCap: 26750.6 Millions | |
| Recent Price: 135.02 Smart Investing & Trading Score: 63 | |
| Day Percent Change: 2.44% Day Change: 3.21 | |
| Week Change: 3.89% Year-to-date Change: 76.5% | |
| DELL Links: Profile News Message Board | |
| Charts:- Daily , Weekly | |
| Add DELL to Watchlist: View: Get Complete DELL Trend Analysis ➞ | |
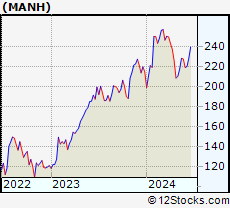 | MANH Manhattan Associates, Inc. |
| Sector: Technology | |
| SubSector: Application Software | |
| MarketCap: 3487.02 Millions | |
| Recent Price: 229.14 Smart Investing & Trading Score: 57 | |
| Day Percent Change: -0.83% Day Change: -1.91 | |
| Week Change: 3.89% Year-to-date Change: 6.4% | |
| MANH Links: Profile News Message Board | |
| Charts:- Daily , Weekly | |
| Add MANH to Watchlist: View: Get Complete MANH Trend Analysis ➞ | |
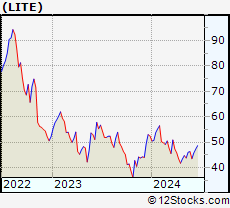 | LITE Lumentum Holdings Inc. |
| Sector: Technology | |
| SubSector: Communication Equipment | |
| MarketCap: 4990.49 Millions | |
| Recent Price: 47.55 Smart Investing & Trading Score: 80 | |
| Day Percent Change: 1.36% Day Change: 0.64 | |
| Week Change: 3.84% Year-to-date Change: -9.3% | |
| LITE Links: Profile News Message Board | |
| Charts:- Daily , Weekly | |
| Add LITE to Watchlist: View: Get Complete LITE Trend Analysis ➞ | |
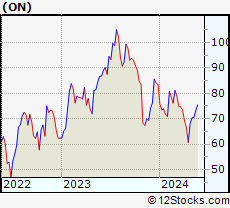 | ON ON Semiconductor Corporation |
| Sector: Technology | |
| SubSector: Semiconductor - Broad Line | |
| MarketCap: 5183.82 Millions | |
| Recent Price: 75.04 Smart Investing & Trading Score: 93 | |
| Day Percent Change: -1.55% Day Change: -1.18 | |
| Week Change: 3.78% Year-to-date Change: -10.2% | |
| ON Links: Profile News Message Board | |
| Charts:- Daily , Weekly | |
| Add ON to Watchlist: View: Get Complete ON Trend Analysis ➞ | |
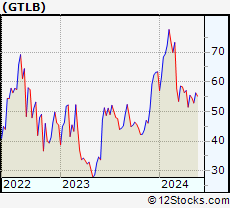 | GTLB GitLab Inc. |
| Sector: Technology | |
| SubSector: Software - Application | |
| MarketCap: 7840 Millions | |
| Recent Price: 45.23 Smart Investing & Trading Score: 35 | |
| Day Percent Change: -2.37% Day Change: -1.10 | |
| Week Change: 3.76% Year-to-date Change: -28.6% | |
| GTLB Links: Profile News Message Board | |
| Charts:- Daily , Weekly | |
| Add GTLB to Watchlist: View: Get Complete GTLB Trend Analysis ➞ | |
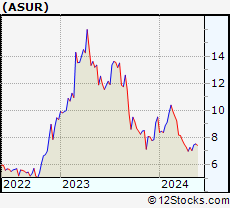 | ASUR Asure Software, Inc. |
| Sector: Technology | |
| SubSector: Business Software & Services | |
| MarketCap: 103.758 Millions | |
| Recent Price: 7.98 Smart Investing & Trading Score: 81 | |
| Day Percent Change: -0.75% Day Change: -0.06 | |
| Week Change: 3.64% Year-to-date Change: -16.2% | |
| ASUR Links: Profile News Message Board | |
| Charts:- Daily , Weekly | |
| Add ASUR to Watchlist: View: Get Complete ASUR Trend Analysis ➞ | |
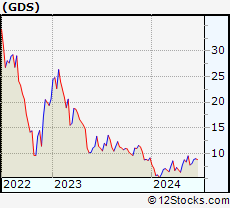 | GDS GDS Holdings Limited |
| Sector: Technology | |
| SubSector: Data Storage Devices | |
| MarketCap: 8597.99 Millions | |
| Recent Price: 9.14 Smart Investing & Trading Score: 95 | |
| Day Percent Change: 1.90% Day Change: 0.17 | |
| Week Change: 3.63% Year-to-date Change: 0.2% | |
| GDS Links: Profile News Message Board | |
| Charts:- Daily , Weekly | |
| Add GDS to Watchlist: View: Get Complete GDS Trend Analysis ➞ | |
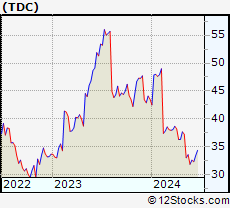 | TDC Teradata Corporation |
| Sector: Technology | |
| SubSector: Information Technology Services | |
| MarketCap: 2229.48 Millions | |
| Recent Price: 33.48 Smart Investing & Trading Score: 52 | |
| Day Percent Change: -0.68% Day Change: -0.23 | |
| Week Change: 3.62% Year-to-date Change: -23.1% | |
| TDC Links: Profile News Message Board | |
| Charts:- Daily , Weekly | |
| Add TDC to Watchlist: View: Get Complete TDC Trend Analysis ➞ | |
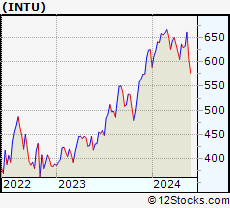 | INTU Intuit Inc. |
| Sector: Technology | |
| SubSector: Application Software | |
| MarketCap: 577035 Millions | |
| Recent Price: 594.62 Smart Investing & Trading Score: 49 | |
| Day Percent Change: 0.41% Day Change: 2.40 | |
| Week Change: 3.61% Year-to-date Change: -4.9% | |
| INTU Links: Profile News Message Board | |
| Charts:- Daily , Weekly | |
| Add INTU to Watchlist: View: Get Complete INTU Trend Analysis ➞ | |
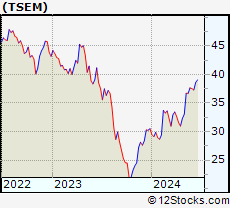 | TSEM Tower Semiconductor Ltd. |
| Sector: Technology | |
| SubSector: Semiconductor - Integrated Circuits | |
| MarketCap: 1745.1 Millions | |
| Recent Price: 38.64 Smart Investing & Trading Score: 71 | |
| Day Percent Change: -0.80% Day Change: -0.31 | |
| Week Change: 3.59% Year-to-date Change: 26.6% | |
| TSEM Links: Profile News Message Board | |
| Charts:- Daily , Weekly | |
| Add TSEM to Watchlist: View: Get Complete TSEM Trend Analysis ➞ | |
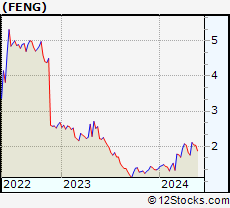 | FENG Phoenix New Media Limited |
| Sector: Technology | |
| SubSector: Internet Information Providers | |
| MarketCap: 107.08 Millions | |
| Recent Price: 2.65 Smart Investing & Trading Score: 78 | |
| Day Percent Change: 0.06% Day Change: 0.00 | |
| Week Change: 3.58% Year-to-date Change: 95.0% | |
| FENG Links: Profile News Message Board | |
| Charts:- Daily , Weekly | |
| Add FENG to Watchlist: View: Get Complete FENG Trend Analysis ➞ | |
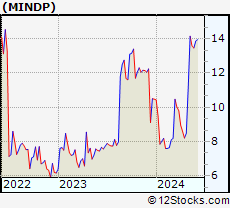 | MINDP Mitcham Industries, Inc. |
| Sector: Technology | |
| SubSector: Scientific & Technical Instruments | |
| MarketCap: 152.453 Millions | |
| Recent Price: 14.75 Smart Investing & Trading Score: 63 | |
| Day Percent Change: 0.00% Day Change: 0.00 | |
| Week Change: 3.51% Year-to-date Change: 40.7% | |
| MINDP Links: Profile News Message Board | |
| Charts:- Daily , Weekly | |
| Add MINDP to Watchlist: View: Get Complete MINDP Trend Analysis ➞ | |
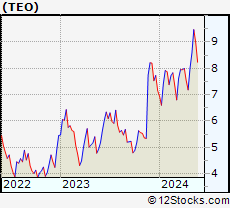 | TEO Telecom Argentina S.A. |
| Sector: Technology | |
| SubSector: Diversified Communication Services | |
| MarketCap: 1508.64 Millions | |
| Recent Price: 7.42 Smart Investing & Trading Score: 32 | |
| Day Percent Change: 5.10% Day Change: 0.36 | |
| Week Change: 3.49% Year-to-date Change: 3.8% | |
| TEO Links: Profile News Message Board | |
| Charts:- Daily , Weekly | |
| Add TEO to Watchlist: View: Get Complete TEO Trend Analysis ➞ | |
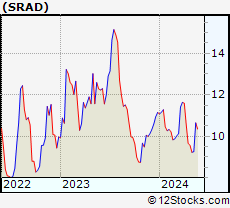 | SRAD Sportradar Group AG |
| Sector: Technology | |
| SubSector: Software - Application | |
| MarketCap: 3900 Millions | |
| Recent Price: 11.08 Smart Investing & Trading Score: 62 | |
| Day Percent Change: 0.00% Day Change: 0.00 | |
| Week Change: 3.45% Year-to-date Change: -0.6% | |
| SRAD Links: Profile News Message Board | |
| Charts:- Daily , Weekly | |
| Add SRAD to Watchlist: View: Get Complete SRAD Trend Analysis ➞ | |
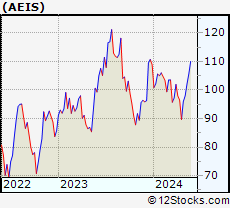 | AEIS Advanced Energy Industries, Inc. |
| Sector: Technology | |
| SubSector: Diversified Electronics | |
| MarketCap: 1641.86 Millions | |
| Recent Price: 108.97 Smart Investing & Trading Score: 86 | |
| Day Percent Change: -0.57% Day Change: -0.63 | |
| Week Change: 3.4% Year-to-date Change: 0.1% | |
| AEIS Links: Profile News Message Board | |
| Charts:- Daily , Weekly | |
| Add AEIS to Watchlist: View: Get Complete AEIS Trend Analysis ➞ | |
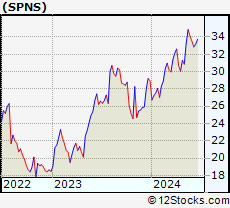 | SPNS Sapiens International Corporation N.V. |
| Sector: Technology | |
| SubSector: Business Software & Services | |
| MarketCap: 841.858 Millions | |
| Recent Price: 33.96 Smart Investing & Trading Score: 71 | |
| Day Percent Change: 0.03% Day Change: 0.01 | |
| Week Change: 3.38% Year-to-date Change: 17.4% | |
| SPNS Links: Profile News Message Board | |
| Charts:- Daily , Weekly | |
| Add SPNS to Watchlist: View: Get Complete SPNS Trend Analysis ➞ | |
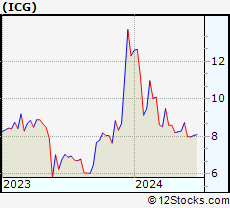 | ICG Intchains Group Limited |
| Sector: Technology | |
| SubSector: Semiconductors | |
| MarketCap: 450 Millions | |
| Recent Price: 6.77 Smart Investing & Trading Score: 25 | |
| Day Percent Change: -2.73% Day Change: -0.19 | |
| Week Change: 3.36% Year-to-date Change: -45.0% | |
| ICG Links: Profile News Message Board | |
| Charts:- Daily , Weekly | |
| Add ICG to Watchlist: View: Get Complete ICG Trend Analysis ➞ | |
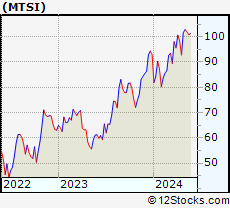 | MTSI MACOM Technology Solutions Holdings, Inc. |
| Sector: Technology | |
| SubSector: Semiconductor - Broad Line | |
| MarketCap: 1214.42 Millions | |
| Recent Price: 104.79 Smart Investing & Trading Score: 88 | |
| Day Percent Change: -0.45% Day Change: -0.47 | |
| Week Change: 3.34% Year-to-date Change: 12.7% | |
| MTSI Links: Profile News Message Board | |
| Charts:- Daily , Weekly | |
| Add MTSI to Watchlist: View: Get Complete MTSI Trend Analysis ➞ | |
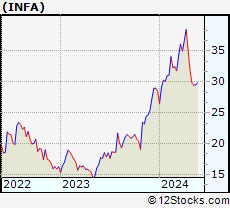 | INFA Informatica Inc. |
| Sector: Technology | |
| SubSector: Software - Infrastructure | |
| MarketCap: 5340 Millions | |
| Recent Price: 29.56 Smart Investing & Trading Score: 49 | |
| Day Percent Change: -1.00% Day Change: -0.30 | |
| Week Change: 3.32% Year-to-date Change: 4.0% | |
| INFA Links: Profile News Message Board | |
| Charts:- Daily , Weekly | |
| Add INFA to Watchlist: View: Get Complete INFA Trend Analysis ➞ | |
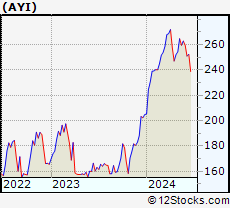 | AYI Acuity Brands, Inc. |
| Sector: Technology | |
| SubSector: Diversified Electronics | |
| MarketCap: 3356.66 Millions | |
| Recent Price: 259.23 Smart Investing & Trading Score: 25 | |
| Day Percent Change: 0.88% Day Change: 2.26 | |
| Week Change: 3.27% Year-to-date Change: 26.6% | |
| AYI Links: Profile News Message Board | |
| Charts:- Daily , Weekly | |
| Add AYI to Watchlist: View: Get Complete AYI Trend Analysis ➞ | |
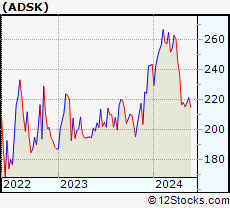 | ADSK Autodesk, Inc. |
| Sector: Technology | |
| SubSector: Technical & System Software | |
| MarketCap: 36975.8 Millions | |
| Recent Price: 223.10 Smart Investing & Trading Score: 64 | |
| Day Percent Change: 0.04% Day Change: 0.08 | |
| Week Change: 3.26% Year-to-date Change: -8.4% | |
| ADSK Links: Profile News Message Board | |
| Charts:- Daily , Weekly | |
| Add ADSK to Watchlist: View: Get Complete ADSK Trend Analysis ➞ | |
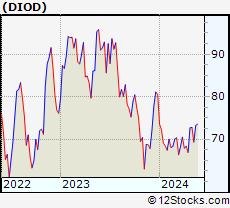 | DIOD Diodes Incorporated |
| Sector: Technology | |
| SubSector: Semiconductor - Integrated Circuits | |
| MarketCap: 1967.6 Millions | |
| Recent Price: 73.81 Smart Investing & Trading Score: 74 | |
| Day Percent Change: -1.73% Day Change: -1.30 | |
| Week Change: 3.22% Year-to-date Change: -8.3% | |
| DIOD Links: Profile News Message Board | |
| Charts:- Daily , Weekly | |
| Add DIOD to Watchlist: View: Get Complete DIOD Trend Analysis ➞ | |
| For tabular summary view of above stock list: Summary View ➞ 0 - 25 , 25 - 50 , 50 - 75 , 75 - 100 , 100 - 125 , 125 - 150 , 150 - 175 , 175 - 200 , 200 - 225 , 225 - 250 , 250 - 275 , 275 - 300 , 300 - 325 , 325 - 350 , 350 - 375 , 375 - 400 , 400 - 425 , 425 - 450 , 450 - 475 , 475 - 500 , 500 - 525 , 525 - 550 , 550 - 575 , 575 - 600 , 600 - 625 , 625 - 650 | ||
| Click To Change The Sort Order: By Market Cap or Company Size Performance: Year-to-date, Week and Day | |
| Select Chart Type: | ||
|
Best Stocks Today 12Stocks.com |
© 2024 12Stocks.com Terms & Conditions Privacy Contact Us
All Information Provided Only For Education And Not To Be Used For Investing or Trading. See Terms & Conditions


One More Thing ... Get Best Stocks Delivered Daily!
Never Ever Miss A Move With Our Top Ten Stocks Lists
Find Best Stocks In Any Market - Bull or Bear Market
Take A Peek At Our Top Ten Stocks Lists: Daily, Weekly, Year-to-Date & Top Trends
Find Best Stocks In Any Market - Bull or Bear Market
Take A Peek At Our Top Ten Stocks Lists: Daily, Weekly, Year-to-Date & Top Trends
Technology Stocks With Best Up Trends [0-bearish to 100-bullish]: Bitdeer [100], Broadcom [100], Viomi [100], Orion Energy[100], MediaCo Holding[100], Arista Networks[100], Rackspace [100], Axcelis [100], Pure Storage[100], Seagate [100], Veeco [100]
Best Technology Stocks Year-to-Date:
MediaCo Holding[451.64%], MicroCloud Hologram[302.88%], Uxin [224.54%], Super Micro[206.44%], Smith Micro[167.55%], MicroStrategy [134.93%], Cheetah Mobile[130.26%], SoundHound AI[115.42%], CuriosityStream [112.92%], Phoenix New[94.98%], Pure Storage[91.53%] Best Technology Stocks This Week:
MediaCo Holding[121.7%], Kaltura [44.96%], Bitdeer [34.93%], Nerdy [27.21%], Karooooo [23.02%], Broadcom [19.36%], Skyworks [17.09%], Cellebrite DI[15.89%], FiscalNote [14.04%], Qorvo [13.94%], CuriosityStream [13.86%] Best Technology Stocks Daily:
Bitdeer [20.93%], Super Micro[12.44%], Broadcom [12.27%], Viomi [9.48%], Qudian [9.15%], Orion Energy[8.49%], Comtech Tele[8.02%], MediaCo Holding[7.80%], Bilibili [7.71%], Nerdy [7.47%], Aerohive Networks[6.71%]