
 Login Sign Up


| |||||
 |  | ||||

| 12Stocks.com Market Intelligence |
Best S&P 500 Stocks
|
On this page, you will find the most comprehensive analysis of S&P 500 stocks and ETFs - from latest trends to performances to charts ➞. First, here are the year-to-date (YTD) performances of the most requested S&P 500 stocks at 12Stocks.com (click stock for review):
| NVIDIA 121% | ||
| Walmart 25% | ||
| Google 23% | ||
| JPMorgan Chase 19% | ||
| Goldman Sachs 18% | ||
| Amazon.com 16% | ||
| Merck 15% | ||
| Caterpillar 14% | ||
| Microsoft 10% | ||
| Chevron 9% | ||
| Apple -0% | ||
| Johnson & Johnson -6% | ||
| McDonald s -13% | ||
| Starbucks -16% | ||
| Gilead -21% | ||
| Boeing -32% | ||
| Intel -39% | ||
| Quick: S&P 500 Stocks Lists: Performances & Trends, S&P 500 Stock Charts
Sort S&P 500 stocks: Daily, Weekly, Year-to-Date, Market Cap & Trends. Filter S&P 500 stocks list by sector: Show all, Tech, Finance, Energy, Staples, Retail, Industrial, Materials, Utilities and HealthCare |
| 12Stocks.com S&P 500 Stocks Performances & Trends Daily Report | |||||||||
|
| 
The overall Smart Investing & Trading Score is 76 (0-bearish to 100-bullish) which puts S&P 500 index in short term neutral to bullish trend. The Smart Investing & Trading Score from previous trading session is 56 and hence an improvement of trend. | ||||||||
Here are the Smart Investing & Trading Scores of the most requested S&P 500 stocks at 12Stocks.com (click stock name for detailed review):
|


| 12Stocks.com: Top Performing S&P 500 Index Stocks | ||||||||||||||||||||||||||||||||||||||||||||||||
 The top performing S&P 500 Index stocks year to date are
Now, more recently, over last week, the top performing S&P 500 Index stocks on the move are


|
||||||||||||||||||||||||||||||||||||||||||||||||
| 12Stocks.com: Investing in S&P 500 Index with Stocks | |
|
The following table helps investors and traders sort through current performance and trends (as measured by Smart Investing & Trading Score) of various
stocks in the S&P 500 Index. Quick View: Move mouse or cursor over stock symbol (ticker) to view short-term technical chart and over stock name to view long term chart. Click on  to add stock symbol to your watchlist and to add stock symbol to your watchlist and  to view watchlist. Click on any ticker or stock name for detailed market intelligence report for that stock. to view watchlist. Click on any ticker or stock name for detailed market intelligence report for that stock. |
12Stocks.com Performance of Stocks in S&P 500 Index
| Ticker | Stock Name | Watchlist | Category | Recent Price | Smart Investing & Trading Score | Change % | Weekly Change% |
| PHM | Pulte |   | Industrials | 117.32 | 58 | 1.34% | 2.64% |
| FOX | Twenty-First Century | | Services & Goods | 31.94 | 100 | 0.73% | 2.60% |
| FDX | FedEx | | Transports | 253.96 | 58 | 1.75% | 2.57% |
| LEN | Lennar | | Industrials | 160.35 | 58 | 2.11% | 2.54% |
| HUM | Humana | | Health Care | 358.12 | 100 | 3.09% | 2.53% |
| AFL | Aflac | | Financials | 89.87 | 100 | 2.15% | 2.49% |
| EXPD | Expeditors | | Transports | 120.90 | 100 | 0.57% | 2.49% |
| TAP | Molson Coors | | Consumer Staples | 54.81 | 32 | 2.99% | 2.45% |
| CMS | CMS | | Utilities | 62.93 | 76 | 2.61% | 2.44% |
| UAL | United Airlines | | Transports | 52.99 | 76 | 3.21% | 2.44% |
| FOXA | Fox | | Services & Goods | 34.43 | 100 | 0.47% | 2.44% |
| EXC | Exelon | | Utilities | 37.55 | 68 | 2.23% | 2.34% |
| EQT | EQT | | Energy | 41.09 | 88 | -0.27% | 2.34% |
| FCX | Freeport-McMoRan | | Materials | 52.73 | 68 | 0.80% | 2.33% |
| SPG | Simon Property | | Financials | 151.31 | 90 | 1.93% | 2.32% |
| EXPE | Expedia | | Services & Goods | 112.86 | 42 | 3.09% | 2.31% |
| AMCR | Amcor | | Consumer Staples | 10.17 | 73 | 2.94% | 2.31% |
| EVRG | Evergy | | Utilities | 54.66 | 68 | 2.57% | 2.30% |
| CB | Chubb | | Financials | 270.82 | 93 | 2.14% | 2.29% |
| BXP | Boston Properties | | Financials | 60.67 | 32 | 4.26% | 2.29% |
| PPL | PPL | | Utilities | 29.33 | 83 | 2.70% | 2.27% |
| DLTR | Dollar Tree | | Services & Goods | 117.95 | 49 | 2.75% | 2.24% |
| KMI | Kinder Morgan | | Energy | 19.49 | 83 | 2.58% | 2.20% |
| DHI | D.R. Horton | | Industrials | 147.80 | 32 | 1.59% | 2.20% |
| WRB | W. R. | | Financials | 81.03 | 64 | 1.92% | 2.19% |
| For chart view version of above stock list: Chart View ➞ 0 - 25 , 25 - 50 , 50 - 75 , 75 - 100 , 100 - 125 , 125 - 150 , 150 - 175 , 175 - 200 , 200 - 225 , 225 - 250 , 250 - 275 , 275 - 300 , 300 - 325 , 325 - 350 , 350 - 375 , 375 - 400 , 400 - 425 , 425 - 450 , 450 - 475 , 475 - 500 | ||
 | Click To Change The Sort Order: By Market Cap or Company Size Performance: Year-to-date, Week and Day |  |
|
Get the most comprehensive stock market coverage daily at 12Stocks.com ➞ Best Stocks Today ➞ Best Stocks Weekly ➞ Best Stocks Year-to-Date ➞ Best Stocks Trends ➞  Best Stocks Today 12Stocks.com Best Nasdaq Stocks ➞ Best S&P 500 Stocks ➞ Best Tech Stocks ➞ Best Biotech Stocks ➞ |
| Detailed Overview of S&P 500 Stocks |
| S&P 500 Technical Overview, Leaders & Laggards, Top S&P 500 ETF Funds & Detailed S&P 500 Stocks List, Charts, Trends & More |
| S&P 500: Technical Analysis, Trends & YTD Performance | |
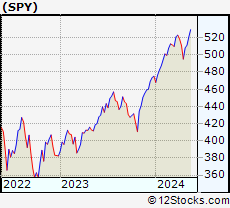
| S&P 500 index as represented by
SPY, an exchange-traded fund [ETF], holds basket of five hundred (mostly largecap) stocks from across all major sectors of the US stock market. The S&P 500 index (contains stocks like Apple and Exxon) is up by 10.95% and is currently outperforming the overall market by 1.16% year-to-date. Below is a quick view of technical charts and trends: | |
 SPY Weekly Chart |
|
| Long Term Trend: Very Good | |
| Medium Term Trend: Very Good | |
 SPY Daily Chart |
|
| Short Term Trend: Not Good | |
| Overall Trend Score: 76 | |
| YTD Performance: 10.95% | |
| **Trend Scores & Views Are Only For Educational Purposes And Not For Investing | |
| 12Stocks.com: Investing in S&P 500 Index using Exchange Traded Funds | |
|
The following table shows list of key exchange traded funds (ETF) that
help investors track S&P 500 index. The following list also includes leveraged ETF funds that track twice or thrice the daily returns of S&P 500 indices. Short or inverse ETF funds move in the opposite direction to the index they track and are useful during market pullbacks or during bear markets. Quick View: Move mouse or cursor over ETF symbol (ticker) to view short-term technical chart and over ETF name to view long term chart. Click on ticker or stock name for detailed view. Click on to add stock symbol to your watchlist and to view watchlist. |
12Stocks.com List of ETFs that track S&P 500 Index
| Ticker | ETF Name | Watchlist | Recent Price | Smart Investing & Trading Score | Change % | Week % | Year-to-date % |
| SPY | SPDR S&P 500 ETF | | 527.37 | 76 | 0.91 | -0.39 | 10.95% |
| IVV | iShares Core S&P 500 ETF | | 529.96 | 76 | 0.88 | -0.41 | 10.96% |
| VOO | Vanguard 500 ETF | | 484.00 | 76 | 0.74 | -0.56 | 10.81% |
| OEF | iShares S&P 100 | | 252.25 | 68 | 0.66 | -0.47 | 12.92% |
| SSO | ProShares Ultra S&P500 | | 77.67 | 63 | 1.76 | -0.97 | 19.36% |
| UPRO | ProShares UltraPro S&P500 | | 70.17 | 68 | 2.63 | -1.46 | 28.19% |
| SPXL | Direxion Daily S&P500 Bull 3X ETF | | 133.30 | 68 | 2.55 | -1.43 | 28.19% |
| SH | ProShares Short S&P500 | | 11.94 | 25 | -0.75 | 0.59 | -8.08% |
| SDS | ProShares UltraShort S&P500 | | 24.91 | 32 | -1.70 | 1.01 | -16.74% |
| SPXU | ProShares UltraPro Short S&P500 | | 32.21 | 32 | -2.54 | 1.51 | -25.09% |
| SPXS | Direxion Daily S&P 500 Bear 3X ETF | | 8.72 | 32 | -2.46 | 1.4 | -24.5% |
| 12Stocks.com: Charts, Trends, Fundamental Data and Performances of S&P 500 Stocks | |
|
We now take in-depth look at all S&P 500 stocks including charts, multi-period performances and overall trends (as measured by Smart Investing & Trading Score). One can sort S&P 500 stocks (click link to choose) by Daily, Weekly and by Year-to-Date performances. Also, one can sort by size of the company or by market capitalization. |
| Select Your Default Chart Type: | |||||
| |||||
| Click on stock symbol or name for detailed view. Click on to add stock symbol to your watchlist and to view watchlist. Quick View: Move mouse or cursor over "Daily" to quickly view daily technical stock chart and over "Weekly" to view weekly technical stock chart. | |||||

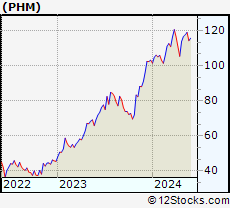 | PHM PulteGroup, Inc. |
| Sector: Industrials | |
| SubSector: Residential Construction | |
| MarketCap: 6186.46 Millions | |
| Recent Price: 117.32 Smart Investing & Trading Score: 58 | |
| Day Percent Change: 1.34% Day Change: 1.55 | |
| Week Change: 2.64% Year-to-date Change: 13.7% | |
| PHM Links: Profile News Message Board | |
| Charts:- Daily , Weekly | |
| Add PHM to Watchlist: View: Get PHM Trend Analysis ➞ | |
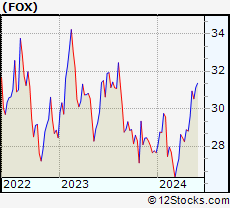 | FOX Twenty-First Century Fox, Inc. |
| Sector: Services & Goods | |
| SubSector: Entertainment - Diversified | |
| MarketCap: 24211.2 Millions | |
| Recent Price: 31.94 Smart Investing & Trading Score: 100 | |
| Day Percent Change: 0.73% Day Change: 0.23 | |
| Week Change: 2.6% Year-to-date Change: 15.5% | |
| FOX Links: Profile News Message Board | |
| Charts:- Daily , Weekly | |
| Add FOX to Watchlist: View: Get FOX Trend Analysis ➞ | |
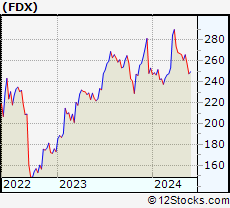 | FDX FedEx Corporation |
| Sector: Transports | |
| SubSector: Air Delivery & Freight Services | |
| MarketCap: 33188 Millions | |
| Recent Price: 253.96 Smart Investing & Trading Score: 58 | |
| Day Percent Change: 1.75% Day Change: 4.38 | |
| Week Change: 2.57% Year-to-date Change: 0.4% | |
| FDX Links: Profile News Message Board | |
| Charts:- Daily , Weekly | |
| Add FDX to Watchlist: View: Get FDX Trend Analysis ➞ | |
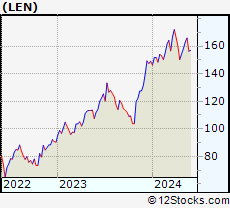 | LEN Lennar Corporation |
| Sector: Industrials | |
| SubSector: Residential Construction | |
| MarketCap: 11926.6 Millions | |
| Recent Price: 160.35 Smart Investing & Trading Score: 58 | |
| Day Percent Change: 2.11% Day Change: 3.32 | |
| Week Change: 2.54% Year-to-date Change: 7.6% | |
| LEN Links: Profile News Message Board | |
| Charts:- Daily , Weekly | |
| Add LEN to Watchlist: View: Get LEN Trend Analysis ➞ | |
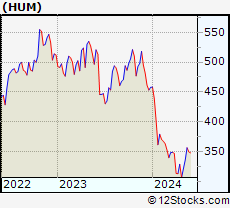 | HUM Humana Inc. |
| Sector: Health Care | |
| SubSector: Health Care Plans | |
| MarketCap: 34125.6 Millions | |
| Recent Price: 358.12 Smart Investing & Trading Score: 100 | |
| Day Percent Change: 3.09% Day Change: 10.74 | |
| Week Change: 2.53% Year-to-date Change: -21.8% | |
| HUM Links: Profile News Message Board | |
| Charts:- Daily , Weekly | |
| Add HUM to Watchlist: View: Get HUM Trend Analysis ➞ | |
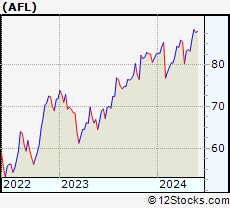 | AFL Aflac Incorporated |
| Sector: Financials | |
| SubSector: Accident & Health Insurance | |
| MarketCap: 22706 Millions | |
| Recent Price: 89.87 Smart Investing & Trading Score: 100 | |
| Day Percent Change: 2.15% Day Change: 1.89 | |
| Week Change: 2.49% Year-to-date Change: 8.9% | |
| AFL Links: Profile News Message Board | |
| Charts:- Daily , Weekly | |
| Add AFL to Watchlist: View: Get AFL Trend Analysis ➞ | |
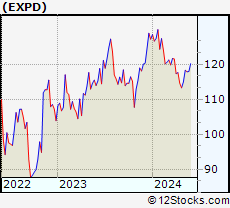 | EXPD Expeditors International of Washington, Inc. |
| Sector: Transports | |
| SubSector: Air Delivery & Freight Services | |
| MarketCap: 10129.8 Millions | |
| Recent Price: 120.90 Smart Investing & Trading Score: 100 | |
| Day Percent Change: 0.57% Day Change: 0.68 | |
| Week Change: 2.49% Year-to-date Change: -5.0% | |
| EXPD Links: Profile News Message Board | |
| Charts:- Daily , Weekly | |
| Add EXPD to Watchlist: View: Get EXPD Trend Analysis ➞ | |
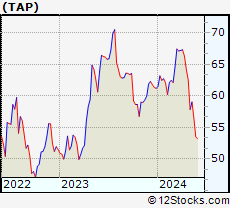 | TAP Molson Coors Beverage Company |
| Sector: Consumer Staples | |
| SubSector: Beverages - Brewers | |
| MarketCap: 8619.97 Millions | |
| Recent Price: 54.81 Smart Investing & Trading Score: 32 | |
| Day Percent Change: 2.99% Day Change: 1.59 | |
| Week Change: 2.45% Year-to-date Change: -10.5% | |
| TAP Links: Profile News Message Board | |
| Charts:- Daily , Weekly | |
| Add TAP to Watchlist: View: Get TAP Trend Analysis ➞ | |
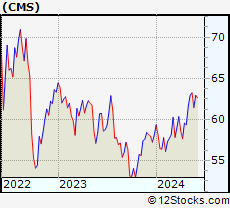 | CMS CMS Energy Corporation |
| Sector: Utilities | |
| SubSector: Electric Utilities | |
| MarketCap: 15105.8 Millions | |
| Recent Price: 62.93 Smart Investing & Trading Score: 76 | |
| Day Percent Change: 2.61% Day Change: 1.60 | |
| Week Change: 2.44% Year-to-date Change: 8.4% | |
| CMS Links: Profile News Message Board | |
| Charts:- Daily , Weekly | |
| Add CMS to Watchlist: View: Get CMS Trend Analysis ➞ | |
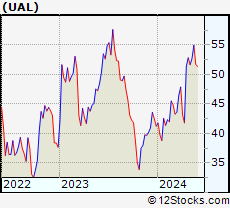 | UAL United Airlines Holdings, Inc. |
| Sector: Transports | |
| SubSector: Major Airlines | |
| MarketCap: 8083.25 Millions | |
| Recent Price: 52.99 Smart Investing & Trading Score: 76 | |
| Day Percent Change: 3.21% Day Change: 1.65 | |
| Week Change: 2.44% Year-to-date Change: 28.4% | |
| UAL Links: Profile News Message Board | |
| Charts:- Daily , Weekly | |
| Add UAL to Watchlist: View: Get UAL Trend Analysis ➞ | |
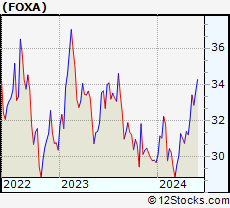 | FOXA Fox Corporation |
| Sector: Services & Goods | |
| SubSector: Entertainment - Diversified | |
| MarketCap: 13440.7 Millions | |
| Recent Price: 34.43 Smart Investing & Trading Score: 100 | |
| Day Percent Change: 0.47% Day Change: 0.16 | |
| Week Change: 2.44% Year-to-date Change: 16.0% | |
| FOXA Links: Profile News Message Board | |
| Charts:- Daily , Weekly | |
| Add FOXA to Watchlist: View: Get FOXA Trend Analysis ➞ | |
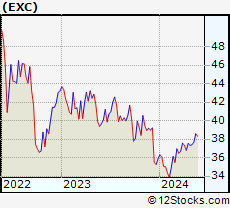 | EXC Exelon Corporation |
| Sector: Utilities | |
| SubSector: Diversified Utilities | |
| MarketCap: 34091.9 Millions | |
| Recent Price: 37.55 Smart Investing & Trading Score: 68 | |
| Day Percent Change: 2.23% Day Change: 0.82 | |
| Week Change: 2.34% Year-to-date Change: 4.6% | |
| EXC Links: Profile News Message Board | |
| Charts:- Daily , Weekly | |
| Add EXC to Watchlist: View: Get EXC Trend Analysis ➞ | |
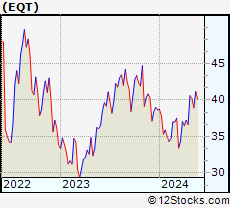 | EQT EQT Corporation |
| Sector: Energy | |
| SubSector: Independent Oil & Gas | |
| MarketCap: 1886.63 Millions | |
| Recent Price: 41.09 Smart Investing & Trading Score: 88 | |
| Day Percent Change: -0.27% Day Change: -0.11 | |
| Week Change: 2.34% Year-to-date Change: 6.3% | |
| EQT Links: Profile News Message Board | |
| Charts:- Daily , Weekly | |
| Add EQT to Watchlist: View: Get EQT Trend Analysis ➞ | |
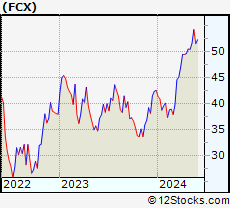 | FCX Freeport-McMoRan Inc. |
| Sector: Materials | |
| SubSector: Copper | |
| MarketCap: 9070.57 Millions | |
| Recent Price: 52.73 Smart Investing & Trading Score: 68 | |
| Day Percent Change: 0.80% Day Change: 0.42 | |
| Week Change: 2.33% Year-to-date Change: 23.9% | |
| FCX Links: Profile News Message Board | |
| Charts:- Daily , Weekly | |
| Add FCX to Watchlist: View: Get FCX Trend Analysis ➞ | |
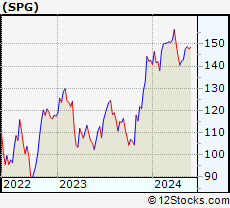 | SPG Simon Property Group, Inc. |
| Sector: Financials | |
| SubSector: REIT - Retail | |
| MarketCap: 17959.6 Millions | |
| Recent Price: 151.31 Smart Investing & Trading Score: 90 | |
| Day Percent Change: 1.93% Day Change: 2.87 | |
| Week Change: 2.32% Year-to-date Change: 6.1% | |
| SPG Links: Profile News Message Board | |
| Charts:- Daily , Weekly | |
| Add SPG to Watchlist: View: Get SPG Trend Analysis ➞ | |
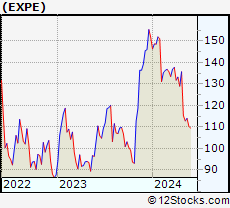 | EXPE Expedia Group, Inc. |
| Sector: Services & Goods | |
| SubSector: Lodging | |
| MarketCap: 8052.96 Millions | |
| Recent Price: 112.86 Smart Investing & Trading Score: 42 | |
| Day Percent Change: 3.09% Day Change: 3.38 | |
| Week Change: 2.31% Year-to-date Change: -25.7% | |
| EXPE Links: Profile News Message Board | |
| Charts:- Daily , Weekly | |
| Add EXPE to Watchlist: View: Get EXPE Trend Analysis ➞ | |
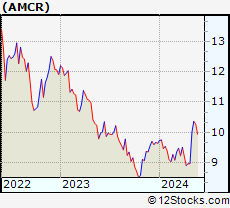 | AMCR Amcor plc |
| Sector: Consumer Staples | |
| SubSector: Packaging & Containers | |
| MarketCap: 13964 Millions | |
| Recent Price: 10.17 Smart Investing & Trading Score: 73 | |
| Day Percent Change: 2.94% Day Change: 0.29 | |
| Week Change: 2.31% Year-to-date Change: 5.5% | |
| AMCR Links: Profile News Message Board | |
| Charts:- Daily , Weekly | |
| Add AMCR to Watchlist: View: Get AMCR Trend Analysis ➞ | |
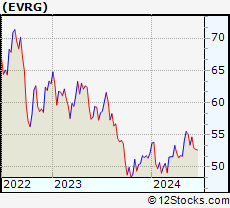 | EVRG Evergy, Inc. |
| Sector: Utilities | |
| SubSector: Electric Utilities | |
| MarketCap: 11914.8 Millions | |
| Recent Price: 54.66 Smart Investing & Trading Score: 68 | |
| Day Percent Change: 2.57% Day Change: 1.37 | |
| Week Change: 2.3% Year-to-date Change: 4.7% | |
| EVRG Links: Profile News Message Board | |
| Charts:- Daily , Weekly | |
| Add EVRG to Watchlist: View: Get EVRG Trend Analysis ➞ | |
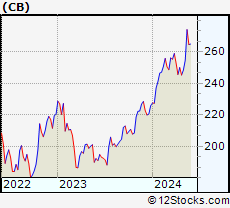 | CB Chubb Limited |
| Sector: Financials | |
| SubSector: Property & Casualty Insurance | |
| MarketCap: 51615.9 Millions | |
| Recent Price: 270.82 Smart Investing & Trading Score: 93 | |
| Day Percent Change: 2.14% Day Change: 5.67 | |
| Week Change: 2.29% Year-to-date Change: 19.8% | |
| CB Links: Profile News Message Board | |
| Charts:- Daily , Weekly | |
| Add CB to Watchlist: View: Get CB Trend Analysis ➞ | |
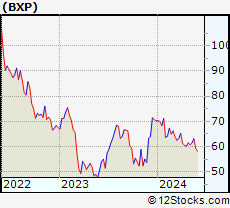 | BXP Boston Properties, Inc. |
| Sector: Financials | |
| SubSector: REIT - Office | |
| MarketCap: 13788.6 Millions | |
| Recent Price: 60.67 Smart Investing & Trading Score: 32 | |
| Day Percent Change: 4.26% Day Change: 2.48 | |
| Week Change: 2.29% Year-to-date Change: -13.5% | |
| BXP Links: Profile News Message Board | |
| Charts:- Daily , Weekly | |
| Add BXP to Watchlist: View: Get BXP Trend Analysis ➞ | |
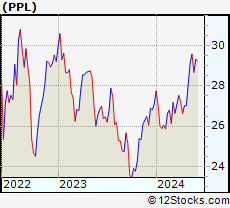 | PPL PPL Corporation |
| Sector: Utilities | |
| SubSector: Electric Utilities | |
| MarketCap: 16588.8 Millions | |
| Recent Price: 29.33 Smart Investing & Trading Score: 83 | |
| Day Percent Change: 2.70% Day Change: 0.77 | |
| Week Change: 2.27% Year-to-date Change: 8.2% | |
| PPL Links: Profile News Message Board | |
| Charts:- Daily , Weekly | |
| Add PPL to Watchlist: View: Get PPL Trend Analysis ➞ | |
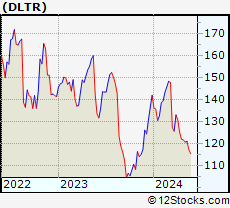 | DLTR Dollar Tree, Inc. |
| Sector: Services & Goods | |
| SubSector: Discount, Variety Stores | |
| MarketCap: 21383.2 Millions | |
| Recent Price: 117.95 Smart Investing & Trading Score: 49 | |
| Day Percent Change: 2.75% Day Change: 3.16 | |
| Week Change: 2.24% Year-to-date Change: -17.0% | |
| DLTR Links: Profile News Message Board | |
| Charts:- Daily , Weekly | |
| Add DLTR to Watchlist: View: Get DLTR Trend Analysis ➞ | |
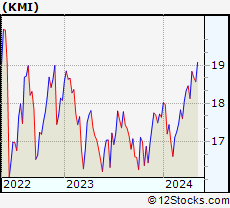 | KMI Kinder Morgan, Inc. |
| Sector: Energy | |
| SubSector: Oil & Gas Pipelines | |
| MarketCap: 31283.5 Millions | |
| Recent Price: 19.49 Smart Investing & Trading Score: 83 | |
| Day Percent Change: 2.58% Day Change: 0.49 | |
| Week Change: 2.2% Year-to-date Change: 10.5% | |
| KMI Links: Profile News Message Board | |
| Charts:- Daily , Weekly | |
| Add KMI to Watchlist: View: Get KMI Trend Analysis ➞ | |
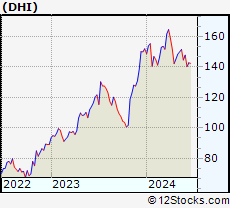 | DHI D.R. Horton, Inc. |
| Sector: Industrials | |
| SubSector: Residential Construction | |
| MarketCap: 13372.6 Millions | |
| Recent Price: 147.80 Smart Investing & Trading Score: 32 | |
| Day Percent Change: 1.59% Day Change: 2.31 | |
| Week Change: 2.2% Year-to-date Change: -2.8% | |
| DHI Links: Profile News Message Board | |
| Charts:- Daily , Weekly | |
| Add DHI to Watchlist: View: Get DHI Trend Analysis ➞ | |
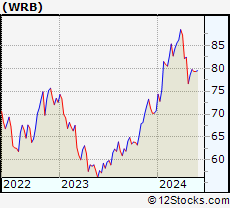 | WRB W. R. Berkley Corporation |
| Sector: Financials | |
| SubSector: Property & Casualty Insurance | |
| MarketCap: 9863.82 Millions | |
| Recent Price: 81.03 Smart Investing & Trading Score: 64 | |
| Day Percent Change: 1.92% Day Change: 1.53 | |
| Week Change: 2.19% Year-to-date Change: 14.6% | |
| WRB Links: Profile News Message Board | |
| Charts:- Daily , Weekly | |
| Add WRB to Watchlist: View: Get WRB Trend Analysis ➞ | |
| For tabular summary view of above stock list: Summary View ➞ 0 - 25 , 25 - 50 , 50 - 75 , 75 - 100 , 100 - 125 , 125 - 150 , 150 - 175 , 175 - 200 , 200 - 225 , 225 - 250 , 250 - 275 , 275 - 300 , 300 - 325 , 325 - 350 , 350 - 375 , 375 - 400 , 400 - 425 , 425 - 450 , 450 - 475 , 475 - 500 | ||
| Click To Change The Sort Order: By Market Cap or Company Size Performance: Year-to-date, Week and Day | |
| Select Chart Type: | ||
|
Best Stocks Today 12Stocks.com |
© 2024 12Stocks.com Terms & Conditions Privacy Contact Us
All Information Provided Only For Education And Not To Be Used For Investing or Trading. See Terms & Conditions


One More Thing ... Get Best Stocks Delivered Daily!
Never Ever Miss A Move With Our Top Ten Stocks Lists
Find Best Stocks In Any Market - Bull or Bear Market
Take A Peek At Our Top Ten Stocks Lists: Daily, Weekly, Year-to-Date & Top Trends
Find Best Stocks In Any Market - Bull or Bear Market
Take A Peek At Our Top Ten Stocks Lists: Daily, Weekly, Year-to-Date & Top Trends
S&P 500 Stocks With Best Up Trends [0-bearish to 100-bullish]: Best Buy[100], Bank of America[100], AT&T [100], NetApp [100], Humana [100], Edison [100], Otis Worldwide[100], CenterPoint [100], Ventas [100], T-Mobile US[100], NextEra [100]
Best S&P 500 Stocks Year-to-Date:
NVIDIA [121.38%], Constellation [85.51%], First Solar[57.74%], NRG [56.67%], Micron [46.47%], Western Digital[43.77%], Moderna [43.34%], QUALCOMM [41.08%], Eli Lilly[40.73%], DaVita [40.44%], Eaton [38.22%] Best S&P 500 Stocks This Week:
Best Buy[18.63%], Marathon Oil[13.3%], HP [11.45%], Ralph Lauren[7.74%], V.F [7.62%], Universal Health[7.61%], Target [7.53%], Whirlpool [7.52%], CVS Health[7.31%], HCA Healthcare[6.6%], DaVita [6.19%] Best S&P 500 Stocks Daily:
Caesars Entertainment[11.65%], V.F [7.70%], salesforce.com [7.54%], Dollar General[7.01%], CVS Health[6.35%], Walgreens Boots[5.39%], Cooper [4.52%], Entergy [4.37%], Boston Properties[4.26%], MGM Resorts[4.26%], Target [4.20%]