
 Login Sign Up


| |||||
 |  | ||||

| 12Stocks.com Market Intelligence |
Best Healthcare Stocks
 | "Discover best trending healthcare stocks with 12Stocks.com." |
| - Subu Vdaygiri, Founder, 12Stocks.com |
| In a hurry? Healthcare Stocks Lists: Performance Trends Table, Stock Charts
Sort Healthcare stocks: Daily, Weekly, Year-to-Date, Market Cap & Trends. Filter Healthcare stocks list by size:All Healthcare Large Mid-Range Small |
| 12Stocks.com Healthcare Stocks Performances & Trends Daily | |||||||||
|
|  The overall Smart Investing & Trading Score is 55 (0-bearish to 100-bullish) which puts Healthcare sector in short term neutral trend. The Smart Investing & Trading Score from previous trading session is 15 and hence an improvement of trend.
| ||||||||
Here are the Smart Investing & Trading Scores of the most requested Healthcare stocks at 12Stocks.com (click stock name for detailed review):
|


| 12Stocks.com: Investing in Healthcare sector with Stocks | |
|
The following table helps investors and traders sort through current performance and trends (as measured by Smart Investing & Trading Score) of various
stocks in the Healthcare sector. Quick View: Move mouse or cursor over stock symbol (ticker) to view short-term Technical chart and over stock name to view long term chart. Click on  to add stock symbol to your watchlist and to add stock symbol to your watchlist and  to view watchlist. Click on any ticker or stock name for detailed market intelligence report for that stock. to view watchlist. Click on any ticker or stock name for detailed market intelligence report for that stock. |
12Stocks.com Performance of Stocks in Healthcare Sector
| Ticker | Stock Name | Watchlist | Category | Recent Price | Smart Investing & Trading Score | Change % | YTD Change% |
| BMEA | Biomea Fusion |   | Biotechnology | 10.52 | 10 | 0.57 | -28.14% |
| FBIO | Fortress Biotech | | Biotechnology | 1.84 | 47 | 0.55 | -38.87% |
| OSCR | Oscar Health | | Healthcare Plans | 19.96 | 58 | 0.55 | 119.22% |
| SIGA | SIGA Technologies | | Biotechnology | 7.48 | 46 | 0.54 | 33.57% |
| DNLI | Denali | | Biotechnology | 18.56 | 42 | 0.54 | -13.51% |
| CKPT | Checkpoint | | Biotechnology | 1.90 | 57 | 0.53 | -17.03% |
| FHTX | Foghorn | | Biotechnology | 5.83 | 50 | 0.52 | -9.12% |
| TFFP | TFF | | Biotechnology | 2.06 | 30 | 0.49 | -70.66% |
| ELAN | Elanco Animal | | Pharmaceutical | 17.68 | 95 | 0.45 | 18.66% |
| ABT | Abbott | | Equipment | 102.19 | 35 | 0.44 | -7.16% |
| EXAS | Exact Sciences | | Laboratories | 45.45 | 10 | 0.44 | -38.56% |
| CPRX | Catalyst | | Biotechnology | 16.18 | 78 | 0.43 | -3.75% |
| AMPH | Amphastar | | Pharmaceutical | 42.33 | 50 | 0.43 | -31.56% |
| WAT | Waters | | Instruments | 308.90 | 0 | 0.42 | -6.18% |
| MDXG | MiMedx | | Equipment | 7.15 | 15 | 0.42 | -18.47% |
| RVMD | Revolution Medicines | | Biotechnology | 38.33 | 68 | 0.42 | 33.65% |
| BDTX | Black Diamond | | Biotechnology | 4.78 | 32 | 0.42 | 70.11% |
| BLTE | Belite Bio | | Biotechnology | 48.95 | 93 | 0.41 | 7.46% |
| NHC | National | | Long-Term | 105.75 | 100 | 0.40 | 14.42% |
| CCCC | C4 | | Biotechnology | 5.00 | 10 | 0.40 | -11.35% |
| DRTS | Alpha Tau | | Biotechnology | 2.51 | 40 | 0.40 | -16.05% |
| LIVN | LivaNova | | Equipment | 61.07 | 61 | 0.39 | 18.03% |
| DH | Definitive | | Health Information | 5.32 | 15 | 0.38 | -47.17% |
| GALT | Galectin | | Biotechnology | 2.72 | 48 | 0.37 | 63.86% |
| CTLT | Catalent | | Pharmaceutical | 53.79 | 35 | 0.34 | 19.72% |
| For chart view version of above stock list: Chart View ➞ 0 - 25 , 25 - 50 , 50 - 75 , 75 - 100 , 100 - 125 , 125 - 150 , 150 - 175 , 175 - 200 , 200 - 225 , 225 - 250 , 250 - 275 , 275 - 300 , 300 - 325 , 325 - 350 , 350 - 375 , 375 - 400 , 400 - 425 , 425 - 450 , 450 - 475 , 475 - 500 , 500 - 525 , 525 - 550 , 550 - 575 , 575 - 600 , 600 - 625 , 625 - 650 , 650 - 675 , 675 - 700 , 700 - 725 | ||
 | Click To Change The Sort Order: By Market Cap or Company Size Performance: Year-to-date, Week and Day |  |
|
Get the most comprehensive stock market coverage daily at 12Stocks.com ➞ Best Stocks Today ➞ Best Stocks Weekly ➞ Best Stocks Year-to-Date ➞ Best Stocks Trends ➞  Best Stocks Today 12Stocks.com Best Nasdaq Stocks ➞ Best S&P 500 Stocks ➞ Best Tech Stocks ➞ Best Biotech Stocks ➞ |
| Detailed Overview of Healthcare Stocks |
| Healthcare Technical Overview, Leaders & Laggards, Top Healthcare ETF Funds & Detailed Healthcare Stocks List, Charts, Trends & More |
| Healthcare Sector: Technical Analysis, Trends & YTD Performance | |
| Healthcare sector is composed of stocks
from pharmaceutical, biotech, diagnostics labs, insurance providers
and healthcare services. Healthcare sector, as represented by XLV, an exchange-traded fund [ETF] that holds basket of Healthcare stocks (e.g, Merck, Amgen) is up by 5.37% and is currently underperforming the overall market by -4.42% year-to-date. Below is a quick view of Technical charts and trends: |
|
 XLV Weekly Chart |
|
| Long Term Trend: Not Good | |
| Medium Term Trend: Very Good | |
 XLV Daily Chart |
|
| Short Term Trend: Very Good | |
| Overall Trend Score: 55 | |
| YTD Performance: 5.37% | |
| **Trend Scores & Views Are Only For Educational Purposes And Not For Investing | |
| 12Stocks.com: Top Performing Healthcare Sector Stocks | ||||||||||||||||||||||||||||||||||||||||||||||||
 The top performing Healthcare sector stocks year to date are
Now, more recently, over last week, the top performing Healthcare sector stocks on the move are


|
||||||||||||||||||||||||||||||||||||||||||||||||
| 12Stocks.com: Investing in Healthcare Sector using Exchange Traded Funds | |
|
The following table shows list of key exchange traded funds (ETF) that
help investors track Healthcare Index. For detailed view, check out our ETF Funds section of our website. Quick View: Move mouse or cursor over ETF symbol (ticker) to view short-term Technical chart and over ETF name to view long term chart. Click on ticker or stock name for detailed view. Click on to add stock symbol to your watchlist and to view watchlist. |
12Stocks.com List of ETFs that track Healthcare Index
| Ticker | ETF Name | Watchlist | Recent Price | Smart Investing & Trading Score | Change % | Week % | Year-to-date % |
| XLV | Health Care | | 143.70 | 55 | 1.46 | -0.5 | 5.37% |
| XBI | Biotech | | 89.13 | 35 | 0.19 | 0.34 | -0.18% |
| IBB | Biotechnology | | 133.88 | 50 | 0.40 | -1.32 | -1.45% |
| BBH | Biotech | | 164.59 | 86 | 0.39 | -2.06 | -0.44% |
| VHT | Health Care | | 260.81 | 50 | 0.73 | -1.02 | 4.03% |
| IYH | Healthcare | | 59.88 | 50 | 0.73 | -1.19 | 4.6% |
| IHF | Healthcare Providers | | 52.67 | 63 | 2.48 | 0.38 | 0.3% |
| IHI | Medical Devices | | 55.53 | 25 | 0.33 | -0.96 | 2.89% |
| BIB | Biotechnology | | 55.61 | 60 | 0.53 | -1.87 | -2.52% |
| BIS | Short Biotech | | 17.91 | 48 | -1.49 | 1.13 | -0.89% |
| XHE | Health Care Equipment | | 86.31 | 81 | 0.15 | 0.04 | 2.43% |
| CURE | Healthcare Bull 3X | | 111.99 | 62 | 4.17 | -2.02 | 10.07% |
| LABU | Biotech Bull 3X | | 103.29 | 35 | 0.48 | 0.57 | -15.32% |
| LABD | Biotech Bear 3X | | 8.48 | 56 | -0.35 | -1.05 | -12.49% |
| PSCH | SmallCap Health Care | | 43.19 | 76 | 0.84 | 0.35 | 0.91% |
| XHS | Health Care Services | | 91.65 | 93 | 0.45 | 1.33 | 3.04% |
| PTH | DWA Healthcare Momentum | | 41.70 | 42 | 0.12 | -0.67 | 6.54% |
| BTEC | Principal Healthcare Innovators | | 36.06 | 40 | 2.25 | 0.51 | -0.74% |
| RXL | Health Care | | 98.67 | 57 | 2.60 | -1.4 | 7.95% |
| RXD | Short Health Care | | 10.88 | 33 | -3.80 | 0.24 | -8.76% |
| 12Stocks.com: Charts, Trends, Fundamental Data and Performances of Healthcare Stocks | |
|
We now take in-depth look at all Healthcare stocks including charts, multi-period performances and overall trends (as measured by Smart Investing & Trading Score). One can sort Healthcare stocks (click link to choose) by Daily, Weekly and by Year-to-Date performances. Also, one can sort by size of the company or by market capitalization. |
| Select Your Default Chart Type: | |||||
| |||||
| Click on stock symbol or name for detailed view. Click on to add stock symbol to your watchlist and to view watchlist. Quick View: Move mouse or cursor over "Daily" to quickly view daily Technical stock chart and over "Weekly" to view weekly Technical stock chart. | |||||

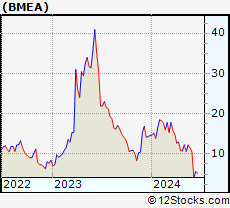 | BMEA Biomea Fusion, Inc. |
| Sector: Health Care | |
| SubSector: Biotechnology | |
| MarketCap: 818 Millions | |
| Recent Price: 10.52 Smart Investing & Trading Score: 10 | |
| Day Percent Change: 0.57% Day Change: 0.06 | |
| Week Change: -9.15% Year-to-date Change: -28.1% | |
| BMEA Links: Profile News Message Board | |
| Charts:- Daily , Weekly | |
| Add BMEA to Watchlist: View: Get Complete BMEA Trend Analysis ➞ | |
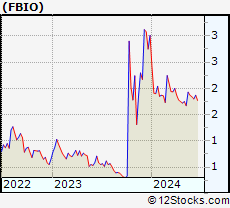 | FBIO Fortress Biotech, Inc. |
| Sector: Health Care | |
| SubSector: Biotechnology | |
| MarketCap: 116.885 Millions | |
| Recent Price: 1.84 Smart Investing & Trading Score: 47 | |
| Day Percent Change: 0.55% Day Change: 0.01 | |
| Week Change: -1.6% Year-to-date Change: -38.9% | |
| FBIO Links: Profile News Message Board | |
| Charts:- Daily , Weekly | |
| Add FBIO to Watchlist: View: Get Complete FBIO Trend Analysis ➞ | |
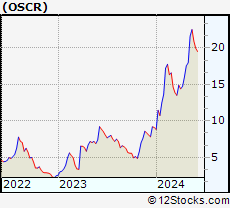 | OSCR Oscar Health, Inc. |
| Sector: Health Care | |
| SubSector: Healthcare Plans | |
| MarketCap: 1790 Millions | |
| Recent Price: 19.96 Smart Investing & Trading Score: 58 | |
| Day Percent Change: 0.55% Day Change: 0.11 | |
| Week Change: -4.68% Year-to-date Change: 119.2% | |
| OSCR Links: Profile News Message Board | |
| Charts:- Daily , Weekly | |
| Add OSCR to Watchlist: View: Get Complete OSCR Trend Analysis ➞ | |
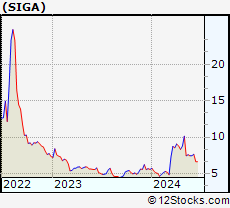 | SIGA SIGA Technologies, Inc. |
| Sector: Health Care | |
| SubSector: Biotechnology | |
| MarketCap: 424.285 Millions | |
| Recent Price: 7.48 Smart Investing & Trading Score: 46 | |
| Day Percent Change: 0.54% Day Change: 0.04 | |
| Week Change: 0.27% Year-to-date Change: 33.6% | |
| SIGA Links: Profile News Message Board | |
| Charts:- Daily , Weekly | |
| Add SIGA to Watchlist: View: Get Complete SIGA Trend Analysis ➞ | |
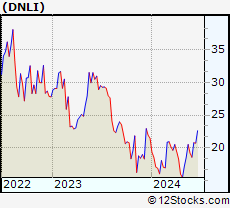 | DNLI Denali Therapeutics Inc. |
| Sector: Health Care | |
| SubSector: Biotechnology | |
| MarketCap: 2020.05 Millions | |
| Recent Price: 18.56 Smart Investing & Trading Score: 42 | |
| Day Percent Change: 0.54% Day Change: 0.10 | |
| Week Change: -3.38% Year-to-date Change: -13.5% | |
| DNLI Links: Profile News Message Board | |
| Charts:- Daily , Weekly | |
| Add DNLI to Watchlist: View: Get Complete DNLI Trend Analysis ➞ | |
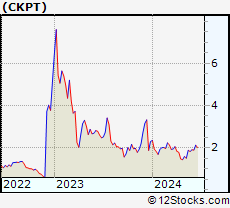 | CKPT Checkpoint Therapeutics, Inc. |
| Sector: Health Care | |
| SubSector: Biotechnology | |
| MarketCap: 78.4785 Millions | |
| Recent Price: 1.90 Smart Investing & Trading Score: 57 | |
| Day Percent Change: 0.53% Day Change: 0.01 | |
| Week Change: 4.4% Year-to-date Change: -17.0% | |
| CKPT Links: Profile News Message Board | |
| Charts:- Daily , Weekly | |
| Add CKPT to Watchlist: View: Get Complete CKPT Trend Analysis ➞ | |
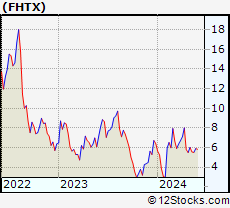 | FHTX Foghorn Therapeutics Inc. |
| Sector: Health Care | |
| SubSector: Biotechnology | |
| MarketCap: 74487 Millions | |
| Recent Price: 5.83 Smart Investing & Trading Score: 50 | |
| Day Percent Change: 0.52% Day Change: 0.03 | |
| Week Change: -1.1% Year-to-date Change: -9.1% | |
| FHTX Links: Profile News Message Board | |
| Charts:- Daily , Weekly | |
| Add FHTX to Watchlist: View: Get Complete FHTX Trend Analysis ➞ | |
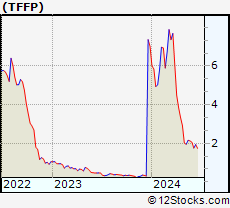 | TFFP TFF Pharmaceuticals, Inc. |
| Sector: Health Care | |
| SubSector: Biotechnology | |
| MarketCap: 80.0785 Millions | |
| Recent Price: 2.06 Smart Investing & Trading Score: 30 | |
| Day Percent Change: 0.49% Day Change: 0.01 | |
| Week Change: -3.29% Year-to-date Change: -70.7% | |
| TFFP Links: Profile News Message Board | |
| Charts:- Daily , Weekly | |
| Add TFFP to Watchlist: View: Get Complete TFFP Trend Analysis ➞ | |
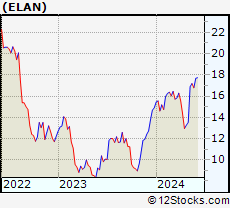 | ELAN Elanco Animal Health Incorporated |
| Sector: Health Care | |
| SubSector: Drugs - Generic | |
| MarketCap: 7752.15 Millions | |
| Recent Price: 17.68 Smart Investing & Trading Score: 95 | |
| Day Percent Change: 0.45% Day Change: 0.08 | |
| Week Change: 5.3% Year-to-date Change: 18.7% | |
| ELAN Links: Profile News Message Board | |
| Charts:- Daily , Weekly | |
| Add ELAN to Watchlist: View: Get Complete ELAN Trend Analysis ➞ | |
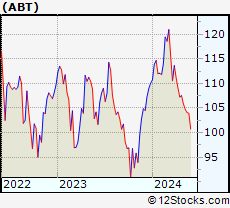 | ABT Abbott Laboratories |
| Sector: Health Care | |
| SubSector: Medical Appliances & Equipment | |
| MarketCap: 125288 Millions | |
| Recent Price: 102.19 Smart Investing & Trading Score: 35 | |
| Day Percent Change: 0.44% Day Change: 0.45 | |
| Week Change: -1.69% Year-to-date Change: -7.2% | |
| ABT Links: Profile News Message Board | |
| Charts:- Daily , Weekly | |
| Add ABT to Watchlist: View: Get Complete ABT Trend Analysis ➞ | |
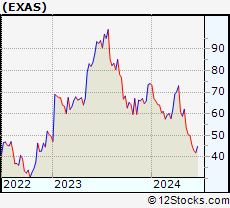 | EXAS Exact Sciences Corporation |
| Sector: Health Care | |
| SubSector: Medical Laboratories & Research | |
| MarketCap: 8572 Millions | |
| Recent Price: 45.45 Smart Investing & Trading Score: 10 | |
| Day Percent Change: 0.44% Day Change: 0.20 | |
| Week Change: -8.81% Year-to-date Change: -38.6% | |
| EXAS Links: Profile News Message Board | |
| Charts:- Daily , Weekly | |
| Add EXAS to Watchlist: View: Get Complete EXAS Trend Analysis ➞ | |
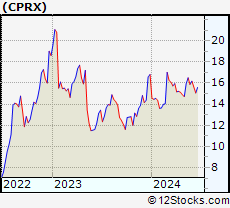 | CPRX Catalyst Pharmaceuticals, Inc. |
| Sector: Health Care | |
| SubSector: Biotechnology | |
| MarketCap: 365.185 Millions | |
| Recent Price: 16.18 Smart Investing & Trading Score: 78 | |
| Day Percent Change: 0.43% Day Change: 0.07 | |
| Week Change: 1.95% Year-to-date Change: -3.8% | |
| CPRX Links: Profile News Message Board | |
| Charts:- Daily , Weekly | |
| Add CPRX to Watchlist: View: Get Complete CPRX Trend Analysis ➞ | |
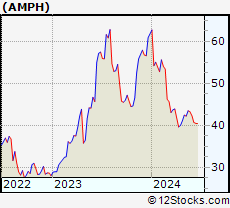 | AMPH Amphastar Pharmaceuticals, Inc. |
| Sector: Health Care | |
| SubSector: Drug Manufacturers - Other | |
| MarketCap: 655.533 Millions | |
| Recent Price: 42.33 Smart Investing & Trading Score: 50 | |
| Day Percent Change: 0.43% Day Change: 0.18 | |
| Week Change: -2.15% Year-to-date Change: -31.6% | |
| AMPH Links: Profile News Message Board | |
| Charts:- Daily , Weekly | |
| Add AMPH to Watchlist: View: Get Complete AMPH Trend Analysis ➞ | |
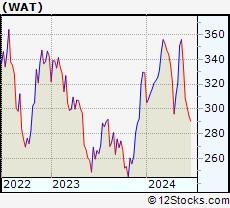 | WAT Waters Corporation |
| Sector: Health Care | |
| SubSector: Medical Instruments & Supplies | |
| MarketCap: 11882 Millions | |
| Recent Price: 308.90 Smart Investing & Trading Score: 0 | |
| Day Percent Change: 0.42% Day Change: 1.28 | |
| Week Change: -8.19% Year-to-date Change: -6.2% | |
| WAT Links: Profile News Message Board | |
| Charts:- Daily , Weekly | |
| Add WAT to Watchlist: View: Get Complete WAT Trend Analysis ➞ | |
 | MDXG MiMedx Group, Inc. |
| Sector: Health Care | |
| SubSector: Medical Appliances & Equipment | |
| MarketCap: 371.08 Millions | |
| Recent Price: 7.15 Smart Investing & Trading Score: 15 | |
| Day Percent Change: 0.42% Day Change: 0.03 | |
| Week Change: -7.74% Year-to-date Change: -18.5% | |
| MDXG Links: Profile News Message Board | |
| Charts:- Daily , Weekly | |
| Add MDXG to Watchlist: View: Get Complete MDXG Trend Analysis ➞ | |
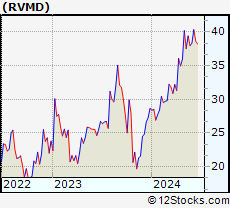 | RVMD Revolution Medicines, Inc. |
| Sector: Health Care | |
| SubSector: Biotechnology | |
| MarketCap: 28087 Millions | |
| Recent Price: 38.33 Smart Investing & Trading Score: 68 | |
| Day Percent Change: 0.42% Day Change: 0.16 | |
| Week Change: 1% Year-to-date Change: 33.7% | |
| RVMD Links: Profile News Message Board | |
| Charts:- Daily , Weekly | |
| Add RVMD to Watchlist: View: Get Complete RVMD Trend Analysis ➞ | |
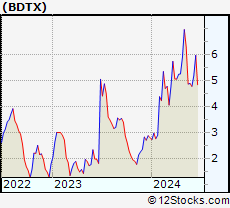 | BDTX Black Diamond Therapeutics, Inc. |
| Sector: Health Care | |
| SubSector: Biotechnology | |
| MarketCap: 12587 Millions | |
| Recent Price: 4.78 Smart Investing & Trading Score: 32 | |
| Day Percent Change: 0.42% Day Change: 0.02 | |
| Week Change: -2.25% Year-to-date Change: 70.1% | |
| BDTX Links: Profile News Message Board | |
| Charts:- Daily , Weekly | |
| Add BDTX to Watchlist: View: Get Complete BDTX Trend Analysis ➞ | |
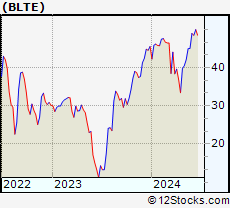 | BLTE Belite Bio, Inc |
| Sector: Health Care | |
| SubSector: Biotechnology | |
| MarketCap: 404 Millions | |
| Recent Price: 48.95 Smart Investing & Trading Score: 93 | |
| Day Percent Change: 0.41% Day Change: 0.20 | |
| Week Change: 8.71% Year-to-date Change: 7.5% | |
| BLTE Links: Profile News Message Board | |
| Charts:- Daily , Weekly | |
| Add BLTE to Watchlist: View: Get Complete BLTE Trend Analysis ➞ | |
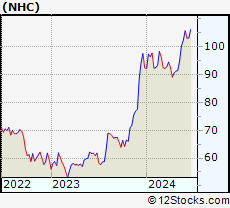 | NHC National HealthCare Corporation |
| Sector: Health Care | |
| SubSector: Long-Term Care Facilities | |
| MarketCap: 1164.86 Millions | |
| Recent Price: 105.75 Smart Investing & Trading Score: 100 | |
| Day Percent Change: 0.40% Day Change: 0.42 | |
| Week Change: 3.34% Year-to-date Change: 14.4% | |
| NHC Links: Profile News Message Board | |
| Charts:- Daily , Weekly | |
| Add NHC to Watchlist: View: Get Complete NHC Trend Analysis ➞ | |
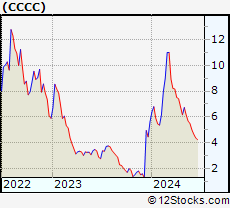 | CCCC C4 Therapeutics, Inc. |
| Sector: Health Care | |
| SubSector: Biotechnology | |
| MarketCap: 12587 Millions | |
| Recent Price: 5.00 Smart Investing & Trading Score: 10 | |
| Day Percent Change: 0.40% Day Change: 0.02 | |
| Week Change: -8.93% Year-to-date Change: -11.4% | |
| CCCC Links: Profile News Message Board | |
| Charts:- Daily , Weekly | |
| Add CCCC to Watchlist: View: Get Complete CCCC Trend Analysis ➞ | |
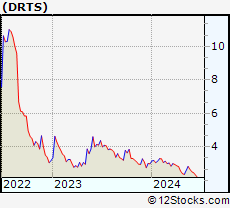 | DRTS Alpha Tau Medical Ltd. |
| Sector: Health Care | |
| SubSector: Biotechnology | |
| MarketCap: 300 Millions | |
| Recent Price: 2.51 Smart Investing & Trading Score: 40 | |
| Day Percent Change: 0.40% Day Change: 0.01 | |
| Week Change: -5.28% Year-to-date Change: -16.1% | |
| DRTS Links: Profile News Message Board | |
| Charts:- Daily , Weekly | |
| Add DRTS to Watchlist: View: Get Complete DRTS Trend Analysis ➞ | |
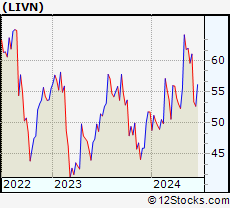 | LIVN LivaNova PLC |
| Sector: Health Care | |
| SubSector: Medical Appliances & Equipment | |
| MarketCap: 2060.5 Millions | |
| Recent Price: 61.07 Smart Investing & Trading Score: 61 | |
| Day Percent Change: 0.39% Day Change: 0.24 | |
| Week Change: 2.47% Year-to-date Change: 18.0% | |
| LIVN Links: Profile News Message Board | |
| Charts:- Daily , Weekly | |
| Add LIVN to Watchlist: View: Get Complete LIVN Trend Analysis ➞ | |
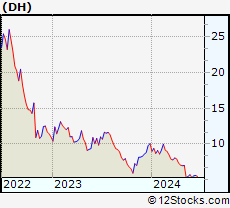 | DH Definitive Healthcare Corp. |
| Sector: Health Care | |
| SubSector: Health Information Services | |
| MarketCap: 1690 Millions | |
| Recent Price: 5.32 Smart Investing & Trading Score: 15 | |
| Day Percent Change: 0.38% Day Change: 0.02 | |
| Week Change: -7.24% Year-to-date Change: -47.2% | |
| DH Links: Profile News Message Board | |
| Charts:- Daily , Weekly | |
| Add DH to Watchlist: View: Get Complete DH Trend Analysis ➞ | |
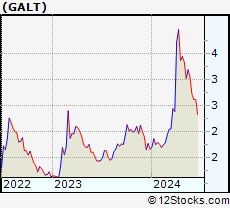 | GALT Galectin Therapeutics, Inc. |
| Sector: Health Care | |
| SubSector: Biotechnology | |
| MarketCap: 114.185 Millions | |
| Recent Price: 2.72 Smart Investing & Trading Score: 48 | |
| Day Percent Change: 0.37% Day Change: 0.01 | |
| Week Change: -10.82% Year-to-date Change: 63.9% | |
| GALT Links: Profile News Message Board | |
| Charts:- Daily , Weekly | |
| Add GALT to Watchlist: View: Get Complete GALT Trend Analysis ➞ | |
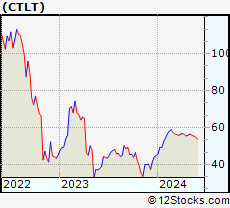 | CTLT Catalent, Inc. |
| Sector: Health Care | |
| SubSector: Drugs - Generic | |
| MarketCap: 6351.95 Millions | |
| Recent Price: 53.79 Smart Investing & Trading Score: 35 | |
| Day Percent Change: 0.34% Day Change: 0.18 | |
| Week Change: -1.88% Year-to-date Change: 19.7% | |
| CTLT Links: Profile News Message Board | |
| Charts:- Daily , Weekly | |
| Add CTLT to Watchlist: View: Get Complete CTLT Trend Analysis ➞ | |
| For tabular summary view of above stock list: Summary View ➞ 0 - 25 , 25 - 50 , 50 - 75 , 75 - 100 , 100 - 125 , 125 - 150 , 150 - 175 , 175 - 200 , 200 - 225 , 225 - 250 , 250 - 275 , 275 - 300 , 300 - 325 , 325 - 350 , 350 - 375 , 375 - 400 , 400 - 425 , 425 - 450 , 450 - 475 , 475 - 500 , 500 - 525 , 525 - 550 , 550 - 575 , 575 - 600 , 600 - 625 , 625 - 650 , 650 - 675 , 675 - 700 , 700 - 725 | ||
| Click To Change The Sort Order: By Market Cap or Company Size Performance: Year-to-date, Week and Day | |
| Select Chart Type: | ||
|
Best Stocks Today 12Stocks.com |
© 2024 12Stocks.com Terms & Conditions Privacy Contact Us
All Information Provided Only For Education And Not To Be Used For Investing or Trading. See Terms & Conditions


One More Thing ... Get Best Stocks Delivered Daily!
Never Ever Miss A Move With Our Top Ten Stocks Lists
Find Best Stocks In Any Market - Bull or Bear Market
Take A Peek At Our Top Ten Stocks Lists: Daily, Weekly, Year-to-Date & Top Trends
Find Best Stocks In Any Market - Bull or Bear Market
Take A Peek At Our Top Ten Stocks Lists: Daily, Weekly, Year-to-Date & Top Trends
Healthcare Stocks With Best Up Trends [0-bearish to 100-bullish]: DURECT [100], AC Immune[100], PureTech Health[100], Heron [100], Agenus [100], Calliditas [100], Humana [100], Addus HomeCare[100], Community Health[100], Novartis AG[100], Universal Health[100]
Best Healthcare Stocks Year-to-Date:
Pieris [5277.75%], Precision BioSciences[3434.25%], Avenue [2036.65%], Inovio [1886.27%], Agenus [1795.16%], Assembly Biosciences[1747.34%], Aurora Cannabis[1199.87%], NuCana [1120.42%], Adverum Biotechnologies[952.07%], Burning Rock[641.01%], GeneDx [620.96%] Best Healthcare Stocks This Week:
Summit [156.95%], Insmed [150.23%], Calliditas [82.02%], Ikena Oncology[35.11%], DURECT [32.69%], Orchestra BioMed[32%], AC Immune[31.36%], Bright Green[28.42%], Arcturus [27.58%], Janux [22.4%], Surmodics [22.34%] Best Healthcare Stocks Daily:
DURECT [27.78%], Exicure [26.55%], Bright Green[23.18%], AC Immune[17.13%], Renalytix AI[15.19%], Accuray [12.74%], Emergent Bio[11.98%], Adaptimmune [11.88%], Sol-Gel Technologies[10.96%], Greenwich LifeSciences[10.59%], Taysha Gene[9.58%]