
 Login Sign Up


| |||||
 |  | ||||

| 12Stocks.com Market Intelligence |
Best Healthcare Stocks
 | "Discover best trending healthcare stocks with 12Stocks.com." |
| - Subu Vdaygiri, Founder, 12Stocks.com |
| In a hurry? Healthcare Stocks Lists: Performance Trends Table, Stock Charts
Sort Healthcare stocks: Daily, Weekly, Year-to-Date, Market Cap & Trends. Filter Healthcare stocks list by size:All Healthcare Large Mid-Range Small |
| 12Stocks.com Healthcare Stocks Performances & Trends Daily | |||||||||
|
|  The overall Smart Investing & Trading Score is 50 (0-bearish to 100-bullish) which puts Healthcare sector in short term neutral trend. The Smart Investing & Trading Score from previous trading session is 80 and a deterioration of trend continues.
| ||||||||
Here are the Smart Investing & Trading Scores of the most requested Healthcare stocks at 12Stocks.com (click stock name for detailed review):
|


| 12Stocks.com: Investing in Healthcare sector with Stocks | |
|
The following table helps investors and traders sort through current performance and trends (as measured by Smart Investing & Trading Score) of various
stocks in the Healthcare sector. Quick View: Move mouse or cursor over stock symbol (ticker) to view short-term Technical chart and over stock name to view long term chart. Click on  to add stock symbol to your watchlist and to add stock symbol to your watchlist and  to view watchlist. Click on any ticker or stock name for detailed market intelligence report for that stock. to view watchlist. Click on any ticker or stock name for detailed market intelligence report for that stock. |
12Stocks.com Performance of Stocks in Healthcare Sector
| Ticker | Stock Name | Watchlist | Category | Recent Price | Smart Investing & Trading Score | Change % | YTD Change% |
| IRON | Disc Medicine |   | Biotechnology | 46.27 | 64 | 18.16 | -20.23% |
| OCUL | Ocular Therapeutix | | Biotechnology | 5.75 | 42 | 14.09 | 28.92% |
| MOLN | Molecular Partners | | Biotechnology | 6.77 | 100 | 13.78 | 68.62% |
| BEAT | BioTelemetry | | Laboratories | 2.30 | 63 | 12.75 | -2.13% |
| URGN | UroGen Pharma | | Biotechnology | 19.20 | 100 | 9.84 | 28.00% |
| RNLX | Renalytix AI | | Diagnostics & Research | 0.51 | 69 | 9.67 | 29.90% |
| ANTX | AN2 | | Biotechnology | 2.17 | 64 | 9.05 | -89.40% |
| SCLX | Scilex Holding | | Drug Manufacturers - General | 1.61 | 100 | 8.05 | -17.86% |
| MNPR | Monopar | | Biotechnology | 0.94 | 95 | 8.02 | 173.26% |
| ATXI | Avenue | | Biotechnology | 3.71 | 83 | 7.85 | NA |
| TNGX | Tango | | Biotechnology | 8.93 | 95 | 6.44 | -9.80% |
| VERO | Venus Concept | | Equipment | 0.94 | 63 | 6.21 | -20.68% |
| BCLI | Brainstorm Cell | | Biotechnology | 0.47 | 42 | 6.03 | 72.05% |
| EXAI | Exscientia | | Biotechnology | 5.03 | 25 | 5.67 | -22.26% |
| AUPH | Aurinia | | Biotechnology | 5.65 | 100 | 5.61 | -37.15% |
| BYSI | BeyondSpring | | Biotechnology | 2.64 | 44 | 5.60 | 193.33% |
| ADCT | ADC | | Biotechnology | 3.30 | 25 | 4.43 | 98.80% |
| SAGE | Sage | | Biotechnology | 12.00 | 74 | 4.35 | -44.62% |
| INSM | Insmed | | Biotechnology | 63.92 | 83 | 3.72 | 106.26% |
| DERM | Dermira | | Biotechnology | 5.57 | 63 | 3.72 | -3.30% |
| SMMT | Summit | | Biotechnology | 8.39 | 90 | 3.71 | 221.46% |
| PHAT | Phathom | | Biotechnology | 11.35 | 100 | 3.65 | 24.32% |
| PHVS | Pharvaris N.V | | Biotechnology | 18.76 | 42 | 3.65 | -33.77% |
| SYRS | Syros | | Biotechnology | 6.00 | 90 | 3.45 | -22.98% |
| OSUR | OraSure Technologies | | Instruments | 4.42 | 20 | 3.03 | -46.10% |
| For chart view version of above stock list: Chart View ➞ 0 - 25 , 25 - 50 , 50 - 75 , 75 - 100 , 100 - 125 , 125 - 150 , 150 - 175 , 175 - 200 , 200 - 225 , 225 - 250 , 250 - 275 , 275 - 300 , 300 - 325 , 325 - 350 , 350 - 375 , 375 - 400 , 400 - 425 , 425 - 450 , 450 - 475 , 475 - 500 , 500 - 525 , 525 - 550 , 550 - 575 , 575 - 600 , 600 - 625 , 625 - 650 | ||
 | Click To Change The Sort Order: By Market Cap or Company Size Performance: Year-to-date, Week and Day |  |
|
Get the most comprehensive stock market coverage daily at 12Stocks.com ➞ Best Stocks Today ➞ Best Stocks Weekly ➞ Best Stocks Year-to-Date ➞ Best Stocks Trends ➞  Best Stocks Today 12Stocks.com Best Nasdaq Stocks ➞ Best S&P 500 Stocks ➞ Best Tech Stocks ➞ Best Biotech Stocks ➞ |
| Detailed Overview of Healthcare Stocks |
| Healthcare Technical Overview, Leaders & Laggards, Top Healthcare ETF Funds & Detailed Healthcare Stocks List, Charts, Trends & More |
| Healthcare Sector: Technical Analysis, Trends & YTD Performance | |
| Healthcare sector is composed of stocks
from pharmaceutical, biotech, diagnostics labs, insurance providers
and healthcare services. Healthcare sector, as represented by XLV, an exchange-traded fund [ETF] that holds basket of Healthcare stocks (e.g, Merck, Amgen) is up by 6.97% and is currently underperforming the overall market by -5.45% year-to-date. Below is a quick view of Technical charts and trends: |
|
 XLV Weekly Chart |
|
| Long Term Trend: Deteriorating | |
| Medium Term Trend: Very Good | |
 XLV Daily Chart |
|
| Short Term Trend: Not Good | |
| Overall Trend Score: 50 | |
| YTD Performance: 6.97% | |
| **Trend Scores & Views Are Only For Educational Purposes And Not For Investing | |
| 12Stocks.com: Top Performing Healthcare Sector Stocks | ||||||||||||||||||||||||||||||||||||||||||||||||
 The top performing Healthcare sector stocks year to date are
Now, more recently, over last week, the top performing Healthcare sector stocks on the move are


|
||||||||||||||||||||||||||||||||||||||||||||||||
| 12Stocks.com: Investing in Healthcare Sector using Exchange Traded Funds | |
|
The following table shows list of key exchange traded funds (ETF) that
help investors track Healthcare Index. For detailed view, check out our ETF Funds section of our website. Quick View: Move mouse or cursor over ETF symbol (ticker) to view short-term Technical chart and over ETF name to view long term chart. Click on ticker or stock name for detailed view. Click on to add stock symbol to your watchlist and to view watchlist. |
12Stocks.com List of ETFs that track Healthcare Index
| Ticker | ETF Name | Watchlist | Recent Price | Smart Investing & Trading Score | Change % | Week % | Year-to-date % |
| XLV | Health Care | | 145.88 | 50 | -0.03 | -0.38 | 6.97% |
| XBI | Biotech | | 91.75 | 37 | -2.21 | -0.04 | 2.76% |
| IBB | Biotechnology | | 136.45 | 55 | -0.64 | -0.2 | 0.44% |
| BBH | Biotech | | 166.85 | 50 | -0.37 | -0.81 | 0.93% |
| VHT | Health Care | | 265.99 | 50 | -0.15 | -0.48 | 6.1% |
| IYH | Healthcare | | 60.93 | 35 | -0.05 | -0.62 | 6.43% |
| IHF | Healthcare Providers | | 52.34 | 15 | -0.34 | -0.11 | -0.32% |
| IHI | Medical Devices | | 55.90 | 25 | 0.11 | -1.25 | 3.58% |
| BIB | Biotechnology | | 58.17 | 68 | -2.30 | -1.41 | 1.96% |
| BIS | Short Biotech | | 17.07 | 25 | 1.40 | 1.28 | -5.51% |
| XHE | Health Care Equipment | | 84.42 | 18 | -0.79 | -1.29 | 0.19% |
| CURE | Healthcare Bull 3X | | 116.75 | 35 | -0.14 | -2.6 | 14.75% |
| LABU | Biotech Bull 3X | | 110.90 | 25 | -6.86 | -0.65 | -9.08% |
| LABD | Biotech Bear 3X | | 7.67 | 68 | 6.82 | -0.13 | -20.85% |
| PSCH | SmallCap Health Care | | 41.67 | 10 | -1.51 | -2.71 | -2.64% |
| XHS | Health Care Services | | 90.53 | 13 | -1.60 | -1.49 | 1.78% |
| PTH | DWA Healthcare Momentum | | 43.61 | 80 | 0.00 | 3.59 | 11.42% |
| BTEC | Principal Healthcare Innovators | | 37.05 | 52 | 0.00 | 1.89 | 1.98% |
| RXL | Health Care | | 101.54 | 42 | -0.47 | -1.05 | 11.09% |
| RXD | Short Health Care | | 10.81 | 81 | 1.50 | 2.12 | -9.35% |
| 12Stocks.com: Charts, Trends, Fundamental Data and Performances of Healthcare Stocks | |
|
We now take in-depth look at all Healthcare stocks including charts, multi-period performances and overall trends (as measured by Smart Investing & Trading Score). One can sort Healthcare stocks (click link to choose) by Daily, Weekly and by Year-to-Date performances. Also, one can sort by size of the company or by market capitalization. |
| Select Your Default Chart Type: | |||||
| |||||
| Click on stock symbol or name for detailed view. Click on to add stock symbol to your watchlist and to view watchlist. Quick View: Move mouse or cursor over "Daily" to quickly view daily Technical stock chart and over "Weekly" to view weekly Technical stock chart. | |||||

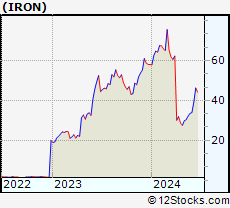 | IRON Disc Medicine Opco Inc |
| Sector: Health Care | |
| SubSector: Biotechnology | |
| MarketCap: 1100 Millions | |
| Recent Price: 46.27 Smart Investing & Trading Score: 64 | |
| Day Percent Change: 18.16% Day Change: 7.11 | |
| Week Change: 18.28% Year-to-date Change: -20.2% | |
| IRON Links: Profile News Message Board | |
| Charts:- Daily , Weekly | |
| Add IRON to Watchlist: View: Get Complete IRON Trend Analysis ➞ | |
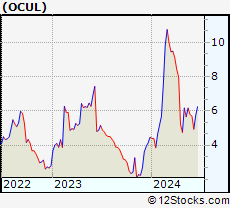 | OCUL Ocular Therapeutix, Inc. |
| Sector: Health Care | |
| SubSector: Biotechnology | |
| MarketCap: 249.985 Millions | |
| Recent Price: 5.75 Smart Investing & Trading Score: 42 | |
| Day Percent Change: 14.09% Day Change: 0.71 | |
| Week Change: 16.4% Year-to-date Change: 28.9% | |
| OCUL Links: Profile News Message Board | |
| Charts:- Daily , Weekly | |
| Add OCUL to Watchlist: View: Get Complete OCUL Trend Analysis ➞ | |
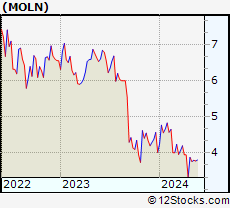 | MOLN Molecular Partners AG |
| Sector: Health Care | |
| SubSector: Biotechnology | |
| MarketCap: 216 Millions | |
| Recent Price: 6.77 Smart Investing & Trading Score: 100 | |
| Day Percent Change: 13.78% Day Change: 0.82 | |
| Week Change: 66.34% Year-to-date Change: 68.6% | |
| MOLN Links: Profile News Message Board | |
| Charts:- Daily , Weekly | |
| Add MOLN to Watchlist: View: Get Complete MOLN Trend Analysis ➞ | |
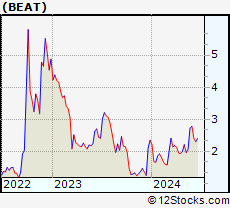 | BEAT BioTelemetry, Inc. |
| Sector: Health Care | |
| SubSector: Medical Laboratories & Research | |
| MarketCap: 1161.9 Millions | |
| Recent Price: 2.30 Smart Investing & Trading Score: 63 | |
| Day Percent Change: 12.75% Day Change: 0.26 | |
| Week Change: -4.96% Year-to-date Change: -2.1% | |
| BEAT Links: Profile News Message Board | |
| Charts:- Daily , Weekly | |
| Add BEAT to Watchlist: View: Get Complete BEAT Trend Analysis ➞ | |
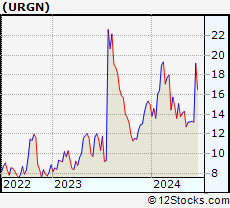 | URGN UroGen Pharma Ltd. |
| Sector: Health Care | |
| SubSector: Biotechnology | |
| MarketCap: 373.485 Millions | |
| Recent Price: 19.20 Smart Investing & Trading Score: 100 | |
| Day Percent Change: 9.84% Day Change: 1.72 | |
| Week Change: 45.34% Year-to-date Change: 28.0% | |
| URGN Links: Profile News Message Board | |
| Charts:- Daily , Weekly | |
| Add URGN to Watchlist: View: Get Complete URGN Trend Analysis ➞ | |
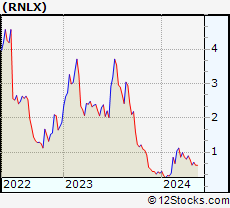 | RNLX Renalytix AI plc |
| Sector: Health Care | |
| SubSector: Diagnostics & Research | |
| MarketCap: 45487 Millions | |
| Recent Price: 0.51 Smart Investing & Trading Score: 69 | |
| Day Percent Change: 9.67% Day Change: 0.04 | |
| Week Change: 12.62% Year-to-date Change: 29.9% | |
| RNLX Links: Profile News Message Board | |
| Charts:- Daily , Weekly | |
| Add RNLX to Watchlist: View: Get Complete RNLX Trend Analysis ➞ | |
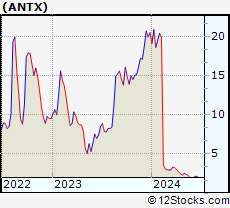 | ANTX AN2 Therapeutics, Inc. |
| Sector: Health Care | |
| SubSector: Biotechnology | |
| MarketCap: 163 Millions | |
| Recent Price: 2.17 Smart Investing & Trading Score: 64 | |
| Day Percent Change: 9.05% Day Change: 0.18 | |
| Week Change: 6.9% Year-to-date Change: -89.4% | |
| ANTX Links: Profile News Message Board | |
| Charts:- Daily , Weekly | |
| Add ANTX to Watchlist: View: Get Complete ANTX Trend Analysis ➞ | |
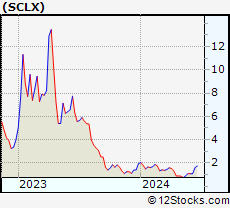 | SCLX Scilex Holding Company |
| Sector: Health Care | |
| SubSector: Drug Manufacturers - General | |
| MarketCap: 927 Millions | |
| Recent Price: 1.61 Smart Investing & Trading Score: 100 | |
| Day Percent Change: 8.05% Day Change: 0.12 | |
| Week Change: 47.71% Year-to-date Change: -17.9% | |
| SCLX Links: Profile News Message Board | |
| Charts:- Daily , Weekly | |
| Add SCLX to Watchlist: View: Get Complete SCLX Trend Analysis ➞ | |
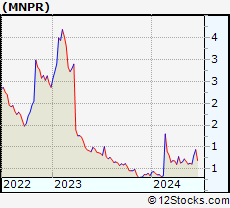 | MNPR Monopar Therapeutics Inc. |
| Sector: Health Care | |
| SubSector: Biotechnology | |
| MarketCap: 71487 Millions | |
| Recent Price: 0.94 Smart Investing & Trading Score: 95 | |
| Day Percent Change: 8.02% Day Change: 0.07 | |
| Week Change: 15.91% Year-to-date Change: 173.3% | |
| MNPR Links: Profile News Message Board | |
| Charts:- Daily , Weekly | |
| Add MNPR to Watchlist: View: Get Complete MNPR Trend Analysis ➞ | |
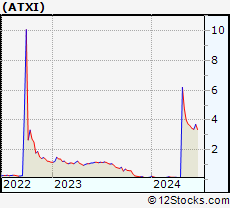 | ATXI Avenue Therapeutics, Inc. |
| Sector: Health Care | |
| SubSector: Biotechnology | |
| MarketCap: 118.185 Millions | |
| Recent Price: 3.71 Smart Investing & Trading Score: 83 | |
| Day Percent Change: 7.85% Day Change: 0.27 | |
| Week Change: 9.76% Year-to-date Change: 2,204.4% | |
| ATXI Links: Profile News Message Board | |
| Charts:- Daily , Weekly | |
| Add ATXI to Watchlist: View: Get Complete ATXI Trend Analysis ➞ | |
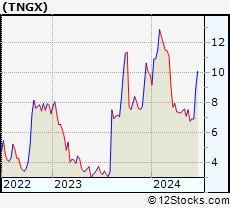 | TNGX Tango Therapeutics, Inc. |
| Sector: Health Care | |
| SubSector: Biotechnology | |
| MarketCap: 302 Millions | |
| Recent Price: 8.93 Smart Investing & Trading Score: 95 | |
| Day Percent Change: 6.44% Day Change: 0.54 | |
| Week Change: 29.42% Year-to-date Change: -9.8% | |
| TNGX Links: Profile News Message Board | |
| Charts:- Daily , Weekly | |
| Add TNGX to Watchlist: View: Get Complete TNGX Trend Analysis ➞ | |
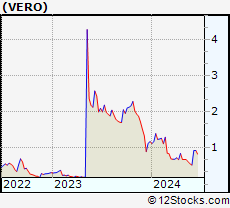 | VERO Venus Concept Inc. |
| Sector: Health Care | |
| SubSector: Medical Appliances & Equipment | |
| MarketCap: 101.08 Millions | |
| Recent Price: 0.94 Smart Investing & Trading Score: 63 | |
| Day Percent Change: 6.21% Day Change: 0.05 | |
| Week Change: 0.65% Year-to-date Change: -20.7% | |
| VERO Links: Profile News Message Board | |
| Charts:- Daily , Weekly | |
| Add VERO to Watchlist: View: Get Complete VERO Trend Analysis ➞ | |
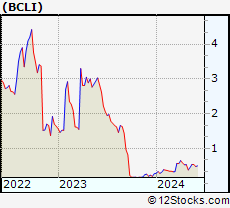 | BCLI Brainstorm Cell Therapeutics Inc. |
| Sector: Health Care | |
| SubSector: Biotechnology | |
| MarketCap: 141.285 Millions | |
| Recent Price: 0.47 Smart Investing & Trading Score: 42 | |
| Day Percent Change: 6.03% Day Change: 0.03 | |
| Week Change: 11.83% Year-to-date Change: 72.1% | |
| BCLI Links: Profile News Message Board | |
| Charts:- Daily , Weekly | |
| Add BCLI to Watchlist: View: Get Complete BCLI Trend Analysis ➞ | |
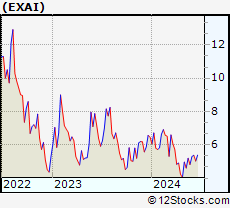 | EXAI Exscientia plc |
| Sector: Health Care | |
| SubSector: Biotechnology | |
| MarketCap: 796 Millions | |
| Recent Price: 5.03 Smart Investing & Trading Score: 25 | |
| Day Percent Change: 5.67% Day Change: 0.27 | |
| Week Change: -6.51% Year-to-date Change: -22.3% | |
| EXAI Links: Profile News Message Board | |
| Charts:- Daily , Weekly | |
| Add EXAI to Watchlist: View: Get Complete EXAI Trend Analysis ➞ | |
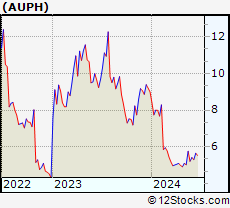 | AUPH Aurinia Pharmaceuticals Inc. |
| Sector: Health Care | |
| SubSector: Biotechnology | |
| MarketCap: 1319.75 Millions | |
| Recent Price: 5.65 Smart Investing & Trading Score: 100 | |
| Day Percent Change: 5.61% Day Change: 0.30 | |
| Week Change: 6.6% Year-to-date Change: -37.2% | |
| AUPH Links: Profile News Message Board | |
| Charts:- Daily , Weekly | |
| Add AUPH to Watchlist: View: Get Complete AUPH Trend Analysis ➞ | |
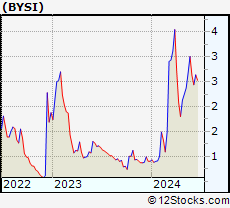 | BYSI BeyondSpring Inc. |
| Sector: Health Care | |
| SubSector: Biotechnology | |
| MarketCap: 432.785 Millions | |
| Recent Price: 2.64 Smart Investing & Trading Score: 44 | |
| Day Percent Change: 5.60% Day Change: 0.14 | |
| Week Change: 8.2% Year-to-date Change: 193.3% | |
| BYSI Links: Profile News Message Board | |
| Charts:- Daily , Weekly | |
| Add BYSI to Watchlist: View: Get Complete BYSI Trend Analysis ➞ | |
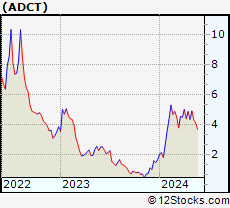 | ADCT ADC Therapeutics SA |
| Sector: Health Care | |
| SubSector: Biotechnology | |
| MarketCap: 26087 Millions | |
| Recent Price: 3.30 Smart Investing & Trading Score: 25 | |
| Day Percent Change: 4.43% Day Change: 0.14 | |
| Week Change: -3.51% Year-to-date Change: 98.8% | |
| ADCT Links: Profile News Message Board | |
| Charts:- Daily , Weekly | |
| Add ADCT to Watchlist: View: Get Complete ADCT Trend Analysis ➞ | |
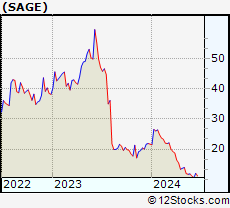 | SAGE Sage Therapeutics, Inc. |
| Sector: Health Care | |
| SubSector: Biotechnology | |
| MarketCap: 1683.75 Millions | |
| Recent Price: 12.00 Smart Investing & Trading Score: 74 | |
| Day Percent Change: 4.35% Day Change: 0.50 | |
| Week Change: 13.42% Year-to-date Change: -44.6% | |
| SAGE Links: Profile News Message Board | |
| Charts:- Daily , Weekly | |
| Add SAGE to Watchlist: View: Get Complete SAGE Trend Analysis ➞ | |
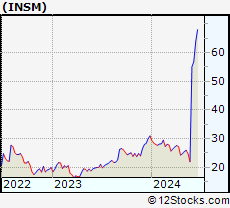 | INSM Insmed Incorporated |
| Sector: Health Care | |
| SubSector: Biotechnology | |
| MarketCap: 1452.45 Millions | |
| Recent Price: 63.92 Smart Investing & Trading Score: 83 | |
| Day Percent Change: 3.72% Day Change: 2.29 | |
| Week Change: 12.44% Year-to-date Change: 106.3% | |
| INSM Links: Profile News Message Board | |
| Charts:- Daily , Weekly | |
| Add INSM to Watchlist: View: Get Complete INSM Trend Analysis ➞ | |
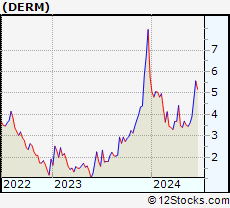 | DERM Dermira, Inc. |
| Sector: Health Care | |
| SubSector: Biotechnology | |
| MarketCap: 1312.25 Millions | |
| Recent Price: 5.57 Smart Investing & Trading Score: 63 | |
| Day Percent Change: 3.72% Day Change: 0.20 | |
| Week Change: 18.51% Year-to-date Change: -3.3% | |
| DERM Links: Profile News Message Board | |
| Charts:- Daily , Weekly | |
| Add DERM to Watchlist: View: Get Complete DERM Trend Analysis ➞ | |
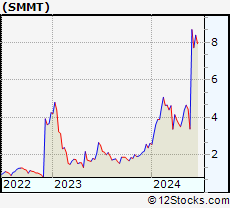 | SMMT Summit Therapeutics plc |
| Sector: Health Care | |
| SubSector: Biotechnology | |
| MarketCap: 156.985 Millions | |
| Recent Price: 8.39 Smart Investing & Trading Score: 90 | |
| Day Percent Change: 3.71% Day Change: 0.30 | |
| Week Change: 8.68% Year-to-date Change: 221.5% | |
| SMMT Links: Profile News Message Board | |
| Charts:- Daily , Weekly | |
| Add SMMT to Watchlist: View: Get Complete SMMT Trend Analysis ➞ | |
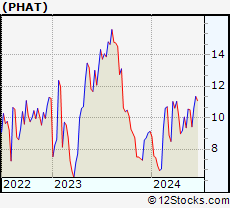 | PHAT Phathom Pharmaceuticals, Inc. |
| Sector: Health Care | |
| SubSector: Biotechnology | |
| MarketCap: 728.785 Millions | |
| Recent Price: 11.35 Smart Investing & Trading Score: 100 | |
| Day Percent Change: 3.65% Day Change: 0.40 | |
| Week Change: 7.08% Year-to-date Change: 24.3% | |
| PHAT Links: Profile News Message Board | |
| Charts:- Daily , Weekly | |
| Add PHAT to Watchlist: View: Get Complete PHAT Trend Analysis ➞ | |
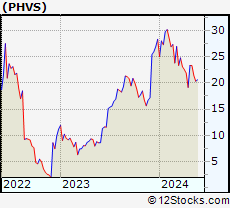 | PHVS Pharvaris N.V. |
| Sector: Health Care | |
| SubSector: Biotechnology | |
| MarketCap: 475 Millions | |
| Recent Price: 18.76 Smart Investing & Trading Score: 42 | |
| Day Percent Change: 3.65% Day Change: 0.66 | |
| Week Change: 19.72% Year-to-date Change: -33.8% | |
| PHVS Links: Profile News Message Board | |
| Charts:- Daily , Weekly | |
| Add PHVS to Watchlist: View: Get Complete PHVS Trend Analysis ➞ | |
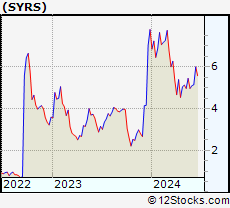 | SYRS Syros Pharmaceuticals, Inc. |
| Sector: Health Care | |
| SubSector: Biotechnology | |
| MarketCap: 275.485 Millions | |
| Recent Price: 6.00 Smart Investing & Trading Score: 90 | |
| Day Percent Change: 3.45% Day Change: 0.20 | |
| Week Change: 16.5% Year-to-date Change: -23.0% | |
| SYRS Links: Profile News Message Board | |
| Charts:- Daily , Weekly | |
| Add SYRS to Watchlist: View: Get Complete SYRS Trend Analysis ➞ | |
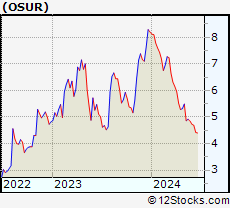 | OSUR OraSure Technologies, Inc. |
| Sector: Health Care | |
| SubSector: Medical Instruments & Supplies | |
| MarketCap: 468.26 Millions | |
| Recent Price: 4.42 Smart Investing & Trading Score: 20 | |
| Day Percent Change: 3.03% Day Change: 0.13 | |
| Week Change: -5.76% Year-to-date Change: -46.1% | |
| OSUR Links: Profile News Message Board | |
| Charts:- Daily , Weekly | |
| Add OSUR to Watchlist: View: Get Complete OSUR Trend Analysis ➞ | |
| For tabular summary view of above stock list: Summary View ➞ 0 - 25 , 25 - 50 , 50 - 75 , 75 - 100 , 100 - 125 , 125 - 150 , 150 - 175 , 175 - 200 , 200 - 225 , 225 - 250 , 250 - 275 , 275 - 300 , 300 - 325 , 325 - 350 , 350 - 375 , 375 - 400 , 400 - 425 , 425 - 450 , 450 - 475 , 475 - 500 , 500 - 525 , 525 - 550 , 550 - 575 , 575 - 600 , 600 - 625 , 625 - 650 | ||
| Click To Change The Sort Order: By Market Cap or Company Size Performance: Year-to-date, Week and Day | |
| Select Chart Type: | ||
|
Best Stocks Today 12Stocks.com |
© 2024 12Stocks.com Terms & Conditions Privacy Contact Us
All Information Provided Only For Education And Not To Be Used For Investing or Trading. See Terms & Conditions


One More Thing ... Get Best Stocks Delivered Daily!
Never Ever Miss A Move With Our Top Ten Stocks Lists
Find Best Stocks In Any Market - Bull or Bear Market
Take A Peek At Our Top Ten Stocks Lists: Daily, Weekly, Year-to-Date & Top Trends
Find Best Stocks In Any Market - Bull or Bear Market
Take A Peek At Our Top Ten Stocks Lists: Daily, Weekly, Year-to-Date & Top Trends
Healthcare Stocks With Best Up Trends [0-bearish to 100-bullish]: Molecular Partners[100], UroGen Pharma[100], Scilex Holding[100], Aurinia [100], Phathom [100], Terns [100], Anika [100], Regeneron [100], Alnylam [100], United [100], Avidity Biosciences[100]
Best Healthcare Stocks Year-to-Date:
Pieris [5498.9%], Precision BioSciences[2946.58%], Avenue [2204.35%], Vicarious Surgical[2113.74%], Assembly Biosciences[1776.6%], Agenus [1767.38%], Inovio [1682.35%], Aurora Cannabis[1105.38%], Affimed N.V[1040.8%], GeneDx [958.09%], NuCana [914.2%] Best Healthcare Stocks This Week:
Vicarious Surgical[2323.88%], Molecular Partners[66.34%], Avidity Biosciences[49.02%], Scilex Holding[47.71%], Kronos Bio[45.45%], UroGen Pharma[45.34%], Biomea Fusion[36.23%], Tango [29.42%], vTv [22.92%], Biodesix [20.3%], Pharvaris N.V[19.72%] Best Healthcare Stocks Daily:
Disc Medicine[18.16%], Ocular Therapeutix[14.09%], Molecular Partners[13.78%], BioTelemetry [12.75%], UroGen Pharma[9.84%], Renalytix AI[9.67%], AN2 [9.05%], Scilex Holding[8.05%], Monopar [8.02%], Avenue [7.85%], Tango [6.44%]