
 Login Sign Up


| |||||
 |  | ||||

| 12Stocks.com Market Intelligence |
Best Financial Stocks
| In a hurry? Financial Stocks Lists: Performance Trends Table, Stock Charts
Sort Financial stocks: Daily, Weekly, Year-to-Date, Market Cap & Trends. Filter Financial stocks list by size:All Financial Large Mid-Range Small & MicroCap |
| 12Stocks.com Financial Stocks Performances & Trends Daily | |||||||||
|
|  The overall Smart Investing & Trading Score is 78 (0-bearish to 100-bullish) which puts Financial sector in short term neutral to bullish trend. The Smart Investing & Trading Score from previous trading session is 46 and hence an improvement of trend.
| ||||||||
Here are the Smart Investing & Trading Scores of the most requested Financial stocks at 12Stocks.com (click stock name for detailed review):
|


| 12Stocks.com: Investing in Financial sector with Stocks | |
|
The following table helps investors and traders sort through current performance and trends (as measured by Smart Investing & Trading Score) of various
stocks in the Financial sector. Quick View: Move mouse or cursor over stock symbol (ticker) to view short-term Technical chart and over stock name to view long term chart. Click on  to add stock symbol to your watchlist and to add stock symbol to your watchlist and  to view watchlist. Click on any ticker or stock name for detailed market intelligence report for that stock. to view watchlist. Click on any ticker or stock name for detailed market intelligence report for that stock. |
12Stocks.com Performance of Stocks in Financial Sector
| Ticker | Stock Name | Watchlist | Category | Recent Price | Trend Score | Change % | YTD Change% |
| CNS | Cohen & Steers |   | Asset Mgmt | 70.29 | 40 | 2.79% | -7.18% |
| ASG | Liberty All-Star | | Closed-End Fund - Equity | 5.23 | 40 | 0.97% | -0.95% |
| CG | Carlyle | | Asset Mgmt | 42.96 | 40 | 0.82% | 5.58% |
| ACGLN | Arch Capital | | Insurance - | 19.54 | 40 | 0.21% | -3.41% |
| TPL | Texas Pacific | | Real Estatet | 614.31 | 40 | -0.04% | -60.93% |
| EZPW | EZCORP | | Credit Services | 10.49 | 39 | 1.94% | 20.02% |
| SFST | Southern First | | Banks | 27.47 | 39 | 0.59% | -25.96% |
| IBTE | iShares iBonds | | Exchange Traded Fund | 23.97 | 39 | 0.04% | 0.44% |
| SPSK | SP Funds | | Exchange Traded Fund | 17.63 | 38 | 0.00% | -1.56% |
| TREE | LendingTree | | Mortgage | 42.99 | 38 | -3.39% | 41.79% |
| MPV | Barings Participation | | Closed-End Fund - Debt | 15.33 | 38 | -3.37% | -1.73% |
| HIPO | Hippo | | Insurance - Specialty | 17.64 | 38 | -2.49% | 93.63% |
| SIXS | 6 Meridian | | Exchange Traded Fund | 46.32 | 38 | 1.16% | -2.05% |
| COF | Capital One | | Credit Services | 137.63 | 38 | 1.06% | 4.96% |
| HOMB | Home Bancshares | | Banks | 23.52 | 38 | 0.90% | -7.15% |
| MHF | Western Asset | | Closed-End Fund - Debt | 6.59 | 38 | 0.63% | 2.65% |
| JQC | Nuveen Credit | | Closed-End Fund - Debt | 5.57 | 38 | 0.54% | 6.70% |
| SKGR | SK Growth | | SPAC | 11.11 | 38 | 0.27% | 2.78% |
| MPA | BlackRock MuniYield | | Closed-End Fund - Debt | 11.88 | 38 | 0.25% | 2.15% |
| FNF | Fidelity National | | Insurance | 50.36 | 38 | 0.20% | -1.29% |
| XHR | Xenia Hotels | | REIT | 14.49 | 37 | 2.33% | 6.39% |
| NFBK | Northfield Bancorp | | Regional Banks | 8.86 | 37 | 1.96% | -29.57% |
| ALX | Alexander s | | REIT - Retail | 212.20 | 37 | 1.05% | -0.64% |
| NWBI | Northwest Bancshares | | S&L | 10.95 | 37 | 0.55% | -12.26% |
| MUE | BlackRock Muni | | Closed-End Fund - Debt | 9.81 | 37 | 0.51% | -2.10% |
| For chart view version of above stock list: Chart View ➞ 0 - 25 , 25 - 50 , 50 - 75 , 75 - 100 , 100 - 125 , 125 - 150 , 150 - 175 , 175 - 200 , 200 - 225 , 225 - 250 , 250 - 275 , 275 - 300 , 300 - 325 , 325 - 350 , 350 - 375 , 375 - 400 , 400 - 425 , 425 - 450 , 450 - 475 , 475 - 500 , 500 - 525 , 525 - 550 , 550 - 575 , 575 - 600 , 600 - 625 , 625 - 650 , 650 - 675 , 675 - 700 , 700 - 725 , 725 - 750 , 750 - 775 , 775 - 800 , 800 - 825 , 825 - 850 , 850 - 875 , 875 - 900 , 900 - 925 , 925 - 950 , 950 - 975 , 975 - 1000 , 1000 - 1025 , 1025 - 1050 , 1050 - 1075 , 1075 - 1100 , 1100 - 1125 , 1125 - 1150 , 1150 - 1175 , 1175 - 1200 , 1200 - 1225 | ||
 | Click To Change The Sort Order: By Market Cap or Company Size Performance: Year-to-date, Week and Day |  |
|
Get the most comprehensive stock market coverage daily at 12Stocks.com ➞ Best Stocks Today ➞ Best Stocks Weekly ➞ Best Stocks Year-to-Date ➞ Best Stocks Trends ➞  Best Stocks Today 12Stocks.com Best Nasdaq Stocks ➞ Best S&P 500 Stocks ➞ Best Tech Stocks ➞ Best Biotech Stocks ➞ |
| Detailed Overview of Financial Stocks |
| Financial Technical Overview, Leaders & Laggards, Top Financial ETF Funds & Detailed Financial Stocks List, Charts, Trends & More |
| Financial Sector: Technical Analysis, Trends & YTD Performance | |
| Financial sector is composed of stocks
from banks, brokers, insurance, REITs
and services subsectors. Financial sector, as represented by XLF, an exchange-traded fund [ETF] that holds basket of Financial stocks (e.g, Bank of America, Goldman Sachs) is up by 10.74% and is currently outperforming the overall market by 0.95% year-to-date. Below is a quick view of Technical charts and trends: |
|
 XLF Weekly Chart |
|
| Long Term Trend: Very Good | |
| Medium Term Trend: Good | |
 XLF Daily Chart |
|
| Short Term Trend: Very Good | |
| Overall Trend Score: 78 | |
| YTD Performance: 10.74% | |
| **Trend Scores & Views Are Only For Educational Purposes And Not For Investing | |
| 12Stocks.com: Top Performing Financial Sector Stocks | ||||||||||||||||||||||||||||||||||||||||||||||||
 The top performing Financial sector stocks year to date are
Now, more recently, over last week, the top performing Financial sector stocks on the move are


|
||||||||||||||||||||||||||||||||||||||||||||||||
| 12Stocks.com: Investing in Financial Sector using Exchange Traded Funds | |
|
The following table shows list of key exchange traded funds (ETF) that
help investors track Financial Index. For detailed view, check out our ETF Funds section of our website. Quick View: Move mouse or cursor over ETF symbol (ticker) to view short-term Technical chart and over ETF name to view long term chart. Click on ticker or stock name for detailed view. Click on to add stock symbol to your watchlist and to view watchlist. |
12Stocks.com List of ETFs that track Financial Index
| Ticker | ETF Name | Watchlist | Recent Price | Smart Investing & Trading Score | Change % | Week % | Year-to-date % |
| XLF | Financial | | 41.64 | 78 | 1.46 | 0.07 | 10.74% |
| IAI | Broker-Dealers & Secs | | 116.64 | 58 | 0.53 | -1.91 | 7.47% |
| IYF | Financials | | 95.25 | 78 | 1.32 | 0.03 | 11.52% |
| IYG | Financial Services | | 65.74 | 71 | 1.14 | -0.33 | 10.05% |
| KRE | Regional Banking | | 48.85 | 61 | 1.41 | -0.14 | -6.83% |
| IXG | Global Financials | | 87.05 | 76 | 0.80 | -0.54 | 10.77% |
| VFH | Financials | | 101.01 | 78 | 1.28 | -0.12 | 9.48% |
| KBE | Bank | | 46.23 | 68 | 1.34 | 0 | 0.46% |
| FAS | Financial Bull 3X | | 105.34 | 78 | 4.16 | -0.02 | 27.45% |
| FAZ | Financial Bear 3X | | 10.35 | 17 | -4.08 | -0.1 | -24.29% |
| UYG | Financials | | 65.65 | 78 | 3.19 | -0.03 | 18.93% |
| IAT | Regional Banks | | 41.90 | 68 | 1.87 | 0 | 0.14% |
| KIE | Insurance | | 51.16 | 78 | 1.11 | 0.69 | 13.14% |
| PSCF | SmallCap Financials | | 47.14 | 53 | 1.59 | -0.79 | -4.14% |
| EUFN | Europe Financials | | 24.18 | 100 | 1.02 | 0.71 | 15.36% |
| PGF | Financial Preferred | | 14.79 | 55 | 1.09 | 0.68 | 1.44% |
| 12Stocks.com: Charts, Trends, Fundamental Data and Performances of Financial Stocks | |
|
We now take in-depth look at all Financial stocks including charts, multi-period performances and overall trends (as measured by Smart Investing & Trading Score). One can sort Financial stocks (click link to choose) by Daily, Weekly and by Year-to-Date performances. Also, one can sort by size of the company or by market capitalization. |
| Select Your Default Chart Type: | |||||
| |||||
| Click on stock symbol or name for detailed view. Click on to add stock symbol to your watchlist and to view watchlist. Quick View: Move mouse or cursor over "Daily" to quickly view daily Technical stock chart and over "Weekly" to view weekly Technical stock chart. | |||||

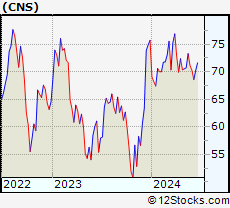 | CNS Cohen & Steers, Inc. |
| Sector: Financials | |
| SubSector: Asset Management | |
| MarketCap: 2082.43 Millions | |
| Recent Price: 70.29 Smart Investing & Trading Score: 40 | |
| Day Percent Change: 2.79% Day Change: 1.91 | |
| Week Change: -1.19% Year-to-date Change: -7.2% | |
| CNS Links: Profile News Message Board | |
| Charts:- Daily , Weekly | |
| Add CNS to Watchlist: View: Get Complete CNS Trend Analysis ➞ | |
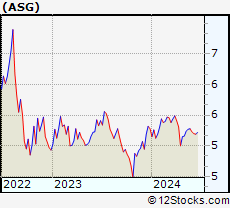 | ASG Liberty All-Star Growth Fund, Inc. |
| Sector: Financials | |
| SubSector: Closed-End Fund - Equity | |
| MarketCap: 167.747 Millions | |
| Recent Price: 5.23 Smart Investing & Trading Score: 40 | |
| Day Percent Change: 0.97% Day Change: 0.05 | |
| Week Change: -0.95% Year-to-date Change: -1.0% | |
| ASG Links: Profile News Message Board | |
| Charts:- Daily , Weekly | |
| Add ASG to Watchlist: View: Get Complete ASG Trend Analysis ➞ | |
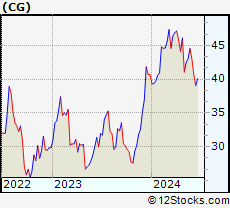 | CG The Carlyle Group Inc. |
| Sector: Financials | |
| SubSector: Asset Management | |
| MarketCap: 7269.33 Millions | |
| Recent Price: 42.96 Smart Investing & Trading Score: 40 | |
| Day Percent Change: 0.82% Day Change: 0.35 | |
| Week Change: -3.57% Year-to-date Change: 5.6% | |
| CG Links: Profile News Message Board | |
| Charts:- Daily , Weekly | |
| Add CG to Watchlist: View: Get Complete CG Trend Analysis ➞ | |
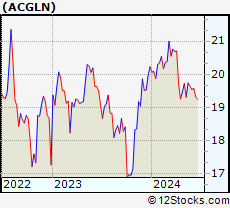 | ACGLN Arch Capital Group Ltd. |
| Sector: Financials | |
| SubSector: Insurance - Diversified | |
| MarketCap: 27880 Millions | |
| Recent Price: 19.54 Smart Investing & Trading Score: 40 | |
| Day Percent Change: 0.21% Day Change: 0.04 | |
| Week Change: -0.51% Year-to-date Change: -3.4% | |
| ACGLN Links: Profile News Message Board | |
| Charts:- Daily , Weekly | |
| Add ACGLN to Watchlist: View: Get Complete ACGLN Trend Analysis ➞ | |
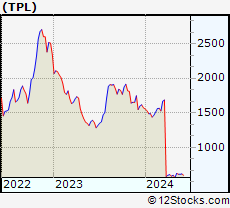 | TPL Texas Pacific Land Trust |
| Sector: Financials | |
| SubSector: Real Estate Development | |
| MarketCap: 3052.29 Millions | |
| Recent Price: 614.31 Smart Investing & Trading Score: 40 | |
| Day Percent Change: -0.04% Day Change: -0.23 | |
| Week Change: 0.5% Year-to-date Change: -60.9% | |
| TPL Links: Profile News Message Board | |
| Charts:- Daily , Weekly | |
| Add TPL to Watchlist: View: Get Complete TPL Trend Analysis ➞ | |
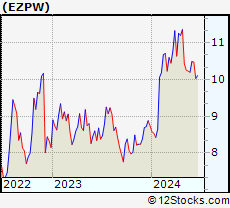 | EZPW EZCORP, Inc. |
| Sector: Financials | |
| SubSector: Credit Services | |
| MarketCap: 236.408 Millions | |
| Recent Price: 10.49 Smart Investing & Trading Score: 39 | |
| Day Percent Change: 1.94% Day Change: 0.20 | |
| Week Change: 2.84% Year-to-date Change: 20.0% | |
| EZPW Links: Profile News Message Board | |
| Charts:- Daily , Weekly | |
| Add EZPW to Watchlist: View: Get Complete EZPW Trend Analysis ➞ | |
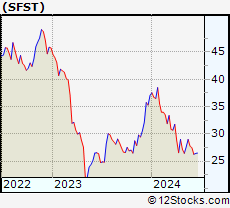 | SFST Southern First Bancshares, Inc. |
| Sector: Financials | |
| SubSector: Money Center Banks | |
| MarketCap: 189.099 Millions | |
| Recent Price: 27.47 Smart Investing & Trading Score: 39 | |
| Day Percent Change: 0.59% Day Change: 0.16 | |
| Week Change: -1.15% Year-to-date Change: -26.0% | |
| SFST Links: Profile News Message Board | |
| Charts:- Daily , Weekly | |
| Add SFST to Watchlist: View: Get Complete SFST Trend Analysis ➞ | |
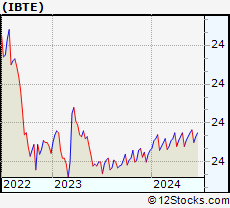 | IBTE iShares iBonds Dec 2024 Term Treasury ETF |
| Sector: Financials | |
| SubSector: Exchange Traded Fund | |
| MarketCap: 60157 Millions | |
| Recent Price: 23.97 Smart Investing & Trading Score: 39 | |
| Day Percent Change: 0.04% Day Change: 0.01 | |
| Week Change: 0.06% Year-to-date Change: 0.4% | |
| IBTE Links: Profile News Message Board | |
| Charts:- Daily , Weekly | |
| Add IBTE to Watchlist: View: Get Complete IBTE Trend Analysis ➞ | |
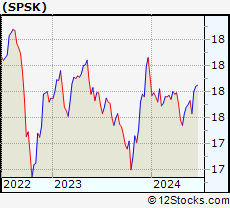 | SPSK SP Funds Dow Jones Global Sukuk ETF |
| Sector: Financials | |
| SubSector: Exchange Traded Fund | |
| MarketCap: 60157 Millions | |
| Recent Price: 17.63 Smart Investing & Trading Score: 38 | |
| Day Percent Change: 0.00% Day Change: 0.00 | |
| Week Change: -0.56% Year-to-date Change: -1.6% | |
| SPSK Links: Profile News Message Board | |
| Charts:- Daily , Weekly | |
| Add SPSK to Watchlist: View: Get Complete SPSK Trend Analysis ➞ | |
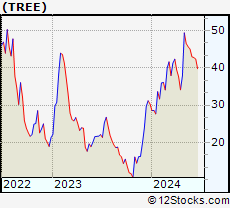 | TREE LendingTree, Inc. |
| Sector: Financials | |
| SubSector: Mortgage Investment | |
| MarketCap: 2745.99 Millions | |
| Recent Price: 42.99 Smart Investing & Trading Score: 38 | |
| Day Percent Change: -3.39% Day Change: -1.51 | |
| Week Change: -4.59% Year-to-date Change: 41.8% | |
| TREE Links: Profile News Message Board | |
| Charts:- Daily , Weekly | |
| Add TREE to Watchlist: View: Get Complete TREE Trend Analysis ➞ | |
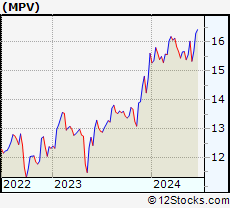 | MPV Barings Participation Investors |
| Sector: Financials | |
| SubSector: Closed-End Fund - Debt | |
| MarketCap: 101.207 Millions | |
| Recent Price: 15.33 Smart Investing & Trading Score: 38 | |
| Day Percent Change: -3.37% Day Change: -0.54 | |
| Week Change: -4.31% Year-to-date Change: -1.7% | |
| MPV Links: Profile News Message Board | |
| Charts:- Daily , Weekly | |
| Add MPV to Watchlist: View: Get Complete MPV Trend Analysis ➞ | |
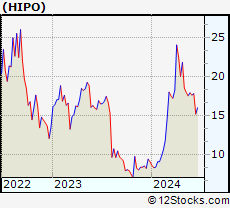 | HIPO Hippo Holdings Inc. |
| Sector: Financials | |
| SubSector: Insurance - Specialty | |
| MarketCap: 377 Millions | |
| Recent Price: 17.64 Smart Investing & Trading Score: 38 | |
| Day Percent Change: -2.49% Day Change: -0.45 | |
| Week Change: -1.56% Year-to-date Change: 93.6% | |
| HIPO Links: Profile News Message Board | |
| Charts:- Daily , Weekly | |
| Add HIPO to Watchlist: View: Get Complete HIPO Trend Analysis ➞ | |
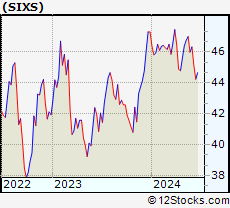 | SIXS 6 Meridian Small Cap Equity ETF |
| Sector: Financials | |
| SubSector: Exchange Traded Fund | |
| MarketCap: 60157 Millions | |
| Recent Price: 46.32 Smart Investing & Trading Score: 38 | |
| Day Percent Change: 1.16% Day Change: 0.53 | |
| Week Change: 0.74% Year-to-date Change: -2.1% | |
| SIXS Links: Profile News Message Board | |
| Charts:- Daily , Weekly | |
| Add SIXS to Watchlist: View: Get Complete SIXS Trend Analysis ➞ | |
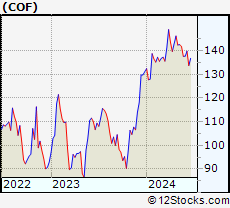 | COF Capital One Financial Corporation |
| Sector: Financials | |
| SubSector: Credit Services | |
| MarketCap: 23094.2 Millions | |
| Recent Price: 137.63 Smart Investing & Trading Score: 38 | |
| Day Percent Change: 1.06% Day Change: 1.45 | |
| Week Change: 0.01% Year-to-date Change: 5.0% | |
| COF Links: Profile News Message Board | |
| Charts:- Daily , Weekly | |
| Add COF to Watchlist: View: Get Complete COF Trend Analysis ➞ | |
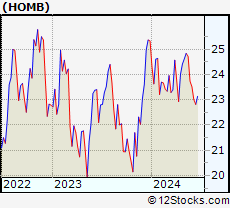 | HOMB Home Bancshares, Inc. (Conway, AR) |
| Sector: Financials | |
| SubSector: Money Center Banks | |
| MarketCap: 2090.49 Millions | |
| Recent Price: 23.52 Smart Investing & Trading Score: 38 | |
| Day Percent Change: 0.90% Day Change: 0.21 | |
| Week Change: -0.93% Year-to-date Change: -7.2% | |
| HOMB Links: Profile News Message Board | |
| Charts:- Daily , Weekly | |
| Add HOMB to Watchlist: View: Get Complete HOMB Trend Analysis ➞ | |
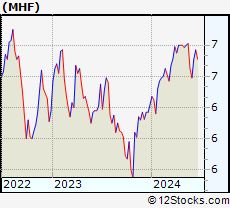 | MHF Western Asset Municipal High Income Fund Inc. |
| Sector: Financials | |
| SubSector: Closed-End Fund - Debt | |
| MarketCap: 139.107 Millions | |
| Recent Price: 6.59 Smart Investing & Trading Score: 38 | |
| Day Percent Change: 0.63% Day Change: 0.04 | |
| Week Change: -0.9% Year-to-date Change: 2.7% | |
| MHF Links: Profile News Message Board | |
| Charts:- Daily , Weekly | |
| Add MHF to Watchlist: View: Get Complete MHF Trend Analysis ➞ | |
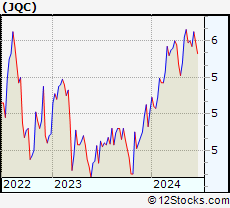 | JQC Nuveen Credit Strategies Income Fund |
| Sector: Financials | |
| SubSector: Closed-End Fund - Debt | |
| MarketCap: 638.707 Millions | |
| Recent Price: 5.57 Smart Investing & Trading Score: 38 | |
| Day Percent Change: 0.54% Day Change: 0.03 | |
| Week Change: -0.54% Year-to-date Change: 6.7% | |
| JQC Links: Profile News Message Board | |
| Charts:- Daily , Weekly | |
| Add JQC to Watchlist: View: Get Complete JQC Trend Analysis ➞ | |
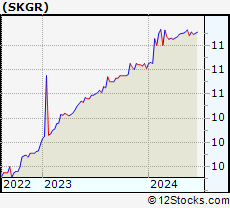 | SKGR SK Growth Opportunities Corporation |
| Sector: Financials | |
| SubSector: SPAC | |
| MarketCap: 277 Millions | |
| Recent Price: 11.11 Smart Investing & Trading Score: 38 | |
| Day Percent Change: 0.27% Day Change: 0.03 | |
| Week Change: 0.27% Year-to-date Change: 2.8% | |
| SKGR Links: Profile News Message Board | |
| Charts:- Daily , Weekly | |
| Add SKGR to Watchlist: View: Get Complete SKGR Trend Analysis ➞ | |
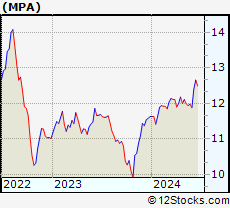 | MPA BlackRock MuniYield Pennsylvania Quality Fund |
| Sector: Financials | |
| SubSector: Closed-End Fund - Debt | |
| MarketCap: 155.107 Millions | |
| Recent Price: 11.88 Smart Investing & Trading Score: 38 | |
| Day Percent Change: 0.25% Day Change: 0.03 | |
| Week Change: -0.83% Year-to-date Change: 2.2% | |
| MPA Links: Profile News Message Board | |
| Charts:- Daily , Weekly | |
| Add MPA to Watchlist: View: Get Complete MPA Trend Analysis ➞ | |
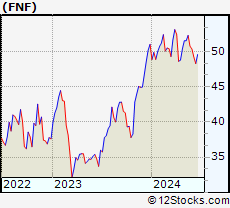 | FNF Fidelity National Financial, Inc. |
| Sector: Financials | |
| SubSector: Surety & Title Insurance | |
| MarketCap: 6532.18 Millions | |
| Recent Price: 50.36 Smart Investing & Trading Score: 38 | |
| Day Percent Change: 0.20% Day Change: 0.10 | |
| Week Change: -0.77% Year-to-date Change: -1.3% | |
| FNF Links: Profile News Message Board | |
| Charts:- Daily , Weekly | |
| Add FNF to Watchlist: View: Get Complete FNF Trend Analysis ➞ | |
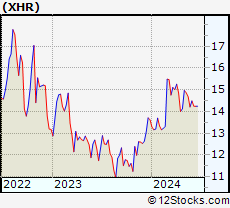 | XHR Xenia Hotels & Resorts, Inc. |
| Sector: Financials | |
| SubSector: REIT - Hotel/Motel | |
| MarketCap: 1058.24 Millions | |
| Recent Price: 14.49 Smart Investing & Trading Score: 37 | |
| Day Percent Change: 2.33% Day Change: 0.33 | |
| Week Change: 1.97% Year-to-date Change: 6.4% | |
| XHR Links: Profile News Message Board | |
| Charts:- Daily , Weekly | |
| Add XHR to Watchlist: View: Get Complete XHR Trend Analysis ➞ | |
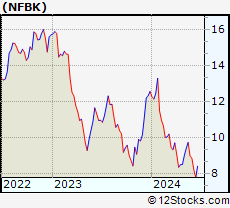 | NFBK Northfield Bancorp, Inc. (Staten Island, NY) |
| Sector: Financials | |
| SubSector: Regional - Northeast Banks | |
| MarketCap: 540.699 Millions | |
| Recent Price: 8.86 Smart Investing & Trading Score: 37 | |
| Day Percent Change: 1.96% Day Change: 0.17 | |
| Week Change: -1.56% Year-to-date Change: -29.6% | |
| NFBK Links: Profile News Message Board | |
| Charts:- Daily , Weekly | |
| Add NFBK to Watchlist: View: Get Complete NFBK Trend Analysis ➞ | |
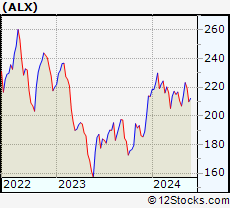 | ALX Alexander s, Inc. |
| Sector: Financials | |
| SubSector: REIT - Retail | |
| MarketCap: 1251.54 Millions | |
| Recent Price: 212.20 Smart Investing & Trading Score: 37 | |
| Day Percent Change: 1.05% Day Change: 2.21 | |
| Week Change: 1.12% Year-to-date Change: -0.6% | |
| ALX Links: Profile News Message Board | |
| Charts:- Daily , Weekly | |
| Add ALX to Watchlist: View: Get Complete ALX Trend Analysis ➞ | |
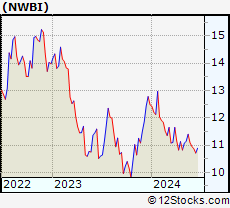 | NWBI Northwest Bancshares, Inc. |
| Sector: Financials | |
| SubSector: Savings & Loans | |
| MarketCap: 1266.3 Millions | |
| Recent Price: 10.95 Smart Investing & Trading Score: 37 | |
| Day Percent Change: 0.55% Day Change: 0.06 | |
| Week Change: -1.26% Year-to-date Change: -12.3% | |
| NWBI Links: Profile News Message Board | |
| Charts:- Daily , Weekly | |
| Add NWBI to Watchlist: View: Get Complete NWBI Trend Analysis ➞ | |
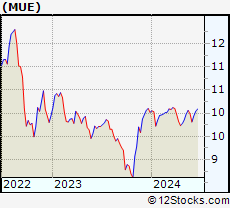 | MUE BlackRock MuniHoldings Quality Fund II, Inc. |
| Sector: Financials | |
| SubSector: Closed-End Fund - Debt | |
| MarketCap: 240.007 Millions | |
| Recent Price: 9.81 Smart Investing & Trading Score: 37 | |
| Day Percent Change: 0.51% Day Change: 0.05 | |
| Week Change: -1.8% Year-to-date Change: -2.1% | |
| MUE Links: Profile News Message Board | |
| Charts:- Daily , Weekly | |
| Add MUE to Watchlist: View: Get Complete MUE Trend Analysis ➞ | |
| For tabular summary view of above stock list: Summary View ➞ 0 - 25 , 25 - 50 , 50 - 75 , 75 - 100 , 100 - 125 , 125 - 150 , 150 - 175 , 175 - 200 , 200 - 225 , 225 - 250 , 250 - 275 , 275 - 300 , 300 - 325 , 325 - 350 , 350 - 375 , 375 - 400 , 400 - 425 , 425 - 450 , 450 - 475 , 475 - 500 , 500 - 525 , 525 - 550 , 550 - 575 , 575 - 600 , 600 - 625 , 625 - 650 , 650 - 675 , 675 - 700 , 700 - 725 , 725 - 750 , 750 - 775 , 775 - 800 , 800 - 825 , 825 - 850 , 850 - 875 , 875 - 900 , 900 - 925 , 925 - 950 , 950 - 975 , 975 - 1000 , 1000 - 1025 , 1025 - 1050 , 1050 - 1075 , 1075 - 1100 , 1100 - 1125 , 1125 - 1150 , 1150 - 1175 , 1175 - 1200 , 1200 - 1225 | ||
| Click To Change The Sort Order: By Market Cap or Company Size Performance: Year-to-date, Week and Day | |
| Select Chart Type: | ||
|
Best Stocks Today 12Stocks.com |
© 2024 12Stocks.com Terms & Conditions Privacy Contact Us
All Information Provided Only For Education And Not To Be Used For Investing or Trading. See Terms & Conditions


One More Thing ... Get Best Stocks Delivered Daily!
Never Ever Miss A Move With Our Top Ten Stocks Lists
Find Best Stocks In Any Market - Bull or Bear Market
Take A Peek At Our Top Ten Stocks Lists: Daily, Weekly, Year-to-Date & Top Trends
Find Best Stocks In Any Market - Bull or Bear Market
Take A Peek At Our Top Ten Stocks Lists: Daily, Weekly, Year-to-Date & Top Trends
Financial Stocks With Best Up Trends [0-bearish to 100-bullish]: X [100], Brighthouse [100], Central and[100], Northrim BanCorp[100], Bank of America[100], Hagerty [100], Urban Edge[100], Global Blockchain[100], Ventas [100], Omega Healthcare[100], LPL [100]
Best Financial Stocks Year-to-Date:
Root [385.58%], Chimera [138.48%], Banco Macro[130.98%], SelectQuote [127.74%], Gladstone Capital[109.35%], Grupo Financiero[107.65%], Banco BBVA[107.54%], EverQuote [95.18%], Hippo [93.63%], Grupo Supervielle[78.33%], Vista Oil[64.18%] Best Financial Stocks This Week:
C3.ai [23%], Investors Title[19.4%], Banco BBVA[14.74%], Riverview Bancorp[14.25%], Banco Macro[13.7%], IRSA Inversiones[12.15%], Grupo Supervielle[11.73%], Metals Acquisition[10.74%], Grupo Financiero[10.41%], Fathom [10.24%], Vista Oil[9.32%] Best Financial Stocks Daily:
Riverview Bancorp[15.75%], Allied World[14.88%], Medical Properties[7.20%], X [6.14%], Franklin Street[5.32%], Washington Federal[5.16%], Iris Energy[5.13%], Ameris Bancorp[4.80%], Brighthouse [4.79%], Auburn National[4.70%], Central and[4.63%]