
 Login Sign Up


| |||||
 |  | ||||

| 12Stocks.com Market Intelligence |
Best Financial Stocks
| In a hurry? Financial Stocks Lists: Performance Trends Table, Stock Charts
Sort Financial stocks: Daily, Weekly, Year-to-Date, Market Cap & Trends. Filter Financial stocks list by size:All Financial Large Mid-Range Small & MicroCap |
| 12Stocks.com Financial Stocks Performances & Trends Daily | |||||||||
|
|  The overall Smart Investing & Trading Score is 78 (0-bearish to 100-bullish) which puts Financial sector in short term neutral to bullish trend. The Smart Investing & Trading Score from previous trading session is 46 and hence an improvement of trend.
| ||||||||
Here are the Smart Investing & Trading Scores of the most requested Financial stocks at 12Stocks.com (click stock name for detailed review):
|


| 12Stocks.com: Investing in Financial sector with Stocks | |
|
The following table helps investors and traders sort through current performance and trends (as measured by Smart Investing & Trading Score) of various
stocks in the Financial sector. Quick View: Move mouse or cursor over stock symbol (ticker) to view short-term Technical chart and over stock name to view long term chart. Click on  to add stock symbol to your watchlist and to add stock symbol to your watchlist and  to view watchlist. Click on any ticker or stock name for detailed market intelligence report for that stock. to view watchlist. Click on any ticker or stock name for detailed market intelligence report for that stock. |
12Stocks.com Performance of Stocks in Financial Sector
| Ticker | Stock Name | Watchlist | Category | Recent Price | Trend Score | Change % | YTD Change% |
| PMM | Putnam Managed |   | Closed-End Fund - Debt | 6.00 | 57 | 0.67% | -1.32% |
| ARL | American Realty | | Property Mgmt | 14.09 | 57 | 0.57% | -19.07% |
| SAFE | Safehold | | REIT - | 19.28 | 57 | 0.42% | -17.61% |
| ARR | ARMOUR Residential | | Mortgage | 19.34 | 57 | 1.36% | 0.10% |
| OCSL | Oaktree Specialty | | Credit Services | 19.52 | 57 | 0.15% | -4.41% |
| PYPL | PayPal | | Credit Services | 62.99 | 56 | 0.77% | 2.57% |
| NBXG | Neuberger Berman | | Closed-End Fund - Equity | 12.13 | 56 | 0.75% | 11.15% |
| USXF | iShares ESG | | Exchange Traded Fund | 45.20 | 56 | 0.65% | 13.54% |
| SPUS | SP Funds | | Exchange Traded Fund | 38.32 | 56 | 0.52% | 11.98% |
| FDG | American Century | | Exchange Traded Fund | 82.87 | 56 | 0.32% | 16.47% |
| NAPR | Innovator Nasdaq | | Exchange Traded Fund | 46.24 | 56 | 0.06% | 4.03% |
| QQQM | Invesco NASDAQ | | Exchange Traded Fund | 185.87 | 56 | 0.01% | 10.40% |
| LAZ | Lazard | | Asset Mgmt | 40.23 | 56 | -2.07% | 15.60% |
| DWAW | AdvisorShares Dorsey | | Exchange Traded Fund | 37.08 | 56 | -1.66% | 8.83% |
| LU | Lufax Holding | | Credit Services | 4.48 | 56 | -1.54% | 45.93% |
| DWUS | AdvisorShares Dorsey | | Exchange Traded Fund | 44.41 | 56 | -1.48% | 10.40% |
| KKR | KKR | | Asset Mgmt | 102.84 | 56 | -0.95% | 24.13% |
| CBLS | Changebridge Capital | | Exchange Traded Fund | 25.31 | 56 | -0.90% | 22.92% |
| TCHP | T. Rowe | | Exchange Traded Fund | 36.22 | 56 | -0.03% | 17.18% |
| RBCAA | Republic Bancorp | | Regional Banks | 51.79 | 56 | 2.64% | -6.11% |
| DFS | Discover | | Credit Services | 122.66 | 56 | 1.28% | 9.13% |
| WFC | Wells Fargo | | Banks | 59.92 | 56 | 1.20% | 21.74% |
| EQBK | Equity Bancshares | | Regional Banks | 33.70 | 56 | 0.99% | -0.59% |
| CTBI | Community Trust | | Regional Banks | 42.11 | 56 | 0.84% | -3.99% |
| BPOP | Popular | | Foreign Banks | 89.01 | 56 | 0.59% | 8.46% |
| For chart view version of above stock list: Chart View ➞ 0 - 25 , 25 - 50 , 50 - 75 , 75 - 100 , 100 - 125 , 125 - 150 , 150 - 175 , 175 - 200 , 200 - 225 , 225 - 250 , 250 - 275 , 275 - 300 , 300 - 325 , 325 - 350 , 350 - 375 , 375 - 400 , 400 - 425 , 425 - 450 , 450 - 475 , 475 - 500 , 500 - 525 , 525 - 550 , 550 - 575 , 575 - 600 , 600 - 625 , 625 - 650 , 650 - 675 , 675 - 700 , 700 - 725 , 725 - 750 , 750 - 775 , 775 - 800 , 800 - 825 , 825 - 850 , 850 - 875 , 875 - 900 , 900 - 925 , 925 - 950 , 950 - 975 , 975 - 1000 , 1000 - 1025 , 1025 - 1050 , 1050 - 1075 , 1075 - 1100 , 1100 - 1125 , 1125 - 1150 , 1150 - 1175 , 1175 - 1200 , 1200 - 1225 | ||
 | Click To Change The Sort Order: By Market Cap or Company Size Performance: Year-to-date, Week and Day |  |
|
Get the most comprehensive stock market coverage daily at 12Stocks.com ➞ Best Stocks Today ➞ Best Stocks Weekly ➞ Best Stocks Year-to-Date ➞ Best Stocks Trends ➞  Best Stocks Today 12Stocks.com Best Nasdaq Stocks ➞ Best S&P 500 Stocks ➞ Best Tech Stocks ➞ Best Biotech Stocks ➞ |
| Detailed Overview of Financial Stocks |
| Financial Technical Overview, Leaders & Laggards, Top Financial ETF Funds & Detailed Financial Stocks List, Charts, Trends & More |
| Financial Sector: Technical Analysis, Trends & YTD Performance | |
| Financial sector is composed of stocks
from banks, brokers, insurance, REITs
and services subsectors. Financial sector, as represented by XLF, an exchange-traded fund [ETF] that holds basket of Financial stocks (e.g, Bank of America, Goldman Sachs) is up by 10.74% and is currently outperforming the overall market by 0.95% year-to-date. Below is a quick view of Technical charts and trends: |
|
 XLF Weekly Chart |
|
| Long Term Trend: Very Good | |
| Medium Term Trend: Good | |
 XLF Daily Chart |
|
| Short Term Trend: Very Good | |
| Overall Trend Score: 78 | |
| YTD Performance: 10.74% | |
| **Trend Scores & Views Are Only For Educational Purposes And Not For Investing | |
| 12Stocks.com: Top Performing Financial Sector Stocks | ||||||||||||||||||||||||||||||||||||||||||||||||
 The top performing Financial sector stocks year to date are
Now, more recently, over last week, the top performing Financial sector stocks on the move are


|
||||||||||||||||||||||||||||||||||||||||||||||||
| 12Stocks.com: Investing in Financial Sector using Exchange Traded Funds | |
|
The following table shows list of key exchange traded funds (ETF) that
help investors track Financial Index. For detailed view, check out our ETF Funds section of our website. Quick View: Move mouse or cursor over ETF symbol (ticker) to view short-term Technical chart and over ETF name to view long term chart. Click on ticker or stock name for detailed view. Click on to add stock symbol to your watchlist and to view watchlist. |
12Stocks.com List of ETFs that track Financial Index
| Ticker | ETF Name | Watchlist | Recent Price | Smart Investing & Trading Score | Change % | Week % | Year-to-date % |
| XLF | Financial | | 41.64 | 78 | 1.46 | 0.07 | 10.74% |
| IAI | Broker-Dealers & Secs | | 116.64 | 58 | 0.53 | -1.91 | 7.47% |
| IYF | Financials | | 95.25 | 78 | 1.32 | 0.03 | 11.52% |
| IYG | Financial Services | | 65.74 | 71 | 1.14 | -0.33 | 10.05% |
| KRE | Regional Banking | | 48.85 | 61 | 1.41 | -0.14 | -6.83% |
| IXG | Global Financials | | 87.05 | 76 | 0.80 | -0.54 | 10.77% |
| VFH | Financials | | 101.01 | 78 | 1.28 | -0.12 | 9.48% |
| KBE | Bank | | 46.23 | 68 | 1.34 | 0 | 0.46% |
| FAS | Financial Bull 3X | | 105.34 | 78 | 4.16 | -0.02 | 27.45% |
| FAZ | Financial Bear 3X | | 10.35 | 17 | -4.08 | -0.1 | -24.29% |
| UYG | Financials | | 65.65 | 78 | 3.19 | -0.03 | 18.93% |
| IAT | Regional Banks | | 41.90 | 68 | 1.87 | 0 | 0.14% |
| KIE | Insurance | | 51.16 | 78 | 1.11 | 0.69 | 13.14% |
| PSCF | SmallCap Financials | | 47.14 | 53 | 1.59 | -0.79 | -4.14% |
| EUFN | Europe Financials | | 24.18 | 100 | 1.02 | 0.71 | 15.36% |
| PGF | Financial Preferred | | 14.79 | 55 | 1.09 | 0.68 | 1.44% |
| 12Stocks.com: Charts, Trends, Fundamental Data and Performances of Financial Stocks | |
|
We now take in-depth look at all Financial stocks including charts, multi-period performances and overall trends (as measured by Smart Investing & Trading Score). One can sort Financial stocks (click link to choose) by Daily, Weekly and by Year-to-Date performances. Also, one can sort by size of the company or by market capitalization. |
| Select Your Default Chart Type: | |||||
| |||||
| Click on stock symbol or name for detailed view. Click on to add stock symbol to your watchlist and to view watchlist. Quick View: Move mouse or cursor over "Daily" to quickly view daily Technical stock chart and over "Weekly" to view weekly Technical stock chart. | |||||

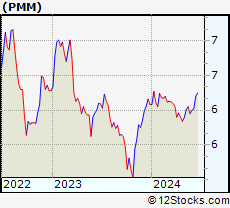 | PMM Putnam Managed Municipal Income Trust |
| Sector: Financials | |
| SubSector: Closed-End Fund - Debt | |
| MarketCap: 315.907 Millions | |
| Recent Price: 6.00 Smart Investing & Trading Score: 57 | |
| Day Percent Change: 0.67% Day Change: 0.04 | |
| Week Change: 0.84% Year-to-date Change: -1.3% | |
| PMM Links: Profile News Message Board | |
| Charts:- Daily , Weekly | |
| Add PMM to Watchlist: View: Get Complete PMM Trend Analysis ➞ | |
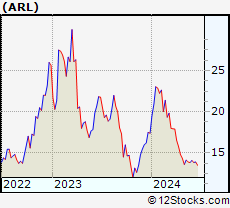 | ARL American Realty Investors, Inc. |
| Sector: Financials | |
| SubSector: Property Management | |
| MarketCap: 132.242 Millions | |
| Recent Price: 14.09 Smart Investing & Trading Score: 57 | |
| Day Percent Change: 0.57% Day Change: 0.08 | |
| Week Change: 1.81% Year-to-date Change: -19.1% | |
| ARL Links: Profile News Message Board | |
| Charts:- Daily , Weekly | |
| Add ARL to Watchlist: View: Get Complete ARL Trend Analysis ➞ | |
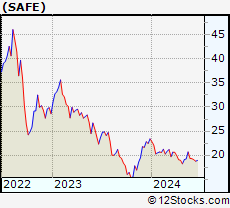 | SAFE Safehold Inc. |
| Sector: Financials | |
| SubSector: REIT - Diversified | |
| MarketCap: 2994.63 Millions | |
| Recent Price: 19.28 Smart Investing & Trading Score: 57 | |
| Day Percent Change: 0.42% Day Change: 0.08 | |
| Week Change: -0.26% Year-to-date Change: -17.6% | |
| SAFE Links: Profile News Message Board | |
| Charts:- Daily , Weekly | |
| Add SAFE to Watchlist: View: Get Complete SAFE Trend Analysis ➞ | |
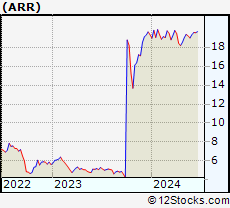 | ARR ARMOUR Residential REIT, Inc. |
| Sector: Financials | |
| SubSector: Mortgage Investment | |
| MarketCap: 578.739 Millions | |
| Recent Price: 19.34 Smart Investing & Trading Score: 57 | |
| Day Percent Change: 1.36% Day Change: 0.26 | |
| Week Change: 1.9% Year-to-date Change: 0.1% | |
| ARR Links: Profile News Message Board | |
| Charts:- Daily , Weekly | |
| Add ARR to Watchlist: View: Get Complete ARR Trend Analysis ➞ | |
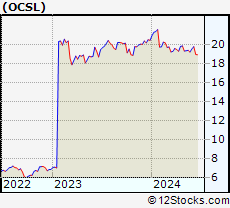 | OCSL Oaktree Specialty Lending Corporation |
| Sector: Financials | |
| SubSector: Credit Services | |
| MarketCap: 353.808 Millions | |
| Recent Price: 19.52 Smart Investing & Trading Score: 57 | |
| Day Percent Change: 0.15% Day Change: 0.03 | |
| Week Change: 1.72% Year-to-date Change: -4.4% | |
| OCSL Links: Profile News Message Board | |
| Charts:- Daily , Weekly | |
| Add OCSL to Watchlist: View: Get Complete OCSL Trend Analysis ➞ | |
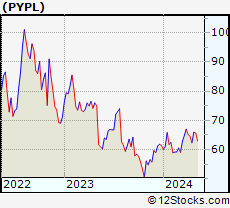 | PYPL PayPal Holdings, Inc. |
| Sector: Financials | |
| SubSector: Credit Services | |
| MarketCap: 108949 Millions | |
| Recent Price: 62.99 Smart Investing & Trading Score: 56 | |
| Day Percent Change: 0.77% Day Change: 0.48 | |
| Week Change: 2.19% Year-to-date Change: 2.6% | |
| PYPL Links: Profile News Message Board | |
| Charts:- Daily , Weekly | |
| Add PYPL to Watchlist: View: Get Complete PYPL Trend Analysis ➞ | |
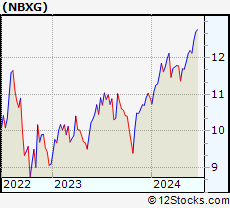 | NBXG Neuberger Berman Next Generation Connectivity Fund Inc. |
| Sector: Financials | |
| SubSector: Closed-End Fund - Equity | |
| MarketCap: 859 Millions | |
| Recent Price: 12.13 Smart Investing & Trading Score: 56 | |
| Day Percent Change: 0.75% Day Change: 0.09 | |
| Week Change: -0.55% Year-to-date Change: 11.2% | |
| NBXG Links: Profile News Message Board | |
| Charts:- Daily , Weekly | |
| Add NBXG to Watchlist: View: Get Complete NBXG Trend Analysis ➞ | |
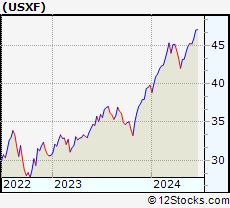 | USXF iShares ESG Advanced MSCI USA ETF |
| Sector: Financials | |
| SubSector: Exchange Traded Fund | |
| MarketCap: 60157 Millions | |
| Recent Price: 45.20 Smart Investing & Trading Score: 56 | |
| Day Percent Change: 0.65% Day Change: 0.29 | |
| Week Change: -0.13% Year-to-date Change: 13.5% | |
| USXF Links: Profile News Message Board | |
| Charts:- Daily , Weekly | |
| Add USXF to Watchlist: View: Get Complete USXF Trend Analysis ➞ | |
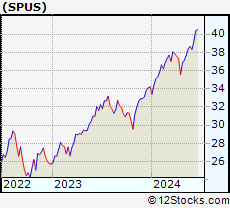 | SPUS SP Funds S&P 500 Sharia Industry Exclusions ETF |
| Sector: Financials | |
| SubSector: Exchange Traded Fund | |
| MarketCap: 60157 Millions | |
| Recent Price: 38.32 Smart Investing & Trading Score: 56 | |
| Day Percent Change: 0.52% Day Change: 0.20 | |
| Week Change: -0.89% Year-to-date Change: 12.0% | |
| SPUS Links: Profile News Message Board | |
| Charts:- Daily , Weekly | |
| Add SPUS to Watchlist: View: Get Complete SPUS Trend Analysis ➞ | |
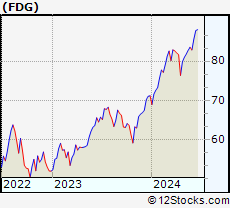 | FDG American Century Focused Dynamic Growth ETF |
| Sector: Financials | |
| SubSector: Exchange Traded Fund | |
| MarketCap: 60157 Millions | |
| Recent Price: 82.87 Smart Investing & Trading Score: 56 | |
| Day Percent Change: 0.32% Day Change: 0.27 | |
| Week Change: -0.85% Year-to-date Change: 16.5% | |
| FDG Links: Profile News Message Board | |
| Charts:- Daily , Weekly | |
| Add FDG to Watchlist: View: Get Complete FDG Trend Analysis ➞ | |
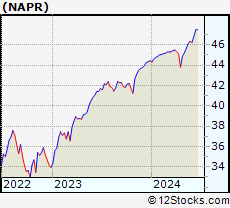 | NAPR Innovator Nasdaq 100 Power Buffer ETF April |
| Sector: Financials | |
| SubSector: Exchange Traded Fund | |
| MarketCap: 60157 Millions | |
| Recent Price: 46.24 Smart Investing & Trading Score: 56 | |
| Day Percent Change: 0.06% Day Change: 0.03 | |
| Week Change: -0.28% Year-to-date Change: 4.0% | |
| NAPR Links: Profile News Message Board | |
| Charts:- Daily , Weekly | |
| Add NAPR to Watchlist: View: Get Complete NAPR Trend Analysis ➞ | |
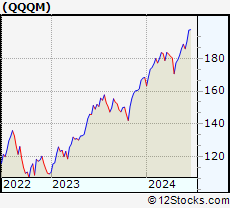 | QQQM Invesco NASDAQ 100 ETF |
| Sector: Financials | |
| SubSector: Exchange Traded Fund | |
| MarketCap: 60157 Millions | |
| Recent Price: 185.87 Smart Investing & Trading Score: 56 | |
| Day Percent Change: 0.01% Day Change: 0.02 | |
| Week Change: -1.46% Year-to-date Change: 10.4% | |
| QQQM Links: Profile News Message Board | |
| Charts:- Daily , Weekly | |
| Add QQQM to Watchlist: View: Get Complete QQQM Trend Analysis ➞ | |
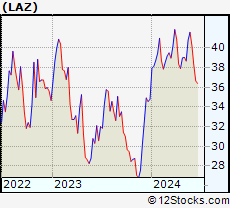 | LAZ Lazard Ltd |
| Sector: Financials | |
| SubSector: Asset Management | |
| MarketCap: 3061.13 Millions | |
| Recent Price: 40.23 Smart Investing & Trading Score: 56 | |
| Day Percent Change: -2.07% Day Change: -0.85 | |
| Week Change: -3.29% Year-to-date Change: 15.6% | |
| LAZ Links: Profile News Message Board | |
| Charts:- Daily , Weekly | |
| Add LAZ to Watchlist: View: Get Complete LAZ Trend Analysis ➞ | |
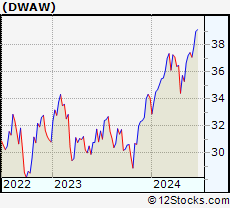 | DWAW AdvisorShares Dorsey Wright FSM All Cap World ETF |
| Sector: Financials | |
| SubSector: Exchange Traded Fund | |
| MarketCap: 60157 Millions | |
| Recent Price: 37.08 Smart Investing & Trading Score: 56 | |
| Day Percent Change: -1.66% Day Change: -0.63 | |
| Week Change: -0.91% Year-to-date Change: 8.8% | |
| DWAW Links: Profile News Message Board | |
| Charts:- Daily , Weekly | |
| Add DWAW to Watchlist: View: Get Complete DWAW Trend Analysis ➞ | |
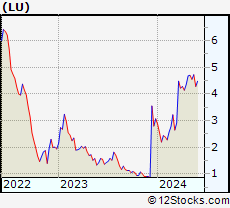 | LU Lufax Holding Ltd |
| Sector: Financials | |
| SubSector: Credit Services | |
| MarketCap: 33457 Millions | |
| Recent Price: 4.48 Smart Investing & Trading Score: 56 | |
| Day Percent Change: -1.54% Day Change: -0.07 | |
| Week Change: 4.67% Year-to-date Change: 45.9% | |
| LU Links: Profile News Message Board | |
| Charts:- Daily , Weekly | |
| Add LU to Watchlist: View: Get Complete LU Trend Analysis ➞ | |
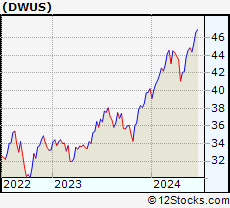 | DWUS AdvisorShares Dorsey Wright FSM US Core ETF |
| Sector: Financials | |
| SubSector: Exchange Traded Fund | |
| MarketCap: 60157 Millions | |
| Recent Price: 44.41 Smart Investing & Trading Score: 56 | |
| Day Percent Change: -1.48% Day Change: -0.67 | |
| Week Change: -1.01% Year-to-date Change: 10.4% | |
| DWUS Links: Profile News Message Board | |
| Charts:- Daily , Weekly | |
| Add DWUS to Watchlist: View: Get Complete DWUS Trend Analysis ➞ | |
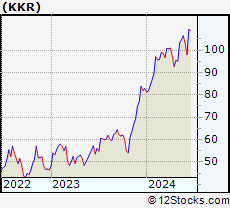 | KKR KKR & Co. Inc. |
| Sector: Financials | |
| SubSector: Asset Management | |
| MarketCap: 17722.5 Millions | |
| Recent Price: 102.84 Smart Investing & Trading Score: 56 | |
| Day Percent Change: -0.95% Day Change: -0.99 | |
| Week Change: -3.37% Year-to-date Change: 24.1% | |
| KKR Links: Profile News Message Board | |
| Charts:- Daily , Weekly | |
| Add KKR to Watchlist: View: Get Complete KKR Trend Analysis ➞ | |
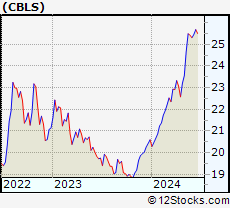 | CBLS Changebridge Capital Long/Short Equity ETF |
| Sector: Financials | |
| SubSector: Exchange Traded Fund | |
| MarketCap: 60157 Millions | |
| Recent Price: 25.31 Smart Investing & Trading Score: 56 | |
| Day Percent Change: -0.90% Day Change: -0.23 | |
| Week Change: -0.45% Year-to-date Change: 22.9% | |
| CBLS Links: Profile News Message Board | |
| Charts:- Daily , Weekly | |
| Add CBLS to Watchlist: View: Get Complete CBLS Trend Analysis ➞ | |
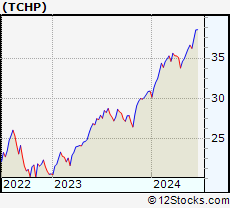 | TCHP T. Rowe Price Blue Chip Growth ETF |
| Sector: Financials | |
| SubSector: Exchange Traded Fund | |
| MarketCap: 60157 Millions | |
| Recent Price: 36.22 Smart Investing & Trading Score: 56 | |
| Day Percent Change: -0.03% Day Change: -0.01 | |
| Week Change: -1.07% Year-to-date Change: 17.2% | |
| TCHP Links: Profile News Message Board | |
| Charts:- Daily , Weekly | |
| Add TCHP to Watchlist: View: Get Complete TCHP Trend Analysis ➞ | |
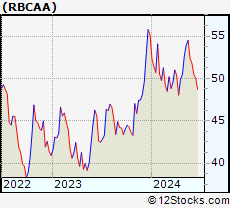 | RBCAA Republic Bancorp, Inc. |
| Sector: Financials | |
| SubSector: Regional - Southeast Banks | |
| MarketCap: 671.835 Millions | |
| Recent Price: 51.79 Smart Investing & Trading Score: 56 | |
| Day Percent Change: 2.64% Day Change: 1.33 | |
| Week Change: -1.18% Year-to-date Change: -6.1% | |
| RBCAA Links: Profile News Message Board | |
| Charts:- Daily , Weekly | |
| Add RBCAA to Watchlist: View: Get Complete RBCAA Trend Analysis ➞ | |
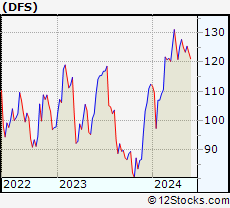 | DFS Discover Financial Services |
| Sector: Financials | |
| SubSector: Credit Services | |
| MarketCap: 9228.88 Millions | |
| Recent Price: 122.66 Smart Investing & Trading Score: 56 | |
| Day Percent Change: 1.28% Day Change: 1.55 | |
| Week Change: -0.45% Year-to-date Change: 9.1% | |
| DFS Links: Profile News Message Board | |
| Charts:- Daily , Weekly | |
| Add DFS to Watchlist: View: Get Complete DFS Trend Analysis ➞ | |
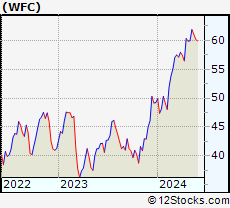 | WFC Wells Fargo & Company |
| Sector: Financials | |
| SubSector: Money Center Banks | |
| MarketCap: 129138 Millions | |
| Recent Price: 59.92 Smart Investing & Trading Score: 56 | |
| Day Percent Change: 1.20% Day Change: 0.71 | |
| Week Change: -0.48% Year-to-date Change: 21.7% | |
| WFC Links: Profile News Message Board | |
| Charts:- Daily , Weekly | |
| Add WFC to Watchlist: View: Get Complete WFC Trend Analysis ➞ | |
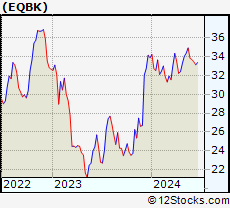 | EQBK Equity Bancshares, Inc. |
| Sector: Financials | |
| SubSector: Regional - Midwest Banks | |
| MarketCap: 272.87 Millions | |
| Recent Price: 33.70 Smart Investing & Trading Score: 56 | |
| Day Percent Change: 0.99% Day Change: 0.33 | |
| Week Change: -0.44% Year-to-date Change: -0.6% | |
| EQBK Links: Profile News Message Board | |
| Charts:- Daily , Weekly | |
| Add EQBK to Watchlist: View: Get Complete EQBK Trend Analysis ➞ | |
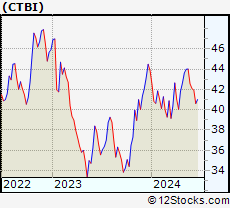 | CTBI Community Trust Bancorp, Inc. |
| Sector: Financials | |
| SubSector: Regional - Southeast Banks | |
| MarketCap: 608.435 Millions | |
| Recent Price: 42.11 Smart Investing & Trading Score: 56 | |
| Day Percent Change: 0.84% Day Change: 0.35 | |
| Week Change: -1.1% Year-to-date Change: -4.0% | |
| CTBI Links: Profile News Message Board | |
| Charts:- Daily , Weekly | |
| Add CTBI to Watchlist: View: Get Complete CTBI Trend Analysis ➞ | |
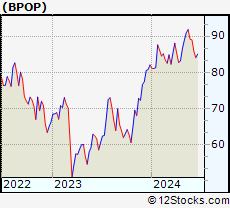 | BPOP Popular, Inc. |
| Sector: Financials | |
| SubSector: Foreign Regional Banks | |
| MarketCap: 2671.99 Millions | |
| Recent Price: 89.01 Smart Investing & Trading Score: 56 | |
| Day Percent Change: 0.59% Day Change: 0.52 | |
| Week Change: -0.24% Year-to-date Change: 8.5% | |
| BPOP Links: Profile News Message Board | |
| Charts:- Daily , Weekly | |
| Add BPOP to Watchlist: View: Get Complete BPOP Trend Analysis ➞ | |
| For tabular summary view of above stock list: Summary View ➞ 0 - 25 , 25 - 50 , 50 - 75 , 75 - 100 , 100 - 125 , 125 - 150 , 150 - 175 , 175 - 200 , 200 - 225 , 225 - 250 , 250 - 275 , 275 - 300 , 300 - 325 , 325 - 350 , 350 - 375 , 375 - 400 , 400 - 425 , 425 - 450 , 450 - 475 , 475 - 500 , 500 - 525 , 525 - 550 , 550 - 575 , 575 - 600 , 600 - 625 , 625 - 650 , 650 - 675 , 675 - 700 , 700 - 725 , 725 - 750 , 750 - 775 , 775 - 800 , 800 - 825 , 825 - 850 , 850 - 875 , 875 - 900 , 900 - 925 , 925 - 950 , 950 - 975 , 975 - 1000 , 1000 - 1025 , 1025 - 1050 , 1050 - 1075 , 1075 - 1100 , 1100 - 1125 , 1125 - 1150 , 1150 - 1175 , 1175 - 1200 , 1200 - 1225 | ||
| Click To Change The Sort Order: By Market Cap or Company Size Performance: Year-to-date, Week and Day | |
| Select Chart Type: | ||
|
Best Stocks Today 12Stocks.com |
© 2024 12Stocks.com Terms & Conditions Privacy Contact Us
All Information Provided Only For Education And Not To Be Used For Investing or Trading. See Terms & Conditions


One More Thing ... Get Best Stocks Delivered Daily!
Never Ever Miss A Move With Our Top Ten Stocks Lists
Find Best Stocks In Any Market - Bull or Bear Market
Take A Peek At Our Top Ten Stocks Lists: Daily, Weekly, Year-to-Date & Top Trends
Find Best Stocks In Any Market - Bull or Bear Market
Take A Peek At Our Top Ten Stocks Lists: Daily, Weekly, Year-to-Date & Top Trends
Financial Stocks With Best Up Trends [0-bearish to 100-bullish]: X [100], Brighthouse [100], Central and[100], Northrim BanCorp[100], Bank of America[100], Hagerty [100], Urban Edge[100], Global Blockchain[100], Ventas [100], Omega Healthcare[100], LPL [100]
Best Financial Stocks Year-to-Date:
Root [385.58%], Chimera [138.48%], Banco Macro[130.98%], SelectQuote [127.74%], Gladstone Capital[109.35%], Grupo Financiero[107.65%], Banco BBVA[107.54%], EverQuote [95.18%], Hippo [93.63%], Grupo Supervielle[78.33%], Vista Oil[64.18%] Best Financial Stocks This Week:
C3.ai [23%], Investors Title[19.4%], Banco BBVA[14.74%], Riverview Bancorp[14.25%], Banco Macro[13.7%], IRSA Inversiones[12.15%], Grupo Supervielle[11.73%], Metals Acquisition[10.74%], Grupo Financiero[10.41%], Fathom [10.24%], Vista Oil[9.32%] Best Financial Stocks Daily:
Riverview Bancorp[15.75%], Allied World[14.88%], Medical Properties[7.20%], X [6.14%], Franklin Street[5.32%], Washington Federal[5.16%], Iris Energy[5.13%], Ameris Bancorp[4.80%], Brighthouse [4.79%], Auburn National[4.70%], Central and[4.63%]