
 Login Sign Up


| |||||
 |  | ||||

| 12Stocks.com Market Intelligence |
Best Financial Stocks
| In a hurry? Financial Stocks Lists: Performance Trends Table, Stock Charts
Sort Financial stocks: Daily, Weekly, Year-to-Date, Market Cap & Trends. Filter Financial stocks list by size:All Financial Large Mid-Range Small & MicroCap |
| 12Stocks.com Financial Stocks Performances & Trends Daily | |||||||||
|
|  The overall Smart Investing & Trading Score is 78 (0-bearish to 100-bullish) which puts Financial sector in short term neutral to bullish trend. The Smart Investing & Trading Score from previous trading session is 46 and hence an improvement of trend.
| ||||||||
Here are the Smart Investing & Trading Scores of the most requested Financial stocks at 12Stocks.com (click stock name for detailed review):
|


| 12Stocks.com: Investing in Financial sector with Stocks | |
|
The following table helps investors and traders sort through current performance and trends (as measured by Smart Investing & Trading Score) of various
stocks in the Financial sector. Quick View: Move mouse or cursor over stock symbol (ticker) to view short-term Technical chart and over stock name to view long term chart. Click on  to add stock symbol to your watchlist and to add stock symbol to your watchlist and  to view watchlist. Click on any ticker or stock name for detailed market intelligence report for that stock. to view watchlist. Click on any ticker or stock name for detailed market intelligence report for that stock. |
12Stocks.com Performance of Stocks in Financial Sector
| Ticker | Stock Name | Watchlist | Category | Recent Price | Smart Investing & Trading Score | Change % | Weekly Change% |
| GPMT | Granite Point |   | Mortgage | 3.15 | 32 | 2.94% | 2.61% |
| IX | ORIX | | Credit Services | 109.43 | 83 | 1.69% | 2.58% |
| HPF | John Hancock | | Closed-End Fund - Debt | 17.09 | 68 | 2.21% | 2.58% |
| HTD | John Hancock | | Closed-End Fund - Debt | 20.68 | 88 | 2.53% | 2.58% |
| LYG | Lloyds Banking | | Foreign Banks | 2.82 | 90 | 0.71% | 2.55% |
| SAN | Banco Santander | | Foreign Banks | 5.24 | 83 | 1.95% | 2.54% |
| GBBK | Global Blockchain | | SPAC | 11.76 | 100 | 2.78% | 2.52% |
| AFL | Aflac | | Insurance | 89.87 | 100 | 2.15% | 2.49% |
| AMBC | Ambac | | Insurance | 17.72 | 93 | 1.03% | 2.49% |
| ADC | Agree Realty | | Property Mgmt | 60.76 | 93 | 0.83% | 2.44% |
| COLB | Columbia Banking | | S&L | 19.28 | 68 | 1.85% | 2.44% |
| BCS | Barclays | | Foreign Banks | 11.35 | 90 | 0.80% | 2.44% |
| FSV | FirstService | | Property Mgmt | 147.12 | 42 | 2.43% | 2.42% |
| CBL | CBL & Associates Properties | | REIT - Retail | 22.10 | 52 | 1.19% | 2.41% |
| PLYM | Plymouth Industrial | | REIT - Industrial | 20.86 | 42 | 2.05% | 2.41% |
| ARDC | Ares Dynamic | | Asset Mgmt | 14.52 | 83 | 1.04% | 2.40% |
| TRTX | TPG RE | | Mortgage | 8.58 | 68 | 0.47% | 2.39% |
| CEE | Central and | | Closed-End Fund - Foreign | 10.55 | 100 | 4.63% | 2.38% |
| KMPR | Kemper | | Insurance | 59.84 | 63 | 1.94% | 2.34% |
| VOYA | Voya | | Asset Mgmt | 75.82 | 100 | 1.77% | 2.33% |
| SPG | Simon Property | | REIT - Retail | 151.31 | 90 | 1.93% | 2.32% |
| ABR | Arbor Realty | | Mortgage | 13.68 | 93 | 1.71% | 2.32% |
| MSB | Mesabi Trust | | Investments | 17.72 | 93 | 3.26% | 2.31% |
| UTG | Reaves Utility | | Closed-End Fund - Equity | 28.43 | 93 | 2.23% | 2.30% |
| SIEB | Siebert | | Brokerage | 2.22 | 68 | 4.23% | 2.30% |
| For chart view version of above stock list: Chart View ➞ 0 - 25 , 25 - 50 , 50 - 75 , 75 - 100 , 100 - 125 , 125 - 150 , 150 - 175 , 175 - 200 , 200 - 225 , 225 - 250 , 250 - 275 , 275 - 300 , 300 - 325 , 325 - 350 , 350 - 375 , 375 - 400 , 400 - 425 , 425 - 450 , 450 - 475 , 475 - 500 , 500 - 525 , 525 - 550 , 550 - 575 , 575 - 600 , 600 - 625 , 625 - 650 , 650 - 675 , 675 - 700 , 700 - 725 , 725 - 750 , 750 - 775 , 775 - 800 , 800 - 825 , 825 - 850 , 850 - 875 , 875 - 900 , 900 - 925 , 925 - 950 , 950 - 975 , 975 - 1000 , 1000 - 1025 , 1025 - 1050 , 1050 - 1075 , 1075 - 1100 , 1100 - 1125 , 1125 - 1150 , 1150 - 1175 , 1175 - 1200 , 1200 - 1225 | ||
 | Click To Change The Sort Order: By Market Cap or Company Size Performance: Year-to-date, Week and Day |  |
|
Get the most comprehensive stock market coverage daily at 12Stocks.com ➞ Best Stocks Today ➞ Best Stocks Weekly ➞ Best Stocks Year-to-Date ➞ Best Stocks Trends ➞  Best Stocks Today 12Stocks.com Best Nasdaq Stocks ➞ Best S&P 500 Stocks ➞ Best Tech Stocks ➞ Best Biotech Stocks ➞ |
| Detailed Overview of Financial Stocks |
| Financial Technical Overview, Leaders & Laggards, Top Financial ETF Funds & Detailed Financial Stocks List, Charts, Trends & More |
| Financial Sector: Technical Analysis, Trends & YTD Performance | |
| Financial sector is composed of stocks
from banks, brokers, insurance, REITs
and services subsectors. Financial sector, as represented by XLF, an exchange-traded fund [ETF] that holds basket of Financial stocks (e.g, Bank of America, Goldman Sachs) is up by 10.74% and is currently outperforming the overall market by 0.95% year-to-date. Below is a quick view of Technical charts and trends: |
|
 XLF Weekly Chart |
|
| Long Term Trend: Very Good | |
| Medium Term Trend: Good | |
 XLF Daily Chart |
|
| Short Term Trend: Very Good | |
| Overall Trend Score: 78 | |
| YTD Performance: 10.74% | |
| **Trend Scores & Views Are Only For Educational Purposes And Not For Investing | |
| 12Stocks.com: Top Performing Financial Sector Stocks | ||||||||||||||||||||||||||||||||||||||||||||||||
 The top performing Financial sector stocks year to date are
Now, more recently, over last week, the top performing Financial sector stocks on the move are


|
||||||||||||||||||||||||||||||||||||||||||||||||
| 12Stocks.com: Investing in Financial Sector using Exchange Traded Funds | |
|
The following table shows list of key exchange traded funds (ETF) that
help investors track Financial Index. For detailed view, check out our ETF Funds section of our website. Quick View: Move mouse or cursor over ETF symbol (ticker) to view short-term Technical chart and over ETF name to view long term chart. Click on ticker or stock name for detailed view. Click on to add stock symbol to your watchlist and to view watchlist. |
12Stocks.com List of ETFs that track Financial Index
| Ticker | ETF Name | Watchlist | Recent Price | Smart Investing & Trading Score | Change % | Week % | Year-to-date % |
| XLF | Financial | | 41.64 | 78 | 1.46 | 0.07 | 10.74% |
| IAI | Broker-Dealers & Secs | | 116.64 | 58 | 0.53 | -1.91 | 7.47% |
| IYF | Financials | | 95.25 | 78 | 1.32 | 0.03 | 11.52% |
| IYG | Financial Services | | 65.74 | 71 | 1.14 | -0.33 | 10.05% |
| KRE | Regional Banking | | 48.85 | 61 | 1.41 | -0.14 | -6.83% |
| IXG | Global Financials | | 87.05 | 76 | 0.80 | -0.54 | 10.77% |
| VFH | Financials | | 101.01 | 78 | 1.28 | -0.12 | 9.48% |
| KBE | Bank | | 46.23 | 68 | 1.34 | 0 | 0.46% |
| FAS | Financial Bull 3X | | 105.34 | 78 | 4.16 | -0.02 | 27.45% |
| FAZ | Financial Bear 3X | | 10.35 | 17 | -4.08 | -0.1 | -24.29% |
| UYG | Financials | | 65.65 | 78 | 3.19 | -0.03 | 18.93% |
| IAT | Regional Banks | | 41.90 | 68 | 1.87 | 0 | 0.14% |
| KIE | Insurance | | 51.16 | 78 | 1.11 | 0.69 | 13.14% |
| PSCF | SmallCap Financials | | 47.14 | 53 | 1.59 | -0.79 | -4.14% |
| EUFN | Europe Financials | | 24.18 | 100 | 1.02 | 0.71 | 15.36% |
| PGF | Financial Preferred | | 14.79 | 55 | 1.09 | 0.68 | 1.44% |
| 12Stocks.com: Charts, Trends, Fundamental Data and Performances of Financial Stocks | |
|
We now take in-depth look at all Financial stocks including charts, multi-period performances and overall trends (as measured by Smart Investing & Trading Score). One can sort Financial stocks (click link to choose) by Daily, Weekly and by Year-to-Date performances. Also, one can sort by size of the company or by market capitalization. |
| Select Your Default Chart Type: | |||||
| |||||
| Click on stock symbol or name for detailed view. Click on to add stock symbol to your watchlist and to view watchlist. Quick View: Move mouse or cursor over "Daily" to quickly view daily Technical stock chart and over "Weekly" to view weekly Technical stock chart. | |||||

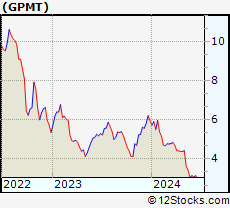 | GPMT Granite Point Mortgage Trust Inc. |
| Sector: Financials | |
| SubSector: Mortgage Investment | |
| MarketCap: 289.739 Millions | |
| Recent Price: 3.15 Smart Investing & Trading Score: 32 | |
| Day Percent Change: 2.94% Day Change: 0.09 | |
| Week Change: 2.61% Year-to-date Change: -47.0% | |
| GPMT Links: Profile News Message Board | |
| Charts:- Daily , Weekly | |
| Add GPMT to Watchlist: View: Get Complete GPMT Trend Analysis ➞ | |
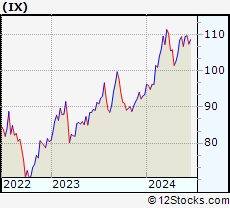 | IX ORIX Corporation |
| Sector: Financials | |
| SubSector: Credit Services | |
| MarketCap: 15483.4 Millions | |
| Recent Price: 109.43 Smart Investing & Trading Score: 83 | |
| Day Percent Change: 1.69% Day Change: 1.82 | |
| Week Change: 2.58% Year-to-date Change: 17.2% | |
| IX Links: Profile News Message Board | |
| Charts:- Daily , Weekly | |
| Add IX to Watchlist: View: Get Complete IX Trend Analysis ➞ | |
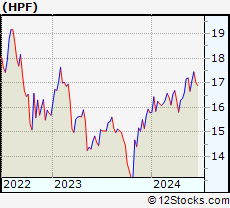 | HPF John Hancock Preferred Income Fund II |
| Sector: Financials | |
| SubSector: Closed-End Fund - Debt | |
| MarketCap: 269.407 Millions | |
| Recent Price: 17.09 Smart Investing & Trading Score: 68 | |
| Day Percent Change: 2.21% Day Change: 0.37 | |
| Week Change: 2.58% Year-to-date Change: 8.3% | |
| HPF Links: Profile News Message Board | |
| Charts:- Daily , Weekly | |
| Add HPF to Watchlist: View: Get Complete HPF Trend Analysis ➞ | |
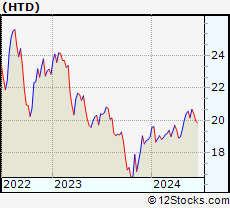 | HTD John Hancock Tax-Advantaged Dividend Income Fund |
| Sector: Financials | |
| SubSector: Closed-End Fund - Debt | |
| MarketCap: 467.107 Millions | |
| Recent Price: 20.68 Smart Investing & Trading Score: 88 | |
| Day Percent Change: 2.53% Day Change: 0.51 | |
| Week Change: 2.58% Year-to-date Change: 9.0% | |
| HTD Links: Profile News Message Board | |
| Charts:- Daily , Weekly | |
| Add HTD to Watchlist: View: Get Complete HTD Trend Analysis ➞ | |
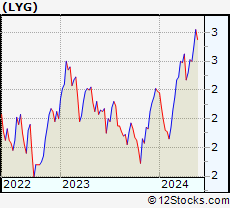 | LYG Lloyds Banking Group plc |
| Sector: Financials | |
| SubSector: Foreign Money Center Banks | |
| MarketCap: 28885.4 Millions | |
| Recent Price: 2.82 Smart Investing & Trading Score: 90 | |
| Day Percent Change: 0.71% Day Change: 0.02 | |
| Week Change: 2.55% Year-to-date Change: 18.0% | |
| LYG Links: Profile News Message Board | |
| Charts:- Daily , Weekly | |
| Add LYG to Watchlist: View: Get Complete LYG Trend Analysis ➞ | |
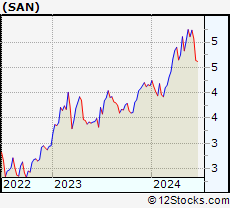 | SAN Banco Santander, S.A. |
| Sector: Financials | |
| SubSector: Foreign Money Center Banks | |
| MarketCap: 44592.5 Millions | |
| Recent Price: 5.24 Smart Investing & Trading Score: 83 | |
| Day Percent Change: 1.95% Day Change: 0.10 | |
| Week Change: 2.54% Year-to-date Change: 26.6% | |
| SAN Links: Profile News Message Board | |
| Charts:- Daily , Weekly | |
| Add SAN to Watchlist: View: Get Complete SAN Trend Analysis ➞ | |
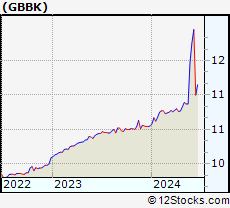 | GBBK Global Blockchain Acquisition Corp. |
| Sector: Financials | |
| SubSector: SPAC | |
| MarketCap: 231 Millions | |
| Recent Price: 11.76 Smart Investing & Trading Score: 100 | |
| Day Percent Change: 2.78% Day Change: 0.32 | |
| Week Change: 2.52% Year-to-date Change: 11.5% | |
| GBBK Links: Profile News Message Board | |
| Charts:- Daily , Weekly | |
| Add GBBK to Watchlist: View: Get Complete GBBK Trend Analysis ➞ | |
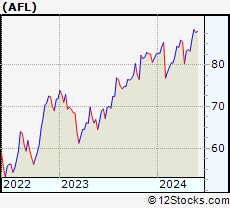 | AFL Aflac Incorporated |
| Sector: Financials | |
| SubSector: Accident & Health Insurance | |
| MarketCap: 22706 Millions | |
| Recent Price: 89.87 Smart Investing & Trading Score: 100 | |
| Day Percent Change: 2.15% Day Change: 1.89 | |
| Week Change: 2.49% Year-to-date Change: 8.9% | |
| AFL Links: Profile News Message Board | |
| Charts:- Daily , Weekly | |
| Add AFL to Watchlist: View: Get Complete AFL Trend Analysis ➞ | |
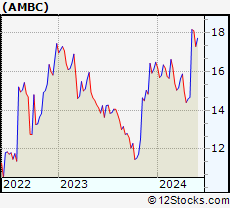 | AMBC Ambac Financial Group, Inc. |
| Sector: Financials | |
| SubSector: Surety & Title Insurance | |
| MarketCap: 587.818 Millions | |
| Recent Price: 17.72 Smart Investing & Trading Score: 93 | |
| Day Percent Change: 1.03% Day Change: 0.18 | |
| Week Change: 2.49% Year-to-date Change: 7.5% | |
| AMBC Links: Profile News Message Board | |
| Charts:- Daily , Weekly | |
| Add AMBC to Watchlist: View: Get Complete AMBC Trend Analysis ➞ | |
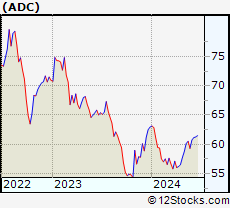 | ADC Agree Realty Corporation |
| Sector: Financials | |
| SubSector: Property Management | |
| MarketCap: 2573.82 Millions | |
| Recent Price: 60.76 Smart Investing & Trading Score: 93 | |
| Day Percent Change: 0.83% Day Change: 0.50 | |
| Week Change: 2.44% Year-to-date Change: -3.5% | |
| ADC Links: Profile News Message Board | |
| Charts:- Daily , Weekly | |
| Add ADC to Watchlist: View: Get Complete ADC Trend Analysis ➞ | |
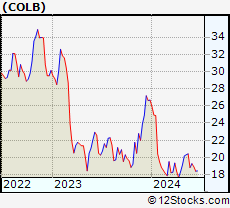 | COLB Columbia Banking System, Inc. |
| Sector: Financials | |
| SubSector: Savings & Loans | |
| MarketCap: 1868.3 Millions | |
| Recent Price: 19.28 Smart Investing & Trading Score: 68 | |
| Day Percent Change: 1.85% Day Change: 0.35 | |
| Week Change: 2.44% Year-to-date Change: -27.7% | |
| COLB Links: Profile News Message Board | |
| Charts:- Daily , Weekly | |
| Add COLB to Watchlist: View: Get Complete COLB Trend Analysis ➞ | |
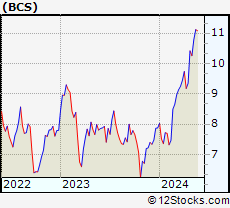 | BCS Barclays PLC |
| Sector: Financials | |
| SubSector: Foreign Money Center Banks | |
| MarketCap: 21013.4 Millions | |
| Recent Price: 11.35 Smart Investing & Trading Score: 90 | |
| Day Percent Change: 0.80% Day Change: 0.09 | |
| Week Change: 2.44% Year-to-date Change: 44.0% | |
| BCS Links: Profile News Message Board | |
| Charts:- Daily , Weekly | |
| Add BCS to Watchlist: View: Get Complete BCS Trend Analysis ➞ | |
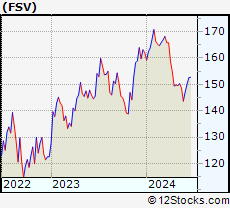 | FSV FirstService Corporation |
| Sector: Financials | |
| SubSector: Property Management | |
| MarketCap: 2793.92 Millions | |
| Recent Price: 147.12 Smart Investing & Trading Score: 42 | |
| Day Percent Change: 2.43% Day Change: 3.49 | |
| Week Change: 2.42% Year-to-date Change: -9.2% | |
| FSV Links: Profile News Message Board | |
| Charts:- Daily , Weekly | |
| Add FSV to Watchlist: View: Get Complete FSV Trend Analysis ➞ | |
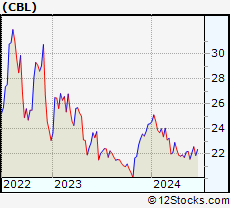 | CBL CBL & Associates Properties, Inc. |
| Sector: Financials | |
| SubSector: REIT - Retail | |
| MarketCap: 690 Millions | |
| Recent Price: 22.10 Smart Investing & Trading Score: 52 | |
| Day Percent Change: 1.19% Day Change: 0.26 | |
| Week Change: 2.41% Year-to-date Change: -9.5% | |
| CBL Links: Profile News Message Board | |
| Charts:- Daily , Weekly | |
| Add CBL to Watchlist: View: Get Complete CBL Trend Analysis ➞ | |
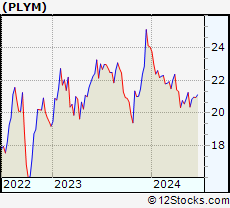 | PLYM Plymouth Industrial REIT, Inc. |
| Sector: Financials | |
| SubSector: REIT - Industrial | |
| MarketCap: 153.449 Millions | |
| Recent Price: 20.86 Smart Investing & Trading Score: 42 | |
| Day Percent Change: 2.05% Day Change: 0.42 | |
| Week Change: 2.41% Year-to-date Change: -13.3% | |
| PLYM Links: Profile News Message Board | |
| Charts:- Daily , Weekly | |
| Add PLYM to Watchlist: View: Get Complete PLYM Trend Analysis ➞ | |
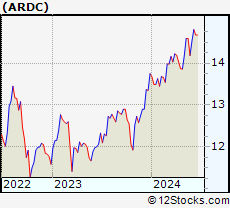 | ARDC Ares Dynamic Credit Allocation Fund, Inc. |
| Sector: Financials | |
| SubSector: Asset Management | |
| MarketCap: 234.803 Millions | |
| Recent Price: 14.52 Smart Investing & Trading Score: 83 | |
| Day Percent Change: 1.04% Day Change: 0.15 | |
| Week Change: 2.4% Year-to-date Change: 5.6% | |
| ARDC Links: Profile News Message Board | |
| Charts:- Daily , Weekly | |
| Add ARDC to Watchlist: View: Get Complete ARDC Trend Analysis ➞ | |
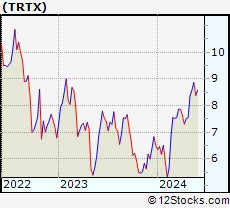 | TRTX TPG RE Finance Trust, Inc. |
| Sector: Financials | |
| SubSector: Mortgage Investment | |
| MarketCap: 607.739 Millions | |
| Recent Price: 8.58 Smart Investing & Trading Score: 68 | |
| Day Percent Change: 0.47% Day Change: 0.04 | |
| Week Change: 2.39% Year-to-date Change: 32.0% | |
| TRTX Links: Profile News Message Board | |
| Charts:- Daily , Weekly | |
| Add TRTX to Watchlist: View: Get Complete TRTX Trend Analysis ➞ | |
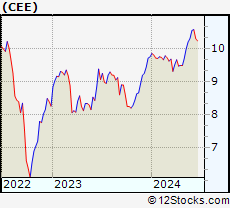 | CEE The Central and Eastern Europe Fund, Inc. |
| Sector: Financials | |
| SubSector: Closed-End Fund - Foreign | |
| MarketCap: 105.847 Millions | |
| Recent Price: 10.55 Smart Investing & Trading Score: 100 | |
| Day Percent Change: 4.63% Day Change: 0.47 | |
| Week Change: 2.38% Year-to-date Change: 8.2% | |
| CEE Links: Profile News Message Board | |
| Charts:- Daily , Weekly | |
| Add CEE to Watchlist: View: Get Complete CEE Trend Analysis ➞ | |
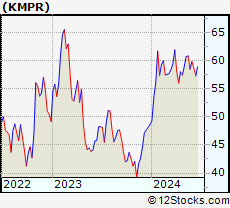 | KMPR Kemper Corporation |
| Sector: Financials | |
| SubSector: Property & Casualty Insurance | |
| MarketCap: 4035.12 Millions | |
| Recent Price: 59.84 Smart Investing & Trading Score: 63 | |
| Day Percent Change: 1.94% Day Change: 1.14 | |
| Week Change: 2.34% Year-to-date Change: 23.0% | |
| KMPR Links: Profile News Message Board | |
| Charts:- Daily , Weekly | |
| Add KMPR to Watchlist: View: Get Complete KMPR Trend Analysis ➞ | |
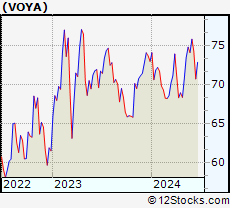 | VOYA Voya Financial, Inc. |
| Sector: Financials | |
| SubSector: Asset Management | |
| MarketCap: 4771.23 Millions | |
| Recent Price: 75.82 Smart Investing & Trading Score: 100 | |
| Day Percent Change: 1.77% Day Change: 1.32 | |
| Week Change: 2.33% Year-to-date Change: 3.9% | |
| VOYA Links: Profile News Message Board | |
| Charts:- Daily , Weekly | |
| Add VOYA to Watchlist: View: Get Complete VOYA Trend Analysis ➞ | |
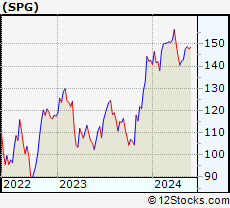 | SPG Simon Property Group, Inc. |
| Sector: Financials | |
| SubSector: REIT - Retail | |
| MarketCap: 17959.6 Millions | |
| Recent Price: 151.31 Smart Investing & Trading Score: 90 | |
| Day Percent Change: 1.93% Day Change: 2.87 | |
| Week Change: 2.32% Year-to-date Change: 6.1% | |
| SPG Links: Profile News Message Board | |
| Charts:- Daily , Weekly | |
| Add SPG to Watchlist: View: Get Complete SPG Trend Analysis ➞ | |
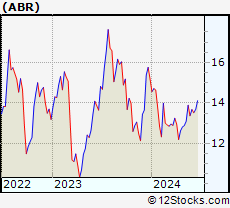 | ABR Arbor Realty Trust, Inc. |
| Sector: Financials | |
| SubSector: Mortgage Investment | |
| MarketCap: 648.939 Millions | |
| Recent Price: 13.68 Smart Investing & Trading Score: 93 | |
| Day Percent Change: 1.71% Day Change: 0.23 | |
| Week Change: 2.32% Year-to-date Change: -9.9% | |
| ABR Links: Profile News Message Board | |
| Charts:- Daily , Weekly | |
| Add ABR to Watchlist: View: Get Complete ABR Trend Analysis ➞ | |
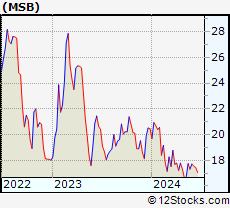 | MSB Mesabi Trust |
| Sector: Financials | |
| SubSector: Diversified Investments | |
| MarketCap: 184.57 Millions | |
| Recent Price: 17.72 Smart Investing & Trading Score: 93 | |
| Day Percent Change: 3.26% Day Change: 0.56 | |
| Week Change: 2.31% Year-to-date Change: -13.4% | |
| MSB Links: Profile News Message Board | |
| Charts:- Daily , Weekly | |
| Add MSB to Watchlist: View: Get Complete MSB Trend Analysis ➞ | |
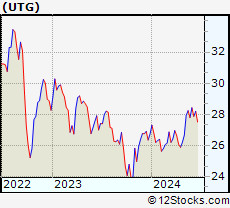 | UTG Reaves Utility Income Fund |
| Sector: Financials | |
| SubSector: Closed-End Fund - Equity | |
| MarketCap: 1090.67 Millions | |
| Recent Price: 28.43 Smart Investing & Trading Score: 93 | |
| Day Percent Change: 2.23% Day Change: 0.62 | |
| Week Change: 2.3% Year-to-date Change: 6.3% | |
| UTG Links: Profile News Message Board | |
| Charts:- Daily , Weekly | |
| Add UTG to Watchlist: View: Get Complete UTG Trend Analysis ➞ | |
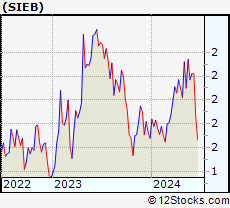 | SIEB Siebert Financial Corp. |
| Sector: Financials | |
| SubSector: Investment Brokerage - Regional | |
| MarketCap: 272.365 Millions | |
| Recent Price: 2.22 Smart Investing & Trading Score: 68 | |
| Day Percent Change: 4.23% Day Change: 0.09 | |
| Week Change: 2.3% Year-to-date Change: 32.1% | |
| SIEB Links: Profile News Message Board | |
| Charts:- Daily , Weekly | |
| Add SIEB to Watchlist: View: Get Complete SIEB Trend Analysis ➞ | |
| For tabular summary view of above stock list: Summary View ➞ 0 - 25 , 25 - 50 , 50 - 75 , 75 - 100 , 100 - 125 , 125 - 150 , 150 - 175 , 175 - 200 , 200 - 225 , 225 - 250 , 250 - 275 , 275 - 300 , 300 - 325 , 325 - 350 , 350 - 375 , 375 - 400 , 400 - 425 , 425 - 450 , 450 - 475 , 475 - 500 , 500 - 525 , 525 - 550 , 550 - 575 , 575 - 600 , 600 - 625 , 625 - 650 , 650 - 675 , 675 - 700 , 700 - 725 , 725 - 750 , 750 - 775 , 775 - 800 , 800 - 825 , 825 - 850 , 850 - 875 , 875 - 900 , 900 - 925 , 925 - 950 , 950 - 975 , 975 - 1000 , 1000 - 1025 , 1025 - 1050 , 1050 - 1075 , 1075 - 1100 , 1100 - 1125 , 1125 - 1150 , 1150 - 1175 , 1175 - 1200 , 1200 - 1225 | ||
| Click To Change The Sort Order: By Market Cap or Company Size Performance: Year-to-date, Week and Day | |
| Select Chart Type: | ||
|
Best Stocks Today 12Stocks.com |
© 2024 12Stocks.com Terms & Conditions Privacy Contact Us
All Information Provided Only For Education And Not To Be Used For Investing or Trading. See Terms & Conditions


One More Thing ... Get Best Stocks Delivered Daily!
Never Ever Miss A Move With Our Top Ten Stocks Lists
Find Best Stocks In Any Market - Bull or Bear Market
Take A Peek At Our Top Ten Stocks Lists: Daily, Weekly, Year-to-Date & Top Trends
Find Best Stocks In Any Market - Bull or Bear Market
Take A Peek At Our Top Ten Stocks Lists: Daily, Weekly, Year-to-Date & Top Trends
Financial Stocks With Best Up Trends [0-bearish to 100-bullish]: X [100], Brighthouse [100], Central and[100], Northrim BanCorp[100], Bank of America[100], Hagerty [100], Urban Edge[100], Global Blockchain[100], Ventas [100], Omega Healthcare[100], LPL [100]
Best Financial Stocks Year-to-Date:
Root [385.58%], Chimera [138.48%], Banco Macro[130.98%], SelectQuote [127.74%], Gladstone Capital[109.35%], Grupo Financiero[107.65%], Banco BBVA[107.54%], EverQuote [95.18%], Hippo [93.63%], Grupo Supervielle[78.33%], Vista Oil[64.18%] Best Financial Stocks This Week:
C3.ai [23%], Investors Title[19.4%], Banco BBVA[14.74%], Riverview Bancorp[14.25%], Banco Macro[13.7%], IRSA Inversiones[12.15%], Grupo Supervielle[11.73%], Metals Acquisition[10.74%], Grupo Financiero[10.41%], Fathom [10.24%], Vista Oil[9.32%] Best Financial Stocks Daily:
Riverview Bancorp[15.75%], Allied World[14.88%], Medical Properties[7.20%], X [6.14%], Franklin Street[5.32%], Washington Federal[5.16%], Iris Energy[5.13%], Ameris Bancorp[4.80%], Brighthouse [4.79%], Auburn National[4.70%], Central and[4.63%]