
 Login Sign Up


| |||||
 |  | ||||

| 12Stocks.com Market Intelligence |
Best Financial Stocks
| In a hurry? Financial Stocks Lists: Performance Trends Table, Stock Charts
Sort Financial stocks: Daily, Weekly, Year-to-Date, Market Cap & Trends. Filter Financial stocks list by size:All Financial Large Mid-Range Small & MicroCap |
| 12Stocks.com Financial Stocks Performances & Trends Daily | |||||||||
|
|  The overall Smart Investing & Trading Score is 78 (0-bearish to 100-bullish) which puts Financial sector in short term neutral to bullish trend. The Smart Investing & Trading Score from previous trading session is 46 and hence an improvement of trend.
| ||||||||
Here are the Smart Investing & Trading Scores of the most requested Financial stocks at 12Stocks.com (click stock name for detailed review):
|


| 12Stocks.com: Investing in Financial sector with Stocks | |
|
The following table helps investors and traders sort through current performance and trends (as measured by Smart Investing & Trading Score) of various
stocks in the Financial sector. Quick View: Move mouse or cursor over stock symbol (ticker) to view short-term Technical chart and over stock name to view long term chart. Click on  to add stock symbol to your watchlist and to add stock symbol to your watchlist and  to view watchlist. Click on any ticker or stock name for detailed market intelligence report for that stock. to view watchlist. Click on any ticker or stock name for detailed market intelligence report for that stock. |
12Stocks.com Performance of Stocks in Financial Sector
| Ticker | Stock Name | Watchlist | Category | Recent Price | Trend Score | Change % | YTD Change% |
| XYF | X |   | Credit Services | 4.15 | 100 | 6.14% | 13.39% |
| BHFAM | Brighthouse | | Insurance - Life | 16.61 | 100 | 4.79% | 7.58% |
| CEE | Central and | | Closed-End Fund - Foreign | 10.55 | 100 | 4.63% | 8.18% |
| NRIM | Northrim BanCorp | | Regional Banks | 58.41 | 100 | 3.55% | 2.10% |
| BAC | Bank of America | | Banks | 39.99 | 100 | 3.52% | 18.77% |
| HGTY | Hagerty | | Insurance - Property & Casualty | 9.62 | 100 | 3.44% | 23.02% |
| UE | Urban Edge | | REIT - | 17.73 | 100 | 3.14% | -3.11% |
| GBBK | Global Blockchain | | SPAC | 11.76 | 100 | 2.78% | 11.45% |
| VTR | Ventas | | REIT | 50.26 | 100 | 2.57% | 0.84% |
| OHI | Omega Healthcare | | REIT | 32.33 | 100 | 2.50% | 5.45% |
| LPLA | LPL | | Brokerage | 286.21 | 100 | 2.44% | 25.74% |
| DMLP | Dorchester Minerals | | Investments | 32.99 | 100 | 2.33% | 3.64% |
| KRG | Kite Realty | | REIT - Retail | 21.92 | 100 | 2.29% | -4.11% |
| SMFG | Sumitomo Mitsui | | Foreign Banks | 13.11 | 100 | 2.26% | 35.43% |
| SBR | Sabine Royalty | | Investments | 65.72 | 100 | 2.24% | -3.15% |
| AFL | Aflac | | Insurance | 89.87 | 100 | 2.15% | 8.93% |
| HBANL | Huntington Bancshares | | Banks - Regional | 25.32 | 100 | 2.10% | 6.12% |
| UBS | UBS | | Foreign Banks | 31.88 | 100 | 2.08% | 3.17% |
| NYMTZ | New York | | REIT - Mortgage | 19.60 | 100 | 2.08% | 12.00% |
| UNTY | Unity Bancorp | | Banks | 27.98 | 100 | 2.01% | -5.44% |
| VOYA | Voya | | Asset Mgmt | 75.82 | 100 | 1.77% | 3.92% |
| SLQT | SelectQuote | | Insurance | 3.12 | 100 | 1.63% | 127.74% |
| SITC | SITE Centers | | REIT - Retail | 14.42 | 100 | 1.55% | 5.80% |
| PRU | Prudential | | Life Insurance | 120.35 | 100 | 1.53% | 16.04% |
| WELL | Welltower | | REIT | 103.67 | 100 | 1.49% | 14.97% |
| For chart view version of above stock list: Chart View ➞ 0 - 25 , 25 - 50 , 50 - 75 , 75 - 100 , 100 - 125 , 125 - 150 , 150 - 175 , 175 - 200 , 200 - 225 , 225 - 250 , 250 - 275 , 275 - 300 , 300 - 325 , 325 - 350 , 350 - 375 , 375 - 400 , 400 - 425 , 425 - 450 , 450 - 475 , 475 - 500 , 500 - 525 , 525 - 550 , 550 - 575 , 575 - 600 , 600 - 625 , 625 - 650 , 650 - 675 , 675 - 700 , 700 - 725 , 725 - 750 , 750 - 775 , 775 - 800 , 800 - 825 , 825 - 850 , 850 - 875 , 875 - 900 , 900 - 925 , 925 - 950 , 950 - 975 , 975 - 1000 , 1000 - 1025 , 1025 - 1050 , 1050 - 1075 , 1075 - 1100 , 1100 - 1125 , 1125 - 1150 , 1150 - 1175 , 1175 - 1200 , 1200 - 1225 | ||
 | Click To Change The Sort Order: By Market Cap or Company Size Performance: Year-to-date, Week and Day |  |
|
Get the most comprehensive stock market coverage daily at 12Stocks.com ➞ Best Stocks Today ➞ Best Stocks Weekly ➞ Best Stocks Year-to-Date ➞ Best Stocks Trends ➞  Best Stocks Today 12Stocks.com Best Nasdaq Stocks ➞ Best S&P 500 Stocks ➞ Best Tech Stocks ➞ Best Biotech Stocks ➞ |
| Detailed Overview of Financial Stocks |
| Financial Technical Overview, Leaders & Laggards, Top Financial ETF Funds & Detailed Financial Stocks List, Charts, Trends & More |
| Financial Sector: Technical Analysis, Trends & YTD Performance | |
| Financial sector is composed of stocks
from banks, brokers, insurance, REITs
and services subsectors. Financial sector, as represented by XLF, an exchange-traded fund [ETF] that holds basket of Financial stocks (e.g, Bank of America, Goldman Sachs) is up by 10.74% and is currently outperforming the overall market by 0.95% year-to-date. Below is a quick view of Technical charts and trends: |
|
 XLF Weekly Chart |
|
| Long Term Trend: Very Good | |
| Medium Term Trend: Good | |
 XLF Daily Chart |
|
| Short Term Trend: Very Good | |
| Overall Trend Score: 78 | |
| YTD Performance: 10.74% | |
| **Trend Scores & Views Are Only For Educational Purposes And Not For Investing | |
| 12Stocks.com: Top Performing Financial Sector Stocks | ||||||||||||||||||||||||||||||||||||||||||||||||
 The top performing Financial sector stocks year to date are
Now, more recently, over last week, the top performing Financial sector stocks on the move are


|
||||||||||||||||||||||||||||||||||||||||||||||||
| 12Stocks.com: Investing in Financial Sector using Exchange Traded Funds | |
|
The following table shows list of key exchange traded funds (ETF) that
help investors track Financial Index. For detailed view, check out our ETF Funds section of our website. Quick View: Move mouse or cursor over ETF symbol (ticker) to view short-term Technical chart and over ETF name to view long term chart. Click on ticker or stock name for detailed view. Click on to add stock symbol to your watchlist and to view watchlist. |
12Stocks.com List of ETFs that track Financial Index
| Ticker | ETF Name | Watchlist | Recent Price | Smart Investing & Trading Score | Change % | Week % | Year-to-date % |
| XLF | Financial | | 41.64 | 78 | 1.46 | 0.07 | 10.74% |
| IAI | Broker-Dealers & Secs | | 116.64 | 58 | 0.53 | -1.91 | 7.47% |
| IYF | Financials | | 95.25 | 78 | 1.32 | 0.03 | 11.52% |
| IYG | Financial Services | | 65.74 | 71 | 1.14 | -0.33 | 10.05% |
| KRE | Regional Banking | | 48.85 | 61 | 1.41 | -0.14 | -6.83% |
| IXG | Global Financials | | 87.05 | 76 | 0.80 | -0.54 | 10.77% |
| VFH | Financials | | 101.01 | 78 | 1.28 | -0.12 | 9.48% |
| KBE | Bank | | 46.23 | 68 | 1.34 | 0 | 0.46% |
| FAS | Financial Bull 3X | | 105.34 | 78 | 4.16 | -0.02 | 27.45% |
| FAZ | Financial Bear 3X | | 10.35 | 17 | -4.08 | -0.1 | -24.29% |
| UYG | Financials | | 65.65 | 78 | 3.19 | -0.03 | 18.93% |
| IAT | Regional Banks | | 41.90 | 68 | 1.87 | 0 | 0.14% |
| KIE | Insurance | | 51.16 | 78 | 1.11 | 0.69 | 13.14% |
| PSCF | SmallCap Financials | | 47.14 | 53 | 1.59 | -0.79 | -4.14% |
| EUFN | Europe Financials | | 24.18 | 100 | 1.02 | 0.71 | 15.36% |
| PGF | Financial Preferred | | 14.79 | 55 | 1.09 | 0.68 | 1.44% |
| 12Stocks.com: Charts, Trends, Fundamental Data and Performances of Financial Stocks | |
|
We now take in-depth look at all Financial stocks including charts, multi-period performances and overall trends (as measured by Smart Investing & Trading Score). One can sort Financial stocks (click link to choose) by Daily, Weekly and by Year-to-Date performances. Also, one can sort by size of the company or by market capitalization. |
| Select Your Default Chart Type: | |||||
| |||||
| Click on stock symbol or name for detailed view. Click on to add stock symbol to your watchlist and to view watchlist. Quick View: Move mouse or cursor over "Daily" to quickly view daily Technical stock chart and over "Weekly" to view weekly Technical stock chart. | |||||

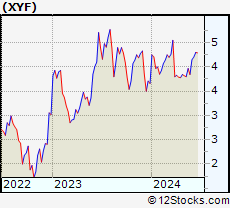 | XYF X Financial |
| Sector: Financials | |
| SubSector: Credit Services | |
| MarketCap: 168.008 Millions | |
| Recent Price: 4.15 Smart Investing & Trading Score: 100 | |
| Day Percent Change: 6.14% Day Change: 0.24 | |
| Week Change: 7.93% Year-to-date Change: 13.4% | |
| XYF Links: Profile News Message Board | |
| Charts:- Daily , Weekly | |
| Add XYF to Watchlist: View: Get Complete XYF Trend Analysis ➞ | |
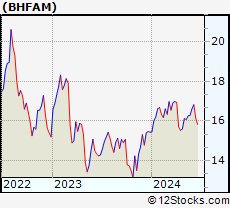 | BHFAM Brighthouse Financial, Inc. |
| Sector: Financials | |
| SubSector: Insurance - Life | |
| MarketCap: 3170 Millions | |
| Recent Price: 16.61 Smart Investing & Trading Score: 100 | |
| Day Percent Change: 4.79% Day Change: 0.76 | |
| Week Change: 2.03% Year-to-date Change: 7.6% | |
| BHFAM Links: Profile News Message Board | |
| Charts:- Daily , Weekly | |
| Add BHFAM to Watchlist: View: Get Complete BHFAM Trend Analysis ➞ | |
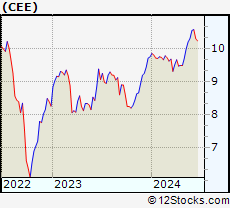 | CEE The Central and Eastern Europe Fund, Inc. |
| Sector: Financials | |
| SubSector: Closed-End Fund - Foreign | |
| MarketCap: 105.847 Millions | |
| Recent Price: 10.55 Smart Investing & Trading Score: 100 | |
| Day Percent Change: 4.63% Day Change: 0.47 | |
| Week Change: 2.38% Year-to-date Change: 8.2% | |
| CEE Links: Profile News Message Board | |
| Charts:- Daily , Weekly | |
| Add CEE to Watchlist: View: Get Complete CEE Trend Analysis ➞ | |
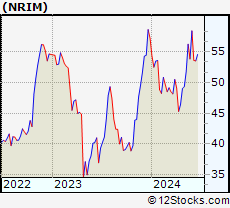 | NRIM Northrim BanCorp, Inc. |
| Sector: Financials | |
| SubSector: Regional - Pacific Banks | |
| MarketCap: 147.629 Millions | |
| Recent Price: 58.41 Smart Investing & Trading Score: 100 | |
| Day Percent Change: 3.55% Day Change: 2.00 | |
| Week Change: 8.49% Year-to-date Change: 2.1% | |
| NRIM Links: Profile News Message Board | |
| Charts:- Daily , Weekly | |
| Add NRIM to Watchlist: View: Get Complete NRIM Trend Analysis ➞ | |
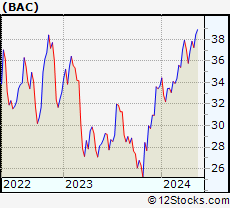 | BAC Bank of America Corporation |
| Sector: Financials | |
| SubSector: Money Center Banks | |
| MarketCap: 189690 Millions | |
| Recent Price: 39.99 Smart Investing & Trading Score: 100 | |
| Day Percent Change: 3.52% Day Change: 1.36 | |
| Week Change: 0.73% Year-to-date Change: 18.8% | |
| BAC Links: Profile News Message Board | |
| Charts:- Daily , Weekly | |
| Add BAC to Watchlist: View: Get Complete BAC Trend Analysis ➞ | |
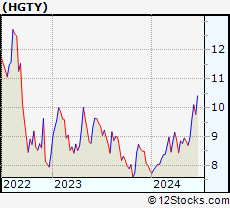 | HGTY Hagerty, Inc. |
| Sector: Financials | |
| SubSector: Insurance - Property & Casualty | |
| MarketCap: 3110 Millions | |
| Recent Price: 9.62 Smart Investing & Trading Score: 100 | |
| Day Percent Change: 3.44% Day Change: 0.32 | |
| Week Change: 7.25% Year-to-date Change: 23.0% | |
| HGTY Links: Profile News Message Board | |
| Charts:- Daily , Weekly | |
| Add HGTY to Watchlist: View: Get Complete HGTY Trend Analysis ➞ | |
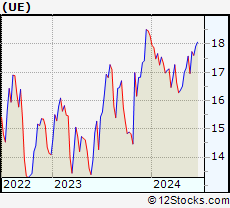 | UE Urban Edge Properties |
| Sector: Financials | |
| SubSector: REIT - Diversified | |
| MarketCap: 1112.33 Millions | |
| Recent Price: 17.73 Smart Investing & Trading Score: 100 | |
| Day Percent Change: 3.14% Day Change: 0.54 | |
| Week Change: 4.54% Year-to-date Change: -3.1% | |
| UE Links: Profile News Message Board | |
| Charts:- Daily , Weekly | |
| Add UE to Watchlist: View: Get Complete UE Trend Analysis ➞ | |
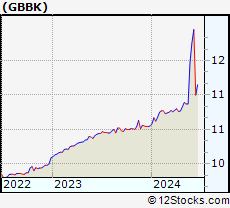 | GBBK Global Blockchain Acquisition Corp. |
| Sector: Financials | |
| SubSector: SPAC | |
| MarketCap: 231 Millions | |
| Recent Price: 11.76 Smart Investing & Trading Score: 100 | |
| Day Percent Change: 2.78% Day Change: 0.32 | |
| Week Change: 2.52% Year-to-date Change: 11.5% | |
| GBBK Links: Profile News Message Board | |
| Charts:- Daily , Weekly | |
| Add GBBK to Watchlist: View: Get Complete GBBK Trend Analysis ➞ | |
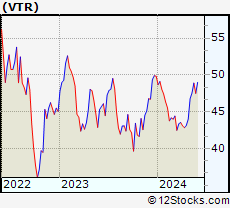 | VTR Ventas, Inc. |
| Sector: Financials | |
| SubSector: REIT - Healthcare Facilities | |
| MarketCap: 11180.4 Millions | |
| Recent Price: 50.26 Smart Investing & Trading Score: 100 | |
| Day Percent Change: 2.57% Day Change: 1.26 | |
| Week Change: 5.81% Year-to-date Change: 0.8% | |
| VTR Links: Profile News Message Board | |
| Charts:- Daily , Weekly | |
| Add VTR to Watchlist: View: Get Complete VTR Trend Analysis ➞ | |
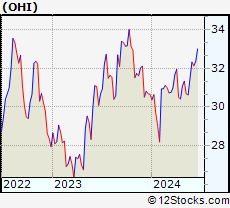 | OHI Omega Healthcare Investors, Inc. |
| Sector: Financials | |
| SubSector: REIT - Healthcare Facilities | |
| MarketCap: 6433.84 Millions | |
| Recent Price: 32.33 Smart Investing & Trading Score: 100 | |
| Day Percent Change: 2.50% Day Change: 0.79 | |
| Week Change: 2.73% Year-to-date Change: 5.5% | |
| OHI Links: Profile News Message Board | |
| Charts:- Daily , Weekly | |
| Add OHI to Watchlist: View: Get Complete OHI Trend Analysis ➞ | |
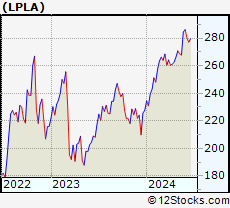 | LPLA LPL Financial Holdings Inc. |
| Sector: Financials | |
| SubSector: Investment Brokerage - National | |
| MarketCap: 4104.65 Millions | |
| Recent Price: 286.21 Smart Investing & Trading Score: 100 | |
| Day Percent Change: 2.44% Day Change: 6.83 | |
| Week Change: 0.64% Year-to-date Change: 25.7% | |
| LPLA Links: Profile News Message Board | |
| Charts:- Daily , Weekly | |
| Add LPLA to Watchlist: View: Get Complete LPLA Trend Analysis ➞ | |
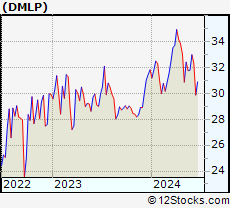 | DMLP Dorchester Minerals, L.P. |
| Sector: Financials | |
| SubSector: Diversified Investments | |
| MarketCap: 363.17 Millions | |
| Recent Price: 32.99 Smart Investing & Trading Score: 100 | |
| Day Percent Change: 2.33% Day Change: 0.75 | |
| Week Change: 3.74% Year-to-date Change: 3.6% | |
| DMLP Links: Profile News Message Board | |
| Charts:- Daily , Weekly | |
| Add DMLP to Watchlist: View: Get Complete DMLP Trend Analysis ➞ | |
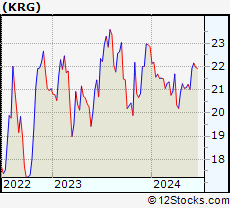 | KRG Kite Realty Group Trust |
| Sector: Financials | |
| SubSector: REIT - Retail | |
| MarketCap: 1030.14 Millions | |
| Recent Price: 21.92 Smart Investing & Trading Score: 100 | |
| Day Percent Change: 2.29% Day Change: 0.49 | |
| Week Change: 4.28% Year-to-date Change: -4.1% | |
| KRG Links: Profile News Message Board | |
| Charts:- Daily , Weekly | |
| Add KRG to Watchlist: View: Get Complete KRG Trend Analysis ➞ | |
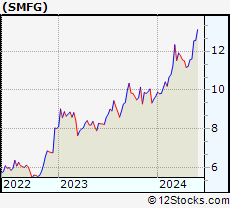 | SMFG Sumitomo Mitsui Financial Group, Inc. |
| Sector: Financials | |
| SubSector: Foreign Regional Banks | |
| MarketCap: 36648.5 Millions | |
| Recent Price: 13.11 Smart Investing & Trading Score: 100 | |
| Day Percent Change: 2.26% Day Change: 0.29 | |
| Week Change: 4.38% Year-to-date Change: 35.4% | |
| SMFG Links: Profile News Message Board | |
| Charts:- Daily , Weekly | |
| Add SMFG to Watchlist: View: Get Complete SMFG Trend Analysis ➞ | |
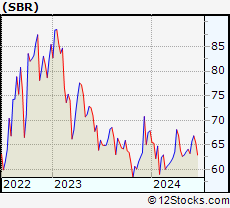 | SBR Sabine Royalty Trust |
| Sector: Financials | |
| SubSector: Diversified Investments | |
| MarketCap: 381.27 Millions | |
| Recent Price: 65.72 Smart Investing & Trading Score: 100 | |
| Day Percent Change: 2.24% Day Change: 1.44 | |
| Week Change: 3.92% Year-to-date Change: -3.2% | |
| SBR Links: Profile News Message Board | |
| Charts:- Daily , Weekly | |
| Add SBR to Watchlist: View: Get Complete SBR Trend Analysis ➞ | |
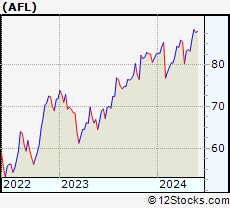 | AFL Aflac Incorporated |
| Sector: Financials | |
| SubSector: Accident & Health Insurance | |
| MarketCap: 22706 Millions | |
| Recent Price: 89.87 Smart Investing & Trading Score: 100 | |
| Day Percent Change: 2.15% Day Change: 1.89 | |
| Week Change: 2.49% Year-to-date Change: 8.9% | |
| AFL Links: Profile News Message Board | |
| Charts:- Daily , Weekly | |
| Add AFL to Watchlist: View: Get Complete AFL Trend Analysis ➞ | |
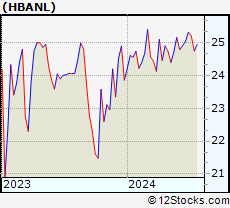 | HBANL Huntington Bancshares Incorporated |
| Sector: Financials | |
| SubSector: Banks - Regional | |
| MarketCap: 15560 Millions | |
| Recent Price: 25.32 Smart Investing & Trading Score: 100 | |
| Day Percent Change: 2.10% Day Change: 0.52 | |
| Week Change: 1.12% Year-to-date Change: 6.1% | |
| HBANL Links: Profile News Message Board | |
| Charts:- Daily , Weekly | |
| Add HBANL to Watchlist: View: Get Complete HBANL Trend Analysis ➞ | |
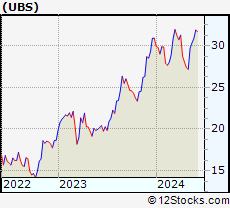 | UBS UBS Group AG |
| Sector: Financials | |
| SubSector: Foreign Money Center Banks | |
| MarketCap: 36840.4 Millions | |
| Recent Price: 31.88 Smart Investing & Trading Score: 100 | |
| Day Percent Change: 2.08% Day Change: 0.65 | |
| Week Change: 3.27% Year-to-date Change: 3.2% | |
| UBS Links: Profile News Message Board | |
| Charts:- Daily , Weekly | |
| Add UBS to Watchlist: View: Get Complete UBS Trend Analysis ➞ | |
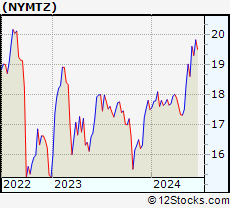 | NYMTZ New York Mortgage Trust, Inc. |
| Sector: Financials | |
| SubSector: REIT - Mortgage | |
| MarketCap: 905 Millions | |
| Recent Price: 19.60 Smart Investing & Trading Score: 100 | |
| Day Percent Change: 2.08% Day Change: 0.40 | |
| Week Change: 5.35% Year-to-date Change: 12.0% | |
| NYMTZ Links: Profile News Message Board | |
| Charts:- Daily , Weekly | |
| Add NYMTZ to Watchlist: View: Get Complete NYMTZ Trend Analysis ➞ | |
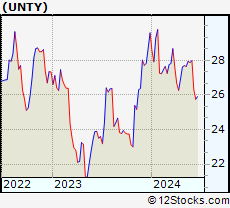 | UNTY Unity Bancorp, Inc. |
| Sector: Financials | |
| SubSector: Money Center Banks | |
| MarketCap: 149.099 Millions | |
| Recent Price: 27.98 Smart Investing & Trading Score: 100 | |
| Day Percent Change: 2.01% Day Change: 0.55 | |
| Week Change: 0.36% Year-to-date Change: -5.4% | |
| UNTY Links: Profile News Message Board | |
| Charts:- Daily , Weekly | |
| Add UNTY to Watchlist: View: Get Complete UNTY Trend Analysis ➞ | |
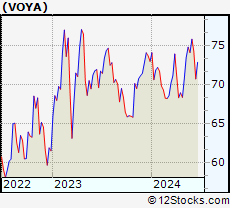 | VOYA Voya Financial, Inc. |
| Sector: Financials | |
| SubSector: Asset Management | |
| MarketCap: 4771.23 Millions | |
| Recent Price: 75.82 Smart Investing & Trading Score: 100 | |
| Day Percent Change: 1.77% Day Change: 1.32 | |
| Week Change: 2.33% Year-to-date Change: 3.9% | |
| VOYA Links: Profile News Message Board | |
| Charts:- Daily , Weekly | |
| Add VOYA to Watchlist: View: Get Complete VOYA Trend Analysis ➞ | |
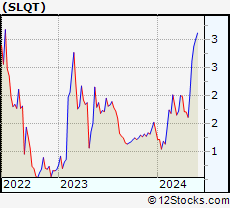 | SLQT SelectQuote, Inc. |
| Sector: Financials | |
| SubSector: Insurance Brokers | |
| MarketCap: 38257 Millions | |
| Recent Price: 3.12 Smart Investing & Trading Score: 100 | |
| Day Percent Change: 1.63% Day Change: 0.05 | |
| Week Change: 3.65% Year-to-date Change: 127.7% | |
| SLQT Links: Profile News Message Board | |
| Charts:- Daily , Weekly | |
| Add SLQT to Watchlist: View: Get Complete SLQT Trend Analysis ➞ | |
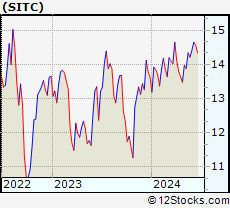 | SITC SITE Centers Corp. |
| Sector: Financials | |
| SubSector: REIT - Retail | |
| MarketCap: 1449.54 Millions | |
| Recent Price: 14.42 Smart Investing & Trading Score: 100 | |
| Day Percent Change: 1.55% Day Change: 0.22 | |
| Week Change: 1.48% Year-to-date Change: 5.8% | |
| SITC Links: Profile News Message Board | |
| Charts:- Daily , Weekly | |
| Add SITC to Watchlist: View: Get Complete SITC Trend Analysis ➞ | |
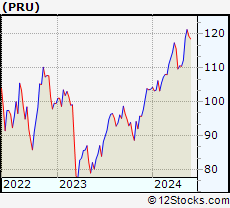 | PRU Prudential Financial, Inc. |
| Sector: Financials | |
| SubSector: Life Insurance | |
| MarketCap: 21001.6 Millions | |
| Recent Price: 120.35 Smart Investing & Trading Score: 100 | |
| Day Percent Change: 1.53% Day Change: 1.81 | |
| Week Change: 0.83% Year-to-date Change: 16.0% | |
| PRU Links: Profile News Message Board | |
| Charts:- Daily , Weekly | |
| Add PRU to Watchlist: View: Get Complete PRU Trend Analysis ➞ | |
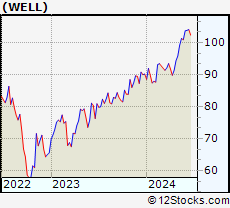 | WELL Welltower Inc. |
| Sector: Financials | |
| SubSector: REIT - Healthcare Facilities | |
| MarketCap: 21398.8 Millions | |
| Recent Price: 103.67 Smart Investing & Trading Score: 100 | |
| Day Percent Change: 1.49% Day Change: 1.52 | |
| Week Change: 2.78% Year-to-date Change: 15.0% | |
| WELL Links: Profile News Message Board | |
| Charts:- Daily , Weekly | |
| Add WELL to Watchlist: View: Get Complete WELL Trend Analysis ➞ | |
| For tabular summary view of above stock list: Summary View ➞ 0 - 25 , 25 - 50 , 50 - 75 , 75 - 100 , 100 - 125 , 125 - 150 , 150 - 175 , 175 - 200 , 200 - 225 , 225 - 250 , 250 - 275 , 275 - 300 , 300 - 325 , 325 - 350 , 350 - 375 , 375 - 400 , 400 - 425 , 425 - 450 , 450 - 475 , 475 - 500 , 500 - 525 , 525 - 550 , 550 - 575 , 575 - 600 , 600 - 625 , 625 - 650 , 650 - 675 , 675 - 700 , 700 - 725 , 725 - 750 , 750 - 775 , 775 - 800 , 800 - 825 , 825 - 850 , 850 - 875 , 875 - 900 , 900 - 925 , 925 - 950 , 950 - 975 , 975 - 1000 , 1000 - 1025 , 1025 - 1050 , 1050 - 1075 , 1075 - 1100 , 1100 - 1125 , 1125 - 1150 , 1150 - 1175 , 1175 - 1200 , 1200 - 1225 | ||
| Click To Change The Sort Order: By Market Cap or Company Size Performance: Year-to-date, Week and Day | |
| Select Chart Type: | ||
|
Best Stocks Today 12Stocks.com |
© 2024 12Stocks.com Terms & Conditions Privacy Contact Us
All Information Provided Only For Education And Not To Be Used For Investing or Trading. See Terms & Conditions


One More Thing ... Get Best Stocks Delivered Daily!
Never Ever Miss A Move With Our Top Ten Stocks Lists
Find Best Stocks In Any Market - Bull or Bear Market
Take A Peek At Our Top Ten Stocks Lists: Daily, Weekly, Year-to-Date & Top Trends
Find Best Stocks In Any Market - Bull or Bear Market
Take A Peek At Our Top Ten Stocks Lists: Daily, Weekly, Year-to-Date & Top Trends
Financial Stocks With Best Up Trends [0-bearish to 100-bullish]: X [100], Brighthouse [100], Central and[100], Northrim BanCorp[100], Bank of America[100], Hagerty [100], Urban Edge[100], Global Blockchain[100], Ventas [100], Omega Healthcare[100], LPL [100]
Best Financial Stocks Year-to-Date:
Root [385.58%], Chimera [138.48%], Banco Macro[130.98%], SelectQuote [127.74%], Gladstone Capital[109.35%], Grupo Financiero[107.65%], Banco BBVA[107.54%], EverQuote [95.18%], Hippo [93.63%], Grupo Supervielle[78.33%], Vista Oil[64.18%] Best Financial Stocks This Week:
C3.ai [23%], Investors Title[19.4%], Banco BBVA[14.74%], Riverview Bancorp[14.25%], Banco Macro[13.7%], IRSA Inversiones[12.15%], Grupo Supervielle[11.73%], Metals Acquisition[10.74%], Grupo Financiero[10.41%], Fathom [10.24%], Vista Oil[9.32%] Best Financial Stocks Daily:
Riverview Bancorp[15.75%], Allied World[14.88%], Medical Properties[7.20%], X [6.14%], Franklin Street[5.32%], Washington Federal[5.16%], Iris Energy[5.13%], Ameris Bancorp[4.80%], Brighthouse [4.79%], Auburn National[4.70%], Central and[4.63%]