
 Login Sign Up


| |||||
 |  | ||||

| 12Stocks.com Market Intelligence |
Best Financial Stocks
| In a hurry? Financial Stocks Lists: Performance Trends Table, Stock Charts
Sort Financial stocks: Daily, Weekly, Year-to-Date, Market Cap & Trends. Filter Financial stocks list by size:All Financial Large Mid-Range Small & MicroCap |
| 12Stocks.com Financial Stocks Performances & Trends Daily | |||||||||
|
|  The overall Smart Investing & Trading Score is 78 (0-bearish to 100-bullish) which puts Financial sector in short term neutral to bullish trend. The Smart Investing & Trading Score from previous trading session is 46 and hence an improvement of trend.
| ||||||||
Here are the Smart Investing & Trading Scores of the most requested Financial stocks at 12Stocks.com (click stock name for detailed review):
|


| 12Stocks.com: Investing in Financial sector with Stocks | |
|
The following table helps investors and traders sort through current performance and trends (as measured by Smart Investing & Trading Score) of various
stocks in the Financial sector. Quick View: Move mouse or cursor over stock symbol (ticker) to view short-term Technical chart and over stock name to view long term chart. Click on  to add stock symbol to your watchlist and to add stock symbol to your watchlist and  to view watchlist. Click on any ticker or stock name for detailed market intelligence report for that stock. to view watchlist. Click on any ticker or stock name for detailed market intelligence report for that stock. |
12Stocks.com Performance of Stocks in Financial Sector
| Ticker | Stock Name | Watchlist | Category | Recent Price | Smart Investing & Trading Score | Change % | YTD Change% |
| RAND | Rand Capital |   | Asset Mgmt | 17.26 | 100 | 11.21 | 32.87% |
| PW | Power REIT | | REIT - | 0.72 | 88 | 8.97 | 10.65% |
| AAMC | Altisource Asset | | Asset Mgmt | 2.58 | 42 | 8.86 | -37.68% |
| ATIF | ATIF | | Asset Mgmt | 0.95 | 53 | 7.95 | -2.07% |
| DGICB | Donegal | | Insurance | 12.79 | 57 | 6.32 | -3.40% |
| SRL | Scully Royalty | | Asset Mgmt | 6.54 | 74 | 5.17 | 7.24% |
| CWBC | Community West | | Regional Banks | 17.37 | 68 | 5.05 | -0.12% |
| CPSS | Consumer Portfolio | | Credit Services | 8.39 | 42 | 4.88 | -10.46% |
| AIHS | Senmiao Technology | | Credit Services | 0.85 | 32 | 4.68 | 107.32% |
| TTP | Tortoise Pipeline | | Asset Mgmt | 34.70 | 83 | 3.27 | 23.44% |
| SNFCA | Security National | | Credit Services | 8.03 | 67 | 3.21 | -10.78% |
| EVO | Eaton Vance | | Asset Mgmt | 4.67 | 52 | 3.20 | -60.19% |
| NML | Neuberger Berman | | Asset Mgmt | 7.74 | 83 | 3.06 | 12.50% |
| BHR | Braemar Hotels | | REIT | 2.79 | 83 | 2.95 | 11.60% |
| MHLD | Maiden | | Insurance | 2.13 | 68 | 2.90 | -6.99% |
| EMO | ClearBridge Energy | | Closed-End Fund - Equity | 42.20 | 83 | 2.88 | 20.85% |
| CTR | ClearBridge MLP | | Closed-End Fund - Equity | 42.67 | 76 | 2.82 | 17.78% |
| RGT | Royce Global | | Asset Mgmt | 11.50 | 100 | 2.77 | 17.95% |
| GLBZ | Glen Burnie | | Regional Banks | 4.37 | 17 | 2.71 | -28.62% |
| NRT | North European | | Investments | 6.98 | 46 | 2.50 | 19.73% |
| HIE | Miller/Howard High | | Closed-End Fund - Equity | 11.25 | 83 | 2.46 | 6.03% |
| CFBK | Central Federal | | S&L | 19.68 | 74 | 2.39 | 0.92% |
| BOTJ | Bank of James | | Regional Banks | 11.28 | 67 | 2.27 | -7.69% |
| DXF | Dunxin | | Credit Services | 0.25 | 15 | 2.16 | -37.24% |
| SACH | Sachem Capital | | Mortgage | 3.02 | 42 | 2.03 | -19.25% |
| For chart view version of above stock list: Chart View ➞ 0 - 25 , 25 - 50 , 50 - 75 , 75 - 100 , 100 - 125 , 125 - 150 | ||
 | Click To Change The Sort Order: By Market Cap or Company Size Performance: Year-to-date, Week and Day |  |
|
Get the most comprehensive stock market coverage daily at 12Stocks.com ➞ Best Stocks Today ➞ Best Stocks Weekly ➞ Best Stocks Year-to-Date ➞ Best Stocks Trends ➞  Best Stocks Today 12Stocks.com Best Nasdaq Stocks ➞ Best S&P 500 Stocks ➞ Best Tech Stocks ➞ Best Biotech Stocks ➞ |
| Detailed Overview of Financial Stocks |
| Financial Technical Overview, Leaders & Laggards, Top Financial ETF Funds & Detailed Financial Stocks List, Charts, Trends & More |
| Financial Sector: Technical Analysis, Trends & YTD Performance | |
| Financial sector is composed of stocks
from banks, brokers, insurance, REITs
and services subsectors. Financial sector, as represented by XLF, an exchange-traded fund [ETF] that holds basket of Financial stocks (e.g, Bank of America, Goldman Sachs) is up by 10.74% and is currently outperforming the overall market by 0.95% year-to-date. Below is a quick view of Technical charts and trends: |
|
 XLF Weekly Chart |
|
| Long Term Trend: Very Good | |
| Medium Term Trend: Good | |
 XLF Daily Chart |
|
| Short Term Trend: Very Good | |
| Overall Trend Score: 78 | |
| YTD Performance: 10.74% | |
| **Trend Scores & Views Are Only For Educational Purposes And Not For Investing | |
| 12Stocks.com: Top Performing Financial Sector Stocks | ||||||||||||||||||||||||||||||||||||||||||||||||
 The top performing Financial sector stocks year to date are
Now, more recently, over last week, the top performing Financial sector stocks on the move are


|
||||||||||||||||||||||||||||||||||||||||||||||||
| 12Stocks.com: Investing in Financial Sector using Exchange Traded Funds | |
|
The following table shows list of key exchange traded funds (ETF) that
help investors track Financial Index. For detailed view, check out our ETF Funds section of our website. Quick View: Move mouse or cursor over ETF symbol (ticker) to view short-term Technical chart and over ETF name to view long term chart. Click on ticker or stock name for detailed view. Click on to add stock symbol to your watchlist and to view watchlist. |
12Stocks.com List of ETFs that track Financial Index
| Ticker | ETF Name | Watchlist | Recent Price | Smart Investing & Trading Score | Change % | Week % | Year-to-date % |
| XLF | Financial | | 41.64 | 78 | 1.46 | 0.07 | 10.74% |
| IAI | Broker-Dealers & Secs | | 116.64 | 58 | 0.53 | -1.91 | 7.47% |
| IYF | Financials | | 95.25 | 78 | 1.32 | 0.03 | 11.52% |
| IYG | Financial Services | | 65.74 | 71 | 1.14 | -0.33 | 10.05% |
| KRE | Regional Banking | | 48.85 | 61 | 1.41 | -0.14 | -6.83% |
| IXG | Global Financials | | 87.05 | 76 | 0.80 | -0.54 | 10.77% |
| VFH | Financials | | 101.01 | 78 | 1.28 | -0.12 | 9.48% |
| KBE | Bank | | 46.23 | 68 | 1.34 | 0 | 0.46% |
| FAS | Financial Bull 3X | | 105.34 | 78 | 4.16 | -0.02 | 27.45% |
| FAZ | Financial Bear 3X | | 10.35 | 17 | -4.08 | -0.1 | -24.29% |
| UYG | Financials | | 65.65 | 78 | 3.19 | -0.03 | 18.93% |
| IAT | Regional Banks | | 41.90 | 68 | 1.87 | 0 | 0.14% |
| KIE | Insurance | | 51.16 | 78 | 1.11 | 0.69 | 13.14% |
| PSCF | SmallCap Financials | | 47.14 | 53 | 1.59 | -0.79 | -4.14% |
| EUFN | Europe Financials | | 24.18 | 100 | 1.02 | 0.71 | 15.36% |
| PGF | Financial Preferred | | 14.79 | 55 | 1.09 | 0.68 | 1.44% |
| 12Stocks.com: Charts, Trends, Fundamental Data and Performances of Financial Stocks | |
|
We now take in-depth look at all Financial stocks including charts, multi-period performances and overall trends (as measured by Smart Investing & Trading Score). One can sort Financial stocks (click link to choose) by Daily, Weekly and by Year-to-Date performances. Also, one can sort by size of the company or by market capitalization. |
| Select Your Default Chart Type: | |||||
| |||||
| Click on stock symbol or name for detailed view. Click on to add stock symbol to your watchlist and to view watchlist. Quick View: Move mouse or cursor over "Daily" to quickly view daily Technical stock chart and over "Weekly" to view weekly Technical stock chart. | |||||

 | RAND Rand Capital Corporation |
| Sector: Financials | |
| SubSector: Asset Management | |
| MarketCap: 38.5203 Millions | |
| Recent Price: 17.26 Smart Investing & Trading Score: 100 | |
| Day Percent Change: 11.21% Day Change: 1.74 | |
| Week Change: 14.23% Year-to-date Change: 32.9% | |
| RAND Links: Profile News Message Board | |
| Charts:- Daily , Weekly | |
| Add RAND to Watchlist: View: Get Complete RAND Trend Analysis ➞ | |
 | PW Power REIT |
| Sector: Financials | |
| SubSector: REIT - Diversified | |
| MarketCap: 15.8253 Millions | |
| Recent Price: 0.72 Smart Investing & Trading Score: 88 | |
| Day Percent Change: 8.97% Day Change: 0.06 | |
| Week Change: 6.69% Year-to-date Change: 10.7% | |
| PW Links: Profile News Message Board | |
| Charts:- Daily , Weekly | |
| Add PW to Watchlist: View: Get Complete PW Trend Analysis ➞ | |
 | AAMC Altisource Asset Management Corporation |
| Sector: Financials | |
| SubSector: Asset Management | |
| MarketCap: 21.0203 Millions | |
| Recent Price: 2.58 Smart Investing & Trading Score: 42 | |
| Day Percent Change: 8.86% Day Change: 0.21 | |
| Week Change: 2.79% Year-to-date Change: -37.7% | |
| AAMC Links: Profile News Message Board | |
| Charts:- Daily , Weekly | |
| Add AAMC to Watchlist: View: Get Complete AAMC Trend Analysis ➞ | |
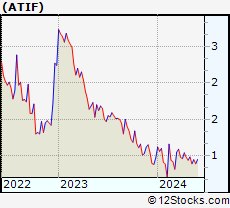 | ATIF ATIF Holdings Limited |
| Sector: Financials | |
| SubSector: Asset Management | |
| MarketCap: 68.5203 Millions | |
| Recent Price: 0.95 Smart Investing & Trading Score: 53 | |
| Day Percent Change: 7.95% Day Change: 0.07 | |
| Week Change: 6.74% Year-to-date Change: -2.1% | |
| ATIF Links: Profile News Message Board | |
| Charts:- Daily , Weekly | |
| Add ATIF to Watchlist: View: Get Complete ATIF Trend Analysis ➞ | |
 | DGICB Donegal Group Inc. |
| Sector: Financials | |
| SubSector: Property & Casualty Insurance | |
| MarketCap: 56.3812 Millions | |
| Recent Price: 12.79 Smart Investing & Trading Score: 57 | |
| Day Percent Change: 6.32% Day Change: 0.76 | |
| Week Change: -1.24% Year-to-date Change: -3.4% | |
| DGICB Links: Profile News Message Board | |
| Charts:- Daily , Weekly | |
| Add DGICB to Watchlist: View: Get Complete DGICB Trend Analysis ➞ | |
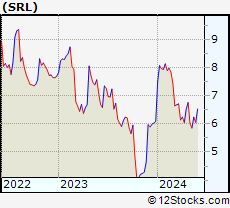 | SRL Scully Royalty Ltd. |
| Sector: Financials | |
| SubSector: Asset Management | |
| MarketCap: 88.3203 Millions | |
| Recent Price: 6.54 Smart Investing & Trading Score: 74 | |
| Day Percent Change: 5.17% Day Change: 0.32 | |
| Week Change: 8% Year-to-date Change: 7.2% | |
| SRL Links: Profile News Message Board | |
| Charts:- Daily , Weekly | |
| Add SRL to Watchlist: View: Get Complete SRL Trend Analysis ➞ | |
 | CWBC Community West Bancshares |
| Sector: Financials | |
| SubSector: Regional - Pacific Banks | |
| MarketCap: 59.6829 Millions | |
| Recent Price: 17.37 Smart Investing & Trading Score: 68 | |
| Day Percent Change: 5.05% Day Change: 0.84 | |
| Week Change: 1.64% Year-to-date Change: -0.1% | |
| CWBC Links: Profile News Message Board | |
| Charts:- Daily , Weekly | |
| Add CWBC to Watchlist: View: Get Complete CWBC Trend Analysis ➞ | |
 | CPSS Consumer Portfolio Services, Inc. |
| Sector: Financials | |
| SubSector: Credit Services | |
| MarketCap: 42.6208 Millions | |
| Recent Price: 8.39 Smart Investing & Trading Score: 42 | |
| Day Percent Change: 4.88% Day Change: 0.39 | |
| Week Change: 3.07% Year-to-date Change: -10.5% | |
| CPSS Links: Profile News Message Board | |
| Charts:- Daily , Weekly | |
| Add CPSS to Watchlist: View: Get Complete CPSS Trend Analysis ➞ | |
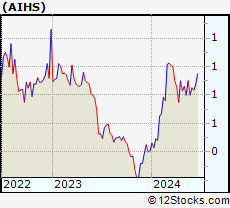 | AIHS Senmiao Technology Limited |
| Sector: Financials | |
| SubSector: Credit Services | |
| MarketCap: 11.8208 Millions | |
| Recent Price: 0.85 Smart Investing & Trading Score: 32 | |
| Day Percent Change: 4.68% Day Change: 0.04 | |
| Week Change: 6.25% Year-to-date Change: 107.3% | |
| AIHS Links: Profile News Message Board | |
| Charts:- Daily , Weekly | |
| Add AIHS to Watchlist: View: Get Complete AIHS Trend Analysis ➞ | |
 | TTP Tortoise Pipeline & Energy Fund, Inc. |
| Sector: Financials | |
| SubSector: Asset Management | |
| MarketCap: 26.0203 Millions | |
| Recent Price: 34.70 Smart Investing & Trading Score: 83 | |
| Day Percent Change: 3.27% Day Change: 1.10 | |
| Week Change: 3.92% Year-to-date Change: 23.4% | |
| TTP Links: Profile News Message Board | |
| Charts:- Daily , Weekly | |
| Add TTP to Watchlist: View: Get Complete TTP Trend Analysis ➞ | |
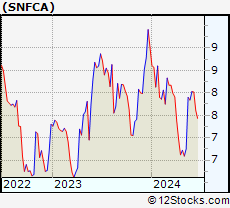 | SNFCA Security National Financial Corporation |
| Sector: Financials | |
| SubSector: Credit Services | |
| MarketCap: 81.0208 Millions | |
| Recent Price: 8.03 Smart Investing & Trading Score: 67 | |
| Day Percent Change: 3.21% Day Change: 0.25 | |
| Week Change: 2.42% Year-to-date Change: -10.8% | |
| SNFCA Links: Profile News Message Board | |
| Charts:- Daily , Weekly | |
| Add SNFCA to Watchlist: View: Get Complete SNFCA Trend Analysis ➞ | |
 | EVO Eaton Vance Ohio Municipal Income Trust |
| Sector: Financials | |
| SubSector: Asset Management | |
| MarketCap: 38.49 Millions | |
| Recent Price: 4.67 Smart Investing & Trading Score: 52 | |
| Day Percent Change: 3.20% Day Change: 0.14 | |
| Week Change: -2.1% Year-to-date Change: -60.2% | |
| EVO Links: Profile News Message Board | |
| Charts:- Daily , Weekly | |
| Add EVO to Watchlist: View: Get Complete EVO Trend Analysis ➞ | |
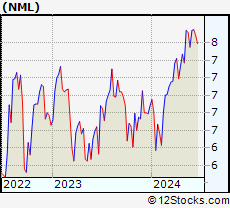 | NML Neuberger Berman MLP and Energy Income Fund Inc. |
| Sector: Financials | |
| SubSector: Asset Management | |
| MarketCap: 94.0203 Millions | |
| Recent Price: 7.74 Smart Investing & Trading Score: 83 | |
| Day Percent Change: 3.06% Day Change: 0.23 | |
| Week Change: 2.52% Year-to-date Change: 12.5% | |
| NML Links: Profile News Message Board | |
| Charts:- Daily , Weekly | |
| Add NML to Watchlist: View: Get Complete NML Trend Analysis ➞ | |
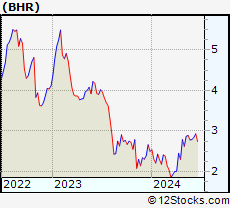 | BHR Braemar Hotels & Resorts, Inc. |
| Sector: Financials | |
| SubSector: REIT - Hotel/Motel | |
| MarketCap: 88.9434 Millions | |
| Recent Price: 2.79 Smart Investing & Trading Score: 83 | |
| Day Percent Change: 2.95% Day Change: 0.08 | |
| Week Change: 0.36% Year-to-date Change: 11.6% | |
| BHR Links: Profile News Message Board | |
| Charts:- Daily , Weekly | |
| Add BHR to Watchlist: View: Get Complete BHR Trend Analysis ➞ | |
 | MHLD Maiden Holdings, Ltd. |
| Sector: Financials | |
| SubSector: Property & Casualty Insurance | |
| MarketCap: 43.5812 Millions | |
| Recent Price: 2.13 Smart Investing & Trading Score: 68 | |
| Day Percent Change: 2.90% Day Change: 0.06 | |
| Week Change: 2.9% Year-to-date Change: -7.0% | |
| MHLD Links: Profile News Message Board | |
| Charts:- Daily , Weekly | |
| Add MHLD to Watchlist: View: Get Complete MHLD Trend Analysis ➞ | |
 | EMO ClearBridge Energy Midstream Opportunity Fund Inc |
| Sector: Financials | |
| SubSector: Closed-End Fund - Equity | |
| MarketCap: 78.1547 Millions | |
| Recent Price: 42.20 Smart Investing & Trading Score: 83 | |
| Day Percent Change: 2.88% Day Change: 1.18 | |
| Week Change: 1.42% Year-to-date Change: 20.9% | |
| EMO Links: Profile News Message Board | |
| Charts:- Daily , Weekly | |
| Add EMO to Watchlist: View: Get Complete EMO Trend Analysis ➞ | |
 | CTR ClearBridge MLP and Midstream Total Return Fund Inc |
| Sector: Financials | |
| SubSector: Closed-End Fund - Equity | |
| MarketCap: 52.0547 Millions | |
| Recent Price: 42.67 Smart Investing & Trading Score: 76 | |
| Day Percent Change: 2.82% Day Change: 1.17 | |
| Week Change: 2.72% Year-to-date Change: 17.8% | |
| CTR Links: Profile News Message Board | |
| Charts:- Daily , Weekly | |
| Add CTR to Watchlist: View: Get Complete CTR Trend Analysis ➞ | |
 | RGT Royce Global Value Trust, Inc. |
| Sector: Financials | |
| SubSector: Asset Management | |
| MarketCap: 70.0203 Millions | |
| Recent Price: 11.50 Smart Investing & Trading Score: 100 | |
| Day Percent Change: 2.77% Day Change: 0.31 | |
| Week Change: 3.6% Year-to-date Change: 18.0% | |
| RGT Links: Profile News Message Board | |
| Charts:- Daily , Weekly | |
| Add RGT to Watchlist: View: Get Complete RGT Trend Analysis ➞ | |
 | GLBZ Glen Burnie Bancorp |
| Sector: Financials | |
| SubSector: Regional - Mid-Atlantic Banks | |
| MarketCap: 25.4859 Millions | |
| Recent Price: 4.37 Smart Investing & Trading Score: 17 | |
| Day Percent Change: 2.71% Day Change: 0.12 | |
| Week Change: -2.35% Year-to-date Change: -28.6% | |
| GLBZ Links: Profile News Message Board | |
| Charts:- Daily , Weekly | |
| Add GLBZ to Watchlist: View: Get Complete GLBZ Trend Analysis ➞ | |
 | NRT North European Oil Royalty Trust |
| Sector: Financials | |
| SubSector: Diversified Investments | |
| MarketCap: 24.567 Millions | |
| Recent Price: 6.98 Smart Investing & Trading Score: 46 | |
| Day Percent Change: 2.50% Day Change: 0.17 | |
| Week Change: -5.61% Year-to-date Change: 19.7% | |
| NRT Links: Profile News Message Board | |
| Charts:- Daily , Weekly | |
| Add NRT to Watchlist: View: Get Complete NRT Trend Analysis ➞ | |
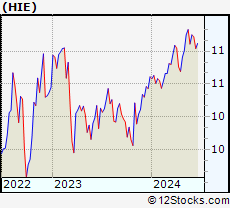 | HIE Miller/Howard High Income Equity Fund |
| Sector: Financials | |
| SubSector: Closed-End Fund - Equity | |
| MarketCap: 88.3547 Millions | |
| Recent Price: 11.25 Smart Investing & Trading Score: 83 | |
| Day Percent Change: 2.46% Day Change: 0.27 | |
| Week Change: 1.26% Year-to-date Change: 6.0% | |
| HIE Links: Profile News Message Board | |
| Charts:- Daily , Weekly | |
| Add HIE to Watchlist: View: Get Complete HIE Trend Analysis ➞ | |
 | CFBK Central Federal Corporation |
| Sector: Financials | |
| SubSector: Savings & Loans | |
| MarketCap: 56.513 Millions | |
| Recent Price: 19.68 Smart Investing & Trading Score: 74 | |
| Day Percent Change: 2.39% Day Change: 0.46 | |
| Week Change: 3.2% Year-to-date Change: 0.9% | |
| CFBK Links: Profile News Message Board | |
| Charts:- Daily , Weekly | |
| Add CFBK to Watchlist: View: Get Complete CFBK Trend Analysis ➞ | |
 | BOTJ Bank of the James Financial Group, Inc. |
| Sector: Financials | |
| SubSector: Regional - Mid-Atlantic Banks | |
| MarketCap: 46.4859 Millions | |
| Recent Price: 11.28 Smart Investing & Trading Score: 67 | |
| Day Percent Change: 2.27% Day Change: 0.25 | |
| Week Change: 2.55% Year-to-date Change: -7.7% | |
| BOTJ Links: Profile News Message Board | |
| Charts:- Daily , Weekly | |
| Add BOTJ to Watchlist: View: Get Complete BOTJ Trend Analysis ➞ | |
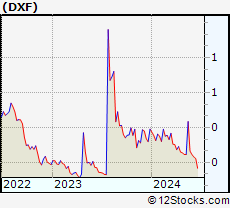 | DXF Dunxin Financial Holdings Limited |
| Sector: Financials | |
| SubSector: Credit Services | |
| MarketCap: 12.2208 Millions | |
| Recent Price: 0.25 Smart Investing & Trading Score: 15 | |
| Day Percent Change: 2.16% Day Change: 0.01 | |
| Week Change: -7.54% Year-to-date Change: -37.2% | |
| DXF Links: Profile News Message Board | |
| Charts:- Daily , Weekly | |
| Add DXF to Watchlist: View: Get Complete DXF Trend Analysis ➞ | |
 | SACH Sachem Capital Corp. |
| Sector: Financials | |
| SubSector: Mortgage Investment | |
| MarketCap: 51.7739 Millions | |
| Recent Price: 3.02 Smart Investing & Trading Score: 42 | |
| Day Percent Change: 2.03% Day Change: 0.06 | |
| Week Change: -1.31% Year-to-date Change: -19.3% | |
| SACH Links: Profile News Message Board | |
| Charts:- Daily , Weekly | |
| Add SACH to Watchlist: View: Get Complete SACH Trend Analysis ➞ | |
| For tabular summary view of above stock list: Summary View ➞ 0 - 25 , 25 - 50 , 50 - 75 , 75 - 100 , 100 - 125 , 125 - 150 | ||
| Click To Change The Sort Order: By Market Cap or Company Size Performance: Year-to-date, Week and Day | |
| Select Chart Type: | ||
|
Best Stocks Today 12Stocks.com |
© 2024 12Stocks.com Terms & Conditions Privacy Contact Us
All Information Provided Only For Education And Not To Be Used For Investing or Trading. See Terms & Conditions


One More Thing ... Get Best Stocks Delivered Daily!
Never Ever Miss A Move With Our Top Ten Stocks Lists
Find Best Stocks In Any Market - Bull or Bear Market
Take A Peek At Our Top Ten Stocks Lists: Daily, Weekly, Year-to-Date & Top Trends
Find Best Stocks In Any Market - Bull or Bear Market
Take A Peek At Our Top Ten Stocks Lists: Daily, Weekly, Year-to-Date & Top Trends
Financial Stocks With Best Up Trends [0-bearish to 100-bullish]: X [100], Brighthouse [100], Central and[100], Northrim BanCorp[100], Bank of America[100], Hagerty [100], Urban Edge[100], Global Blockchain[100], Ventas [100], Omega Healthcare[100], LPL [100]
Best Financial Stocks Year-to-Date:
Root [385.58%], Chimera [138.48%], Banco Macro[130.98%], SelectQuote [127.74%], Gladstone Capital[109.35%], Grupo Financiero[107.65%], Banco BBVA[107.54%], EverQuote [95.18%], Hippo [93.63%], Grupo Supervielle[78.33%], Vista Oil[64.18%] Best Financial Stocks This Week:
C3.ai [23%], Investors Title[19.4%], Banco BBVA[14.74%], Riverview Bancorp[14.25%], Banco Macro[13.7%], IRSA Inversiones[12.15%], Grupo Supervielle[11.73%], Metals Acquisition[10.74%], Grupo Financiero[10.41%], Fathom [10.24%], Vista Oil[9.32%] Best Financial Stocks Daily:
Riverview Bancorp[15.75%], Allied World[14.88%], Medical Properties[7.20%], X [6.14%], Franklin Street[5.32%], Washington Federal[5.16%], Iris Energy[5.13%], Ameris Bancorp[4.80%], Brighthouse [4.79%], Auburn National[4.70%], Central and[4.63%]