
 Login Sign Up


| |||||
 |  | ||||

| 12Stocks.com Market Intelligence |
Best Emerging Markets Stocks
| In a hurry? Emerging Markets Stocks Lists: Trends Table, Stock Charts
Sort Emerging Markets stocks: Daily, Weekly, Year-to-Date, Market Cap & Trends. Filter Emerging Markets stocks list by sector: Show all, Tech, Finance, Energy, Staples, Retail, Industrial, Materials, Utilities and HealthCare Filter Emerging Markets stocks list by size:All Large Medium Small |
| 12Stocks.com Emerging Markets Stocks Performances & Trends Daily | |||||||||
|
|  The overall Smart Investing & Trading Score is 100 (0-bearish to 100-bullish) which puts Emerging Markets index in short term bullish trend. The Smart Investing & Trading Score from previous trading session is 78 and an improvement of trend continues.
| ||||||||
Here are the Smart Investing & Trading Scores of the most requested Emerging Markets stocks at 12Stocks.com (click stock name for detailed review):
|


| 12Stocks.com: Top Performing Emerging Markets Index Stocks | ||||||||||||||||||||||||||||||||||||||||||||||||
 The top performing Emerging Markets Index stocks year to date are
Now, more recently, over last week, the top performing Emerging Markets Index stocks on the move are


|
||||||||||||||||||||||||||||||||||||||||||||||||
| 12Stocks.com: Investing in Emerging Markets Index with Stocks | |
|
The following table helps investors and traders sort through current performance and trends (as measured by Smart Investing & Trading Score ) of various
stocks in the Emerging Markets Index. Quick View: Move mouse or cursor over stock symbol (ticker) to view short-term technical chart and over stock name to view long term chart. Click on  to add stock symbol to your watchlist and to add stock symbol to your watchlist and  to view watchlist. Click on any ticker or stock name for detailed market intelligence report for that stock. to view watchlist. Click on any ticker or stock name for detailed market intelligence report for that stock. |
12Stocks.com Performance of Stocks in Emerging Markets Index
| Ticker | Stock Name | Watchlist | Category | Recent Price | Smart Investing & Trading Score | Change % | YTD Change% |
| BEKE | KE |   | Financials | 17.47 | 100 | 3.74% | 7.77% |
| ITUB | Itau Unibanco | | Financials | 6.34 | 49 | 1.44% | -8.78% |
| NU | Nu | | Financials | 11.69 | 95 | 6.13% | 40.17% |
| HUIZ | Huize Holding | | Financials | 0.67 | 78 | -11.21% | -25.56% |
| LU | Lufax Holding | | Financials | 4.70 | 83 | 1.29% | 53.09% |
| IBN | ICICI Bank | | Financials | 27.34 | 76 | -0.83% | 14.68% |
| BBD | Banco Bradesco | | Financials | 2.72 | 39 | 0.00% | -22.29% |
| HDB | HDFC Bank | | Financials | 58.51 | 93 | -0.61% | -12.81% |
| BBDO | Banco Bradesco | | Financials | 2.43 | 49 | 2.10% | -23.59% |
| BSBR | Banco Santander | | Financials | 5.83 | 100 | 1.57% | -10.99% |
| XP | XP | | Financials | 22.39 | 49 | 5.96% | -14.12% |
| PAGS | PagSeguro Digital | | Financials | 12.81 | 69 | 1.75% | 2.73% |
| VTMX | Vesta Financials | | Financials | 36.15 | 83 | 0.08% | -9.09% |
| LX | LexinFintech | | Financials | 1.82 | 64 | 2.25% | -1.09% |
| NOAH | Noah | | Financials | 13.66 | 100 | 4.35% | -1.09% |
| FANH | Fanhua | | Financials | 3.43 | 42 | 0.29% | -48.42% |
| INTR | Inter & Co | | Financials | 5.32 | 49 | 4.01% | -5.17% |
| QFIN | 360 Finance | | Financials | 19.50 | 95 | -1.91% | 23.26% |
| WDH | Waterdrop | | Financials | 1.15 | 10 | -2.95% | 9.84% |
| DUO | Fangdd Network | | Financials | 0.37 | 10 | -4.96% | -45.63% |
| VINP | Vi Partners | | Financials | 10.69 | 20 | -0.28% | -2.73% |
| FINV | FinVolution | | Financials | 5.01 | 49 | -0.40% | 2.24% |
| RC | Ready Capital | | Financials | 8.66 | 57 | 0.46% | -15.51% |
| YRD | Yiren Digital | | Financials | 5.21 | 78 | -4.40% | 66.99% |
| TOP | TOP Financial | | Financials | 2.62 | 62 | 1.95% | -29.57% |
| For chart view version of above stock list: Chart View ➞ 0 - 25 , 25 - 50 | ||
 | Click To Change The Sort Order: By Market Cap or Company Size Performance: Year-to-date, Week and Day |  |
|
Get the most comprehensive stock market coverage daily at 12Stocks.com ➞ Best Stocks Today ➞ Best Stocks Weekly ➞ Best Stocks Year-to-Date ➞ Best Stocks Trends ➞  Best Stocks Today 12Stocks.com Best Nasdaq Stocks ➞ Best S&P 500 Stocks ➞ Best Tech Stocks ➞ Best Biotech Stocks ➞ |
| Detailed Overview of Emerging Markets Stocks |
| Emerging Markets Technical Overview, Leaders & Laggards, Top Emerging Markets ETF Funds & Detailed Emerging Markets Stocks List, Charts, Trends & More |
| Emerging Markets: Technical Analysis, Trends & YTD Performance | |
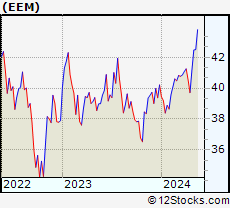
 EEM Weekly Chart |
|
| Long Term Trend: Very Good | |
| Medium Term Trend: Very Good | |
 EEM Daily Chart |
|
| Short Term Trend: Very Good | |
| Overall Trend Score: 100 | |
| YTD Performance: 5.62% | |
| **Trend Scores & Views Are Only For Educational Purposes And Not For Investing | |
| 12Stocks.com: Investing in Emerging Markets Index using Exchange Traded Funds | |
|
The following table shows list of key exchange traded funds (ETF) that
help investors play Emerging Markets stock market. For detailed view, check out our ETF Funds section of our website. Quick View: Move mouse or cursor over ETF symbol (ticker) to view short-term technical chart and over ETF name to view long term chart. Click on ticker or stock name for detailed view. Click on to add stock symbol to your watchlist and to view watchlist. |
12Stocks.com List of ETFs that track Emerging Markets Index
| Ticker | ETF Name | Watchlist | Recent Price | Smart Investing & Trading Score | Change % | Week % | Year-to-date % |
| EEM | Emerging Markets | | 42.47 | 100 | 0.90 | 3.16 | 5.62% |
| VWO | Emerging Markets | | 43.63 | 100 | 0.88 | 3.1 | 6.16% |
| SCHE | Emerging Markets Equity | | 26.35 | 100 | 0.73 | 3.05 | 6.29% |
| EWX | Emerging Markets Small | | 58.18 | 100 | 0.48 | 2.74 | 3.05% |
| EET | Emerging Markets | | 54.38 | 100 | 1.75 | 6.15 | 6.93% |
| EDC | Emrg Mkts Bull | | 32.85 | 100 | 2.82 | 9.46 | 7.95% |
| EEV | Short Emerging | | 18.10 | 0 | -0.39 | -5.85 | -8.23% |
| EUM | Short Emerging | | 13.57 | 0 | -0.84 | -3 | -4.13% |
| EDIV | Emerging Markets Dividend | | 34.42 | 95 | 0.00 | 2.41 | 5.84% |
| EMIF | Emerging Markets Infrastructure | | 22.44 | 100 | 1.77 | 1.45 | 4.86% |
| CEW | Emerging Currency Strat | | 17.88 | 90 | 0.56 | 1.13 | -0.69% |
| EBND | Em Mkts Lcl | | 20.20 | 50 | 0.75 | 1.25 | -4.9% |
| EMCB | Emerging Markets Corp | | 64.20 | 67 | 0.38 | 0.76 | 0.47% |
| VWOB | Emerging Mkts Govt | | 62.99 | 75 | 0.69 | 0.95 | -1.19% |
| EEMA | Emerging Markets Asia | | 71.10 | 100 | 1.08 | 3.42 | 7.55% |
| EELV | Em Mkts Low | | 24.10 | 100 | 0.67 | 2.95 | 0.25% |
| DVYE | Emerging Markets Dividend | | 27.95 | 100 | 1.12 | 3.63 | 5.51% |
| SDEM | SuperDividend Em Mkts | | 26.02 | 77 | 0.13 | 1.98 | 4.95% |
| DBEM | Em Mkts Hdgd | | 24.50 | 100 | 0.57 | 2.25 | 6.2% |
| PCY | Emerging Markets Sov | | 20.13 | 75 | 1.21 | 1.98 | -2.38% |
| QEMM | Emerging Mkts StratcFacts | | 58.78 | 100 | 0.62 | 2.51 | 2.84% |
| 12Stocks.com: Charts, Trends, Fundamental Data and Performances of Emerging Markets Stocks | |
|
We now take in-depth look at all Emerging Markets stocks including charts, multi-period performances and overall trends (as measured by Smart Investing & Trading Score ). One can sort Emerging Markets stocks (click link to choose) by Daily, Weekly and by Year-to-Date performances. Also, one can sort by size of the company or by market capitalization. |
| Select Your Default Chart Type: | |||||
| |||||
| Click on stock symbol or name for detailed view. Click on to add stock symbol to your watchlist and to view watchlist. Quick View: Move mouse or cursor over "Daily" to quickly view daily technical stock chart and over "Weekly" to view weekly technical stock chart. | |||||

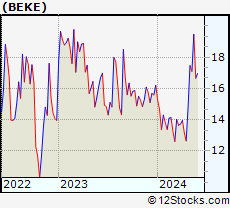 | BEKE KE Holdings Inc. |
| Sector: Financials | |
| SubSector: Real Estate Services | |
| MarketCap: 80167 Millions | |
| Recent Price: 17.47 Smart Investing & Trading Score : 100 | |
| Day Percent Change: 3.74% Day Change: 0.63 | |
| Week Change: 17.8% Year-to-date Change: 7.8% | |
| BEKE Links: Profile News Message Board | |
| Charts:- Daily , Weekly | |
| Add BEKE to Watchlist: View: Get Complete BEKE Trend Analysis ➞ | |
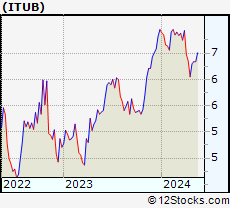 | ITUB Itau Unibanco Holding S.A. |
| Sector: Financials | |
| SubSector: Foreign Regional Banks | |
| MarketCap: 48121 Millions | |
| Recent Price: 6.34 Smart Investing & Trading Score : 49 | |
| Day Percent Change: 1.44% Day Change: 0.09 | |
| Week Change: 0.63% Year-to-date Change: -8.8% | |
| ITUB Links: Profile News Message Board | |
| Charts:- Daily , Weekly | |
| Add ITUB to Watchlist: View: Get Complete ITUB Trend Analysis ➞ | |
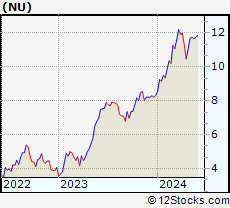 | NU Nu Holdings Ltd. |
| Sector: Financials | |
| SubSector: Banks - Diversified | |
| MarketCap: 37240 Millions | |
| Recent Price: 11.69 Smart Investing & Trading Score : 95 | |
| Day Percent Change: 6.13% Day Change: 0.67 | |
| Week Change: 5.79% Year-to-date Change: 40.2% | |
| NU Links: Profile News Message Board | |
| Charts:- Daily , Weekly | |
| Add NU to Watchlist: View: Get Complete NU Trend Analysis ➞ | |
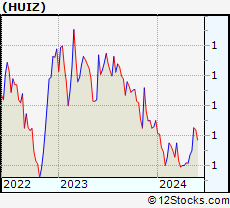 | HUIZ Huize Holding Limited |
| Sector: Financials | |
| SubSector: Insurance Brokers | |
| MarketCap: 37157 Millions | |
| Recent Price: 0.67 Smart Investing & Trading Score : 78 | |
| Day Percent Change: -11.21% Day Change: -0.08 | |
| Week Change: 8.94% Year-to-date Change: -25.6% | |
| HUIZ Links: Profile News Message Board | |
| Charts:- Daily , Weekly | |
| Add HUIZ to Watchlist: View: Get Complete HUIZ Trend Analysis ➞ | |
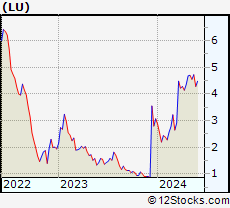 | LU Lufax Holding Ltd |
| Sector: Financials | |
| SubSector: Credit Services | |
| MarketCap: 33457 Millions | |
| Recent Price: 4.70 Smart Investing & Trading Score : 83 | |
| Day Percent Change: 1.29% Day Change: 0.06 | |
| Week Change: 0.43% Year-to-date Change: 53.1% | |
| LU Links: Profile News Message Board | |
| Charts:- Daily , Weekly | |
| Add LU to Watchlist: View: Get Complete LU Trend Analysis ➞ | |
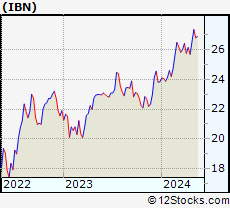 | IBN ICICI Bank Limited |
| Sector: Financials | |
| SubSector: Money Center Banks | |
| MarketCap: 31194.1 Millions | |
| Recent Price: 27.34 Smart Investing & Trading Score : 76 | |
| Day Percent Change: -0.83% Day Change: -0.23 | |
| Week Change: 3.05% Year-to-date Change: 14.7% | |
| IBN Links: Profile News Message Board | |
| Charts:- Daily , Weekly | |
| Add IBN to Watchlist: View: Get Complete IBN Trend Analysis ➞ | |
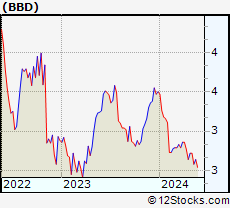 | BBD Banco Bradesco S.A. |
| Sector: Financials | |
| SubSector: Foreign Regional Banks | |
| MarketCap: 30281.7 Millions | |
| Recent Price: 2.72 Smart Investing & Trading Score : 39 | |
| Day Percent Change: 0.00% Day Change: 0.00 | |
| Week Change: 0% Year-to-date Change: -22.3% | |
| BBD Links: Profile News Message Board | |
| Charts:- Daily , Weekly | |
| Add BBD to Watchlist: View: Get Complete BBD Trend Analysis ➞ | |
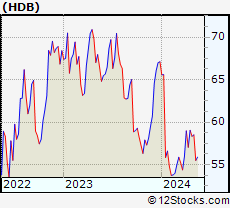 | HDB HDFC Bank Limited |
| Sector: Financials | |
| SubSector: Foreign Regional Banks | |
| MarketCap: 29894.1 Millions | |
| Recent Price: 58.51 Smart Investing & Trading Score : 93 | |
| Day Percent Change: -0.61% Day Change: -0.36 | |
| Week Change: 0.29% Year-to-date Change: -12.8% | |
| HDB Links: Profile News Message Board | |
| Charts:- Daily , Weekly | |
| Add HDB to Watchlist: View: Get Complete HDB Trend Analysis ➞ | |
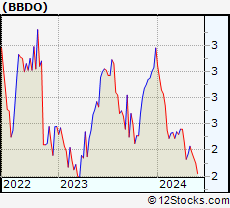 | BBDO Banco Bradesco S.A. |
| Sector: Financials | |
| SubSector: Foreign Regional Banks | |
| MarketCap: 27711.4 Millions | |
| Recent Price: 2.43 Smart Investing & Trading Score : 49 | |
| Day Percent Change: 2.10% Day Change: 0.05 | |
| Week Change: 2.53% Year-to-date Change: -23.6% | |
| BBDO Links: Profile News Message Board | |
| Charts:- Daily , Weekly | |
| Add BBDO to Watchlist: View: Get Complete BBDO Trend Analysis ➞ | |
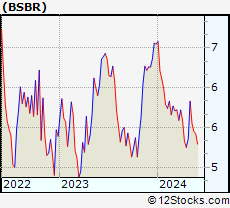 | BSBR Banco Santander (Brasil) S.A. |
| Sector: Financials | |
| SubSector: Foreign Regional Banks | |
| MarketCap: 21961.4 Millions | |
| Recent Price: 5.83 Smart Investing & Trading Score : 100 | |
| Day Percent Change: 1.57% Day Change: 0.09 | |
| Week Change: 8.77% Year-to-date Change: -11.0% | |
| BSBR Links: Profile News Message Board | |
| Charts:- Daily , Weekly | |
| Add BSBR to Watchlist: View: Get Complete BSBR Trend Analysis ➞ | |
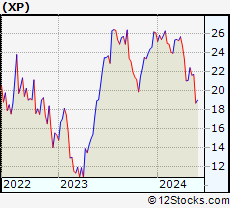 | XP XP Inc. |
| Sector: Financials | |
| SubSector: Asset Management | |
| MarketCap: 12990.3 Millions | |
| Recent Price: 22.39 Smart Investing & Trading Score : 49 | |
| Day Percent Change: 5.96% Day Change: 1.26 | |
| Week Change: 6.32% Year-to-date Change: -14.1% | |
| XP Links: Profile News Message Board | |
| Charts:- Daily , Weekly | |
| Add XP to Watchlist: View: Get Complete XP Trend Analysis ➞ | |
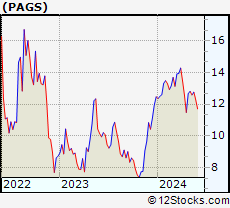 | PAGS PagSeguro Digital Ltd. |
| Sector: Financials | |
| SubSector: Credit Services | |
| MarketCap: 6500.78 Millions | |
| Recent Price: 12.81 Smart Investing & Trading Score : 69 | |
| Day Percent Change: 1.75% Day Change: 0.22 | |
| Week Change: 1.03% Year-to-date Change: 2.7% | |
| PAGS Links: Profile News Message Board | |
| Charts:- Daily , Weekly | |
| Add PAGS to Watchlist: View: Get Complete PAGS Trend Analysis ➞ | |
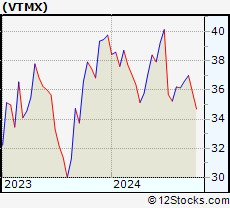 | VTMX Vesta Financials Corp SAB de CV |
| Sector: Financials | |
| SubSector: REIT - Industrial | |
| MarketCap: 2270 Millions | |
| Recent Price: 36.15 Smart Investing & Trading Score : 83 | |
| Day Percent Change: 0.08% Day Change: 0.03 | |
| Week Change: -0.17% Year-to-date Change: -9.1% | |
| VTMX Links: Profile News Message Board | |
| Charts:- Daily , Weekly | |
| Add VTMX to Watchlist: View: Get Complete VTMX Trend Analysis ➞ | |
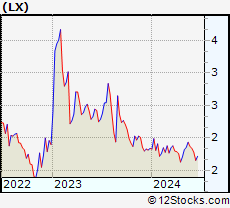 | LX LexinFintech Holdings Ltd. |
| Sector: Financials | |
| SubSector: Credit Services | |
| MarketCap: 1674.18 Millions | |
| Recent Price: 1.82 Smart Investing & Trading Score : 64 | |
| Day Percent Change: 2.25% Day Change: 0.04 | |
| Week Change: 6.43% Year-to-date Change: -1.1% | |
| LX Links: Profile News Message Board | |
| Charts:- Daily , Weekly | |
| Add LX to Watchlist: View: Get Complete LX Trend Analysis ➞ | |
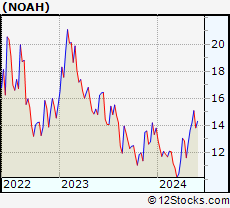 | NOAH Noah Holdings Limited |
| Sector: Financials | |
| SubSector: Asset Management | |
| MarketCap: 1495.33 Millions | |
| Recent Price: 13.66 Smart Investing & Trading Score : 100 | |
| Day Percent Change: 4.35% Day Change: 0.57 | |
| Week Change: 7.39% Year-to-date Change: -1.1% | |
| NOAH Links: Profile News Message Board | |
| Charts:- Daily , Weekly | |
| Add NOAH to Watchlist: View: Get Complete NOAH Trend Analysis ➞ | |
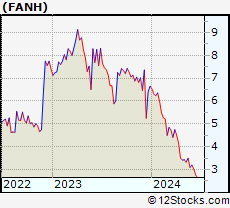 | FANH Fanhua Inc. |
| Sector: Financials | |
| SubSector: Insurance Brokers | |
| MarketCap: 1436.67 Millions | |
| Recent Price: 3.43 Smart Investing & Trading Score : 42 | |
| Day Percent Change: 0.29% Day Change: 0.01 | |
| Week Change: 0.29% Year-to-date Change: -48.4% | |
| FANH Links: Profile News Message Board | |
| Charts:- Daily , Weekly | |
| Add FANH to Watchlist: View: Get Complete FANH Trend Analysis ➞ | |
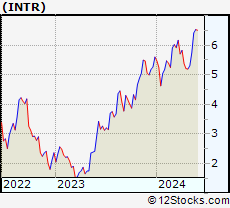 | INTR Inter & Co, Inc. |
| Sector: Financials | |
| SubSector: Banks - Regional | |
| MarketCap: 1250 Millions | |
| Recent Price: 5.32 Smart Investing & Trading Score : 49 | |
| Day Percent Change: 4.01% Day Change: 0.21 | |
| Week Change: 2.21% Year-to-date Change: -5.2% | |
| INTR Links: Profile News Message Board | |
| Charts:- Daily , Weekly | |
| Add INTR to Watchlist: View: Get Complete INTR Trend Analysis ➞ | |
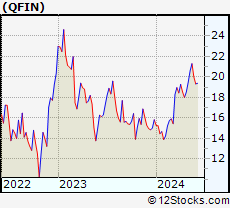 | QFIN 360 Finance, Inc. |
| Sector: Financials | |
| SubSector: Credit Services | |
| MarketCap: 956.208 Millions | |
| Recent Price: 19.50 Smart Investing & Trading Score : 95 | |
| Day Percent Change: -1.91% Day Change: -0.38 | |
| Week Change: 5.29% Year-to-date Change: 23.3% | |
| QFIN Links: Profile News Message Board | |
| Charts:- Daily , Weekly | |
| Add QFIN to Watchlist: View: Get Complete QFIN Trend Analysis ➞ | |
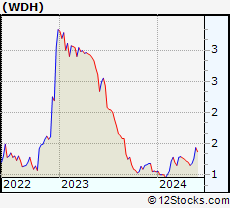 | WDH Waterdrop Inc. |
| Sector: Financials | |
| SubSector: Insurance - Diversified | |
| MarketCap: 874 Millions | |
| Recent Price: 1.15 Smart Investing & Trading Score : 10 | |
| Day Percent Change: -2.95% Day Change: -0.04 | |
| Week Change: -4.17% Year-to-date Change: 9.8% | |
| WDH Links: Profile News Message Board | |
| Charts:- Daily , Weekly | |
| Add WDH to Watchlist: View: Get Complete WDH Trend Analysis ➞ | |
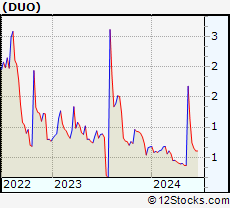 | DUO Fangdd Network Group Ltd. |
| Sector: Financials | |
| SubSector: Property Management | |
| MarketCap: 783.142 Millions | |
| Recent Price: 0.37 Smart Investing & Trading Score : 10 | |
| Day Percent Change: -4.96% Day Change: -0.02 | |
| Week Change: -8.43% Year-to-date Change: -45.6% | |
| DUO Links: Profile News Message Board | |
| Charts:- Daily , Weekly | |
| Add DUO to Watchlist: View: Get Complete DUO Trend Analysis ➞ | |
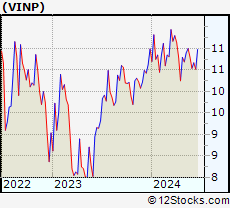 | VINP Vinci Partners Investments Ltd. |
| Sector: Financials | |
| SubSector: Asset Management | |
| MarketCap: 537 Millions | |
| Recent Price: 10.69 Smart Investing & Trading Score : 20 | |
| Day Percent Change: -0.28% Day Change: -0.03 | |
| Week Change: -0.97% Year-to-date Change: -2.7% | |
| VINP Links: Profile News Message Board | |
| Charts:- Daily , Weekly | |
| Add VINP to Watchlist: View: Get Complete VINP Trend Analysis ➞ | |
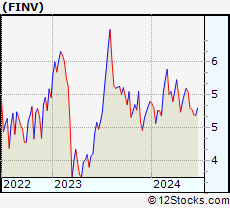 | FINV FinVolution Group |
| Sector: Financials | |
| SubSector: Credit Services | |
| MarketCap: 476.208 Millions | |
| Recent Price: 5.01 Smart Investing & Trading Score : 49 | |
| Day Percent Change: -0.40% Day Change: -0.02 | |
| Week Change: 2.45% Year-to-date Change: 2.2% | |
| FINV Links: Profile News Message Board | |
| Charts:- Daily , Weekly | |
| Add FINV to Watchlist: View: Get Complete FINV Trend Analysis ➞ | |
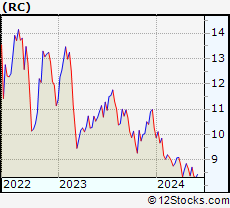 | RC Ready Capital Corporation |
| Sector: Financials | |
| SubSector: Mortgage Investment | |
| MarketCap: 358.039 Millions | |
| Recent Price: 8.66 Smart Investing & Trading Score : 57 | |
| Day Percent Change: 0.46% Day Change: 0.04 | |
| Week Change: -2.15% Year-to-date Change: -15.5% | |
| RC Links: Profile News Message Board | |
| Charts:- Daily , Weekly | |
| Add RC to Watchlist: View: Get Complete RC Trend Analysis ➞ | |
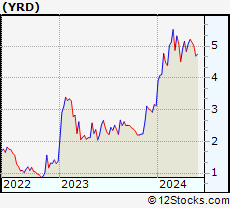 | YRD Yiren Digital Ltd. |
| Sector: Financials | |
| SubSector: Credit Services | |
| MarketCap: 330.208 Millions | |
| Recent Price: 5.21 Smart Investing & Trading Score : 78 | |
| Day Percent Change: -4.40% Day Change: -0.24 | |
| Week Change: 2.56% Year-to-date Change: 67.0% | |
| YRD Links: Profile News Message Board | |
| Charts:- Daily , Weekly | |
| Add YRD to Watchlist: View: Get Complete YRD Trend Analysis ➞ | |
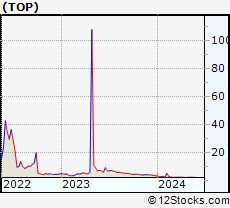 | TOP TOP Financial Group Limited |
| Sector: Financials | |
| SubSector: Capital Markets | |
| MarketCap: 329 Millions | |
| Recent Price: 2.62 Smart Investing & Trading Score : 62 | |
| Day Percent Change: 1.95% Day Change: 0.05 | |
| Week Change: -1.87% Year-to-date Change: -29.6% | |
| TOP Links: Profile News Message Board | |
| Charts:- Daily , Weekly | |
| Add TOP to Watchlist: View: Get Complete TOP Trend Analysis ➞ | |
| For tabular summary view of above stock list: Summary View ➞ 0 - 25 , 25 - 50 | ||
| Click To Change The Sort Order: By Market Cap or Company Size Performance: Year-to-date, Week and Day | |
| Select Chart Type: | ||
|
Best Stocks Today 12Stocks.com |
© 2024 12Stocks.com Terms & Conditions Privacy Contact Us
All Information Provided Only For Education And Not To Be Used For Investing or Trading. See Terms & Conditions


One More Thing ... Get Best Stocks Delivered Daily!
Never Ever Miss A Move With Our Top Ten Stocks Lists
Find Best Stocks In Any Market - Bull or Bear Market
Take A Peek At Our Top Ten Stocks Lists: Daily, Weekly, Year-to-Date & Top Trends
Find Best Stocks In Any Market - Bull or Bear Market
Take A Peek At Our Top Ten Stocks Lists: Daily, Weekly, Year-to-Date & Top Trends
Emerging Markets Stocks With Best Up Trends [0-bearish to 100-bullish]: SunCar [100], Hesai [100], Trip.com [100], Noah [100], Weibo [100], United Microelectronics[100], KE [100], Tencent Music[100], Huazhu [100], BrasilAgro -[100], America Movil[100]
Best Emerging Markets Stocks Year-to-Date:
U Power[3264.96%], DouYu [854.74%], MicroCloud Hologram[553.24%], China Liberal[515.21%], Yatsen Holding[493.22%], Zhongchao [338.24%], Uxin [188.16%], GigaCloud [97.11%], QuantaSing [95.06%], Cheetah Mobile[74.12%], Smart Share[68.93%] Best Emerging Markets Stocks This Week:
Smart Share[40.05%], Dingdong (Cayman)[24.6%], NIO [24.05%], OneConnect Financial[21%], 21Vianet [20.89%], KE [17.8%], U Power[17.77%], Hesai [17.05%], Lixiang Education[16.68%], AMTD Digital[16.36%], XPeng [15.56%] Best Emerging Markets Stocks Daily:
OneConnect Financial[12.04%], U Power[9.44%], SunCar [9.43%], Azul S.A[8.63%], AMTD Digital[8.33%], Burning Rock[6.51%], Nu [6.13%], Grupo Televisa[6.02%], XP [5.96%], Dingdong (Cayman)[5.72%], Studio City[5.54%]