
 Login Sign Up


| |||||
 |  | ||||

| 12Stocks.com Market Intelligence |
Best Emerging Markets Stocks
| In a hurry? Emerging Markets Stocks Lists: Trends Table, Stock Charts
Sort Emerging Markets stocks: Daily, Weekly, Year-to-Date, Market Cap & Trends. Filter Emerging Markets stocks list by sector: Show all, Tech, Finance, Energy, Staples, Retail, Industrial, Materials, Utilities and HealthCare Filter Emerging Markets stocks list by size:All Large Medium Small |
| 12Stocks.com Emerging Markets Stocks Performances & Trends Daily | |||||||||
|
|  The overall Smart Investing & Trading Score is 83 (0-bearish to 100-bullish) which puts Emerging Markets index in short term bullish trend. The Smart Investing & Trading Score from previous trading session is 61 and hence an improvement of trend.
| ||||||||
Here are the Smart Investing & Trading Scores of the most requested Emerging Markets stocks at 12Stocks.com (click stock name for detailed review):
|


| 12Stocks.com: Top Performing Emerging Markets Index Stocks | ||||||||||||||||||||||||||||||||||||||||||||||||
 The top performing Emerging Markets Index stocks year to date are
Now, more recently, over last week, the top performing Emerging Markets Index stocks on the move are


|
||||||||||||||||||||||||||||||||||||||||||||||||
| 12Stocks.com: Investing in Emerging Markets Index with Stocks | |
|
The following table helps investors and traders sort through current performance and trends (as measured by Smart Investing & Trading Score ) of various
stocks in the Emerging Markets Index. Quick View: Move mouse or cursor over stock symbol (ticker) to view short-term technical chart and over stock name to view long term chart. Click on  to add stock symbol to your watchlist and to add stock symbol to your watchlist and  to view watchlist. Click on any ticker or stock name for detailed market intelligence report for that stock. to view watchlist. Click on any ticker or stock name for detailed market intelligence report for that stock. |
12Stocks.com Performance of Stocks in Emerging Markets Index
| Ticker | Stock Name | Watchlist | Category | Recent Price | Smart Investing & Trading Score | Change % | Weekly Change% |
| STG | Sunlands |   | Services & Goods | 6.65 | 42 | 0.00% | 0.00% |
| YI | 111 | | Services & Goods | 1.08 | 20 | 0.00% | 0.00% |
| BEDU | Bright Scholar | | Services & Goods | 2.00 | 36 | 0.00% | 0.00% |
| GHG | GreenTree Hospitality | | Services & Goods | 2.59 | 10 | 0.00% | 0.00% |
| SVA | Sinovac Biotech | | Health Care | 6.47 | 27 | 0.00% | 0.00% |
| SIM | Grupo Simec | | Materials | 30.00 | 20 | 0.00% | 0.00% |
| CHT | Chunghwa Telecom | | Technology | 39.57 | 71 | -0.13% | -0.08% |
| AFYA | Afya | | Services & Goods | 17.02 | 64 | -1.59% | -0.09% |
| EBON | Ebang | | Technology | 7.09 | 20 | -1.39% | -0.14% |
| SMI | Semiconductor | | Technology | 46.26 | 50 | -0.28% | -0.28% |
| BZUN | Baozun | | Services & Goods | 2.35 | 41 | 0.00% | -0.42% |
| RDY | Dr. Reddy | | Health Care | 71.55 | 25 | -0.21% | -0.42% |
| UXIN | Uxin | | Technology | 2.13 | 10 | 0.00% | -0.47% |
| ABEV | Ambev S.A | | Consumer Staples | 2.10 | 17 | 0.96% | -0.47% |
| YMM | Full Truck | | Technology | 8.96 | 78 | 0.11% | -0.55% |
| OMAB | Grupo Aeroportuario | | Transports | 68.38 | 10 | 0.00% | -0.58% |
| CANG | Cango | | Technology | 1.66 | 53 | 0.61% | -0.60% |
| API | Agora | | Technology | 2.38 | 7 | -0.42% | -0.63% |
| SBSW | Sibanye Stillwater | | Materials | 4.53 | 35 | 0.89% | -0.66% |
| JFIN | Jiayin | | Technology | 6.10 | 0 | -0.65% | -0.81% |
| DAO | Youdao | | Technology | 3.68 | 0 | 0.27% | -0.81% |
| LXEH | Lixiang Education | | Consumer Staples | 0.36 | 32 | -0.83% | -0.83% |
| ERJ | Embraer S.A | | Industrials | 27.50 | 39 | -0.90% | -0.83% |
| LND | BrasilAgro - | | Financials | 4.73 | 18 | 0.64% | -0.84% |
| EH | EHang | | Industrials | 14.14 | 10 | 0.78% | -0.91% |
| For chart view version of above stock list: Chart View ➞ 0 - 25 , 25 - 50 , 50 - 75 , 75 - 100 , 100 - 125 , 125 - 150 , 150 - 175 , 175 - 200 | ||
 | Click To Change The Sort Order: By Market Cap or Company Size Performance: Year-to-date, Week and Day |  |
|
Get the most comprehensive stock market coverage daily at 12Stocks.com ➞ Best Stocks Today ➞ Best Stocks Weekly ➞ Best Stocks Year-to-Date ➞ Best Stocks Trends ➞  Best Stocks Today 12Stocks.com Best Nasdaq Stocks ➞ Best S&P 500 Stocks ➞ Best Tech Stocks ➞ Best Biotech Stocks ➞ |
| Detailed Overview of Emerging Markets Stocks |
| Emerging Markets Technical Overview, Leaders & Laggards, Top Emerging Markets ETF Funds & Detailed Emerging Markets Stocks List, Charts, Trends & More |
| Emerging Markets: Technical Analysis, Trends & YTD Performance | |
 EEM Weekly Chart |
|
| Long Term Trend: Very Good | |
| Medium Term Trend: Good | |
 EEM Daily Chart |
|
| Short Term Trend: Very Good | |
| Overall Trend Score: 83 | |
| YTD Performance: 6.52% | |
| **Trend Scores & Views Are Only For Educational Purposes And Not For Investing | |
| 12Stocks.com: Investing in Emerging Markets Index using Exchange Traded Funds | |
|
The following table shows list of key exchange traded funds (ETF) that
help investors play Emerging Markets stock market. For detailed view, check out our ETF Funds section of our website. Quick View: Move mouse or cursor over ETF symbol (ticker) to view short-term technical chart and over ETF name to view long term chart. Click on ticker or stock name for detailed view. Click on to add stock symbol to your watchlist and to view watchlist. |
12Stocks.com List of ETFs that track Emerging Markets Index
| Ticker | ETF Name | Watchlist | Recent Price | Smart Investing & Trading Score | Change % | Week % | Year-to-date % |
| EEM | Emerging Markets | | 42.83 | 83 | 0.78 | 1.42 | 6.52% |
| VWO | Emerging Markets | | 44.31 | 83 | 0.69 | 1.25 | 7.8% |
| EWX | Emerging Markets Small | | 58.80 | 100 | 0.39 | 0.8 | 4.14% |
| EET | Emerging Markets | | 54.68 | 95 | -0.22 | 1.33 | 7.51% |
| EDC | Emrg Mkts Bull | | 33.49 | 90 | 1.89 | 3.78 | 10.06% |
| EUM | Short Emerging | | 13.50 | 0 | -0.41 | -1.1 | -4.59% |
| EMIF | Emerging Markets Infrastructure | | 21.51 | 18 | 0.19 | -1.33 | 0.51% |
| CEW | Emerging Currency Strat | | 17.68 | 31 | 0.05 | -0.28 | -1.8% |
| EBND | Em Mkts Lcl | | 19.95 | 28 | 0.53 | 0.48 | -6.05% |
| EMCB | Emerging Markets Corp | | 64.84 | 58 | 0.07 | 0 | 1.48% |
| EEMA | Emerging Markets Asia | | 72.79 | 95 | 0.00 | 1.08 | 10.1% |
| SDEM | SuperDividend Em Mkts | | 25.97 | 43 | 0.93 | 1.09 | 4.73% |
| DBEM | Em Mkts Hdgd | | 24.97 | 100 | -0.30 | 0.62 | 8.21% |
| QEMM | Emerging Mkts StratcFacts | | 58.46 | 70 | 0.33 | 0.71 | 2.28% |
| 12Stocks.com: Charts, Trends, Fundamental Data and Performances of Emerging Markets Stocks | |
|
We now take in-depth look at all Emerging Markets stocks including charts, multi-period performances and overall trends (as measured by Smart Investing & Trading Score ). One can sort Emerging Markets stocks (click link to choose) by Daily, Weekly and by Year-to-Date performances. Also, one can sort by size of the company or by market capitalization. |
| Select Your Default Chart Type: | |||||
| |||||
| Click on stock symbol or name for detailed view. Click on to add stock symbol to your watchlist and to view watchlist. Quick View: Move mouse or cursor over "Daily" to quickly view daily technical stock chart and over "Weekly" to view weekly technical stock chart. | |||||

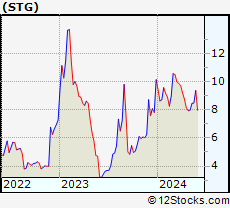 | STG Sunlands Technology Group |
| Sector: Services & Goods | |
| SubSector: Education & Training Services | |
| MarketCap: 295.706 Millions | |
| Recent Price: 6.65 Smart Investing & Trading Score : 42 | |
| Day Percent Change: 0.00% Day Change: 0.00 | |
| Week Change: 0% Year-to-date Change: -34.6% | |
| STG Links: Profile News Message Board | |
| Charts:- Daily , Weekly | |
| Add STG to Watchlist: View: Get Complete STG Trend Analysis ➞ | |
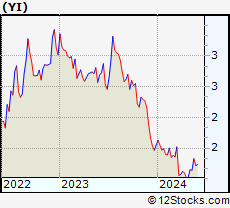 | YI 111, Inc. |
| Sector: Services & Goods | |
| SubSector: Drug Stores | |
| MarketCap: 520.351 Millions | |
| Recent Price: 1.08 Smart Investing & Trading Score : 20 | |
| Day Percent Change: 0.00% Day Change: 0.00 | |
| Week Change: 0% Year-to-date Change: -30.3% | |
| YI Links: Profile News Message Board | |
| Charts:- Daily , Weekly | |
| Add YI to Watchlist: View: Get Complete YI Trend Analysis ➞ | |
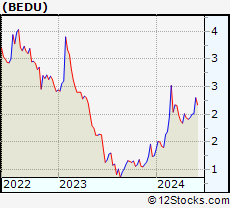 | BEDU Bright Scholar Education Holdings Limited |
| Sector: Services & Goods | |
| SubSector: Education & Training Services | |
| MarketCap: 792.406 Millions | |
| Recent Price: 2.00 Smart Investing & Trading Score : 36 | |
| Day Percent Change: 0.00% Day Change: 0.00 | |
| Week Change: 0% Year-to-date Change: 60.0% | |
| BEDU Links: Profile News Message Board | |
| Charts:- Daily , Weekly | |
| Add BEDU to Watchlist: View: Get Complete BEDU Trend Analysis ➞ | |
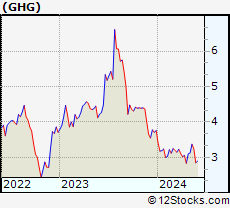 | GHG GreenTree Hospitality Group Ltd. |
| Sector: Services & Goods | |
| SubSector: Lodging | |
| MarketCap: 1195.36 Millions | |
| Recent Price: 2.59 Smart Investing & Trading Score : 10 | |
| Day Percent Change: 0.00% Day Change: 0.00 | |
| Week Change: 0% Year-to-date Change: -31.1% | |
| GHG Links: Profile News Message Board | |
| Charts:- Daily , Weekly | |
| Add GHG to Watchlist: View: Get Complete GHG Trend Analysis ➞ | |
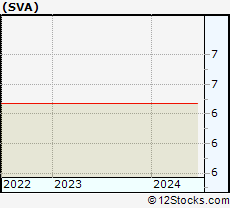 | SVA Sinovac Biotech Ltd. |
| Sector: Health Care | |
| SubSector: Biotechnology | |
| MarketCap: 336.88 Millions | |
| Recent Price: 6.47 Smart Investing & Trading Score : 27 | |
| Day Percent Change: 0.00% Day Change: 0.00 | |
| Week Change: 0% Year-to-date Change: 0.0% | |
| SVA Links: Profile News Message Board | |
| Charts:- Daily , Weekly | |
| Add SVA to Watchlist: View: Get Complete SVA Trend Analysis ➞ | |
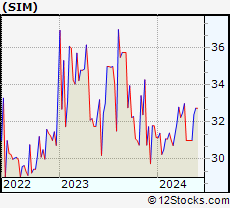 | SIM Grupo Simec, S.A.B. de C.V. |
| Sector: Materials | |
| SubSector: Steel & Iron | |
| MarketCap: 1418.28 Millions | |
| Recent Price: 30.00 Smart Investing & Trading Score : 20 | |
| Day Percent Change: 0.00% Day Change: 0.00 | |
| Week Change: 0% Year-to-date Change: -3.8% | |
| SIM Links: Profile News Message Board | |
| Charts:- Daily , Weekly | |
| Add SIM to Watchlist: View: Get Complete SIM Trend Analysis ➞ | |
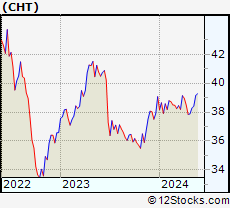 | CHT Chunghwa Telecom Co., Ltd. |
| Sector: Technology | |
| SubSector: Telecom Services - Domestic | |
| MarketCap: 28101.3 Millions | |
| Recent Price: 39.57 Smart Investing & Trading Score : 71 | |
| Day Percent Change: -0.13% Day Change: -0.05 | |
| Week Change: -0.08% Year-to-date Change: 1.3% | |
| CHT Links: Profile News Message Board | |
| Charts:- Daily , Weekly | |
| Add CHT to Watchlist: View: Get Complete CHT Trend Analysis ➞ | |
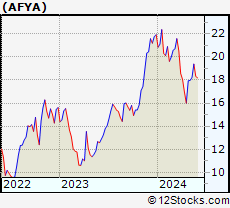 | AFYA Afya Limited |
| Sector: Services & Goods | |
| SubSector: Education & Training Services | |
| MarketCap: 1559.26 Millions | |
| Recent Price: 17.02 Smart Investing & Trading Score : 64 | |
| Day Percent Change: -1.59% Day Change: -0.27 | |
| Week Change: -0.09% Year-to-date Change: -22.4% | |
| AFYA Links: Profile News Message Board | |
| Charts:- Daily , Weekly | |
| Add AFYA to Watchlist: View: Get Complete AFYA Trend Analysis ➞ | |
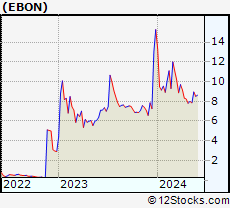 | EBON Ebang International Holdings Inc. |
| Sector: Technology | |
| SubSector: Computer Hardware | |
| MarketCap: 33787 Millions | |
| Recent Price: 7.09 Smart Investing & Trading Score : 20 | |
| Day Percent Change: -1.39% Day Change: -0.10 | |
| Week Change: -0.14% Year-to-date Change: -53.6% | |
| EBON Links: Profile News Message Board | |
| Charts:- Daily , Weekly | |
| Add EBON to Watchlist: View: Get Complete EBON Trend Analysis ➞ | |
 | SMI Semiconductor Manufacturing International Corporation |
| Sector: Technology | |
| SubSector: Semiconductor - Integrated Circuits | |
| MarketCap: 6287.56 Millions | |
| Recent Price: 46.26 Smart Investing & Trading Score : 50 | |
| Day Percent Change: -0.28% Day Change: -0.13 | |
| Week Change: -0.28% Year-to-date Change: -0.4% | |
| SMI Links: Profile News Message Board | |
| Charts:- Daily , Weekly | |
| Add SMI to Watchlist: View: Get Complete SMI Trend Analysis ➞ | |
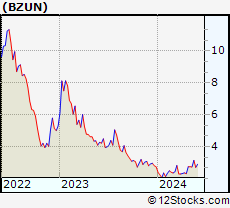 | BZUN Baozun Inc. |
| Sector: Services & Goods | |
| SubSector: Catalog & Mail Order Houses | |
| MarketCap: 1668.92 Millions | |
| Recent Price: 2.35 Smart Investing & Trading Score : 41 | |
| Day Percent Change: 0.00% Day Change: 0.00 | |
| Week Change: -0.42% Year-to-date Change: -14.2% | |
| BZUN Links: Profile News Message Board | |
| Charts:- Daily , Weekly | |
| Add BZUN to Watchlist: View: Get Complete BZUN Trend Analysis ➞ | |
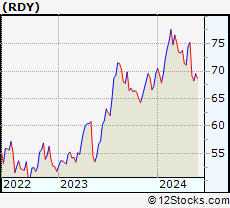 | RDY Dr. Reddy s Laboratories Limited |
| Sector: Health Care | |
| SubSector: Drug Manufacturers - Other | |
| MarketCap: 6590.23 Millions | |
| Recent Price: 71.55 Smart Investing & Trading Score : 25 | |
| Day Percent Change: -0.21% Day Change: -0.15 | |
| Week Change: -0.42% Year-to-date Change: 2.8% | |
| RDY Links: Profile News Message Board | |
| Charts:- Daily , Weekly | |
| Add RDY to Watchlist: View: Get Complete RDY Trend Analysis ➞ | |
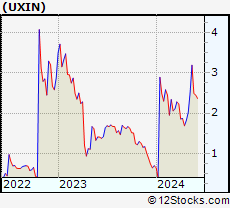 | UXIN Uxin Limited |
| Sector: Technology | |
| SubSector: Internet Information Providers | |
| MarketCap: 414.58 Millions | |
| Recent Price: 2.13 Smart Investing & Trading Score : 10 | |
| Day Percent Change: 0.00% Day Change: 0.00 | |
| Week Change: -0.47% Year-to-date Change: 203.9% | |
| UXIN Links: Profile News Message Board | |
| Charts:- Daily , Weekly | |
| Add UXIN to Watchlist: View: Get Complete UXIN Trend Analysis ➞ | |
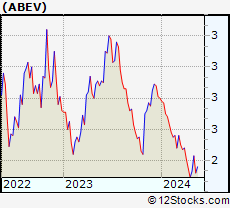 | ABEV Ambev S.A. |
| Sector: Consumer Staples | |
| SubSector: Beverages - Brewers | |
| MarketCap: 37753.5 Millions | |
| Recent Price: 2.10 Smart Investing & Trading Score : 17 | |
| Day Percent Change: 0.96% Day Change: 0.02 | |
| Week Change: -0.47% Year-to-date Change: -25.0% | |
| ABEV Links: Profile News Message Board | |
| Charts:- Daily , Weekly | |
| Add ABEV to Watchlist: View: Get Complete ABEV Trend Analysis ➞ | |
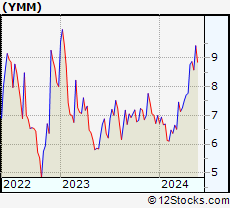 | YMM Full Truck Alliance Co. Ltd. |
| Sector: Technology | |
| SubSector: Software - Application | |
| MarketCap: 6960 Millions | |
| Recent Price: 8.96 Smart Investing & Trading Score : 78 | |
| Day Percent Change: 0.11% Day Change: 0.01 | |
| Week Change: -0.55% Year-to-date Change: 28.1% | |
| YMM Links: Profile News Message Board | |
| Charts:- Daily , Weekly | |
| Add YMM to Watchlist: View: Get Complete YMM Trend Analysis ➞ | |
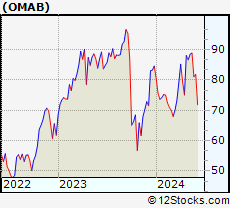 | OMAB Grupo Aeroportuario del Centro Norte, S.A.B. de C.V. |
| Sector: Transports | |
| SubSector: Air Services, Other | |
| MarketCap: 1196.38 Millions | |
| Recent Price: 68.38 Smart Investing & Trading Score : 10 | |
| Day Percent Change: 0.00% Day Change: 0.00 | |
| Week Change: -0.58% Year-to-date Change: -19.2% | |
| OMAB Links: Profile News Message Board | |
| Charts:- Daily , Weekly | |
| Add OMAB to Watchlist: View: Get Complete OMAB Trend Analysis ➞ | |
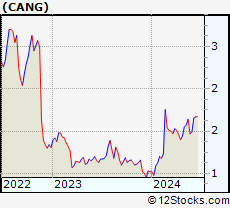 | CANG Cango Inc. |
| Sector: Technology | |
| SubSector: Internet Information Providers | |
| MarketCap: 947.48 Millions | |
| Recent Price: 1.66 Smart Investing & Trading Score : 53 | |
| Day Percent Change: 0.61% Day Change: 0.01 | |
| Week Change: -0.6% Year-to-date Change: 62.8% | |
| CANG Links: Profile News Message Board | |
| Charts:- Daily , Weekly | |
| Add CANG to Watchlist: View: Get Complete CANG Trend Analysis ➞ | |
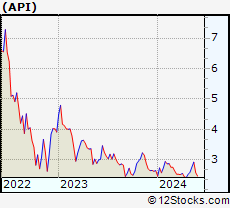 | API Agora, Inc. |
| Sector: Technology | |
| SubSector: Software Application | |
| MarketCap: 42787 Millions | |
| Recent Price: 2.38 Smart Investing & Trading Score : 7 | |
| Day Percent Change: -0.42% Day Change: -0.01 | |
| Week Change: -0.63% Year-to-date Change: -10.0% | |
| API Links: Profile News Message Board | |
| Charts:- Daily , Weekly | |
| Add API to Watchlist: View: Get Complete API Trend Analysis ➞ | |
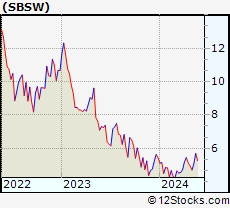 | SBSW Sibanye Stillwater Limited |
| Sector: Materials | |
| SubSector: Gold | |
| MarketCap: 3853.99 Millions | |
| Recent Price: 4.53 Smart Investing & Trading Score : 35 | |
| Day Percent Change: 0.89% Day Change: 0.04 | |
| Week Change: -0.66% Year-to-date Change: -16.6% | |
| SBSW Links: Profile News Message Board | |
| Charts:- Daily , Weekly | |
| Add SBSW to Watchlist: View: Get Complete SBSW Trend Analysis ➞ | |
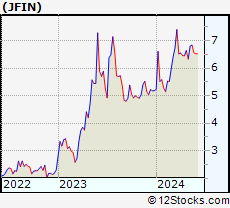 | JFIN Jiayin Group Inc. |
| Sector: Technology | |
| SubSector: Internet Information Providers | |
| MarketCap: 131.48 Millions | |
| Recent Price: 6.10 Smart Investing & Trading Score : 0 | |
| Day Percent Change: -0.65% Day Change: -0.04 | |
| Week Change: -0.81% Year-to-date Change: 17.8% | |
| JFIN Links: Profile News Message Board | |
| Charts:- Daily , Weekly | |
| Add JFIN to Watchlist: View: Get Complete JFIN Trend Analysis ➞ | |
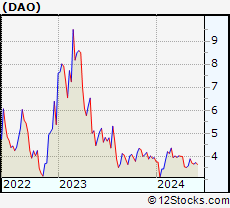 | DAO Youdao, Inc. |
| Sector: Technology | |
| SubSector: Internet Information Providers | |
| MarketCap: 2073.2 Millions | |
| Recent Price: 3.68 Smart Investing & Trading Score : 0 | |
| Day Percent Change: 0.27% Day Change: 0.01 | |
| Week Change: -0.81% Year-to-date Change: -6.6% | |
| DAO Links: Profile News Message Board | |
| Charts:- Daily , Weekly | |
| Add DAO to Watchlist: View: Get Complete DAO Trend Analysis ➞ | |
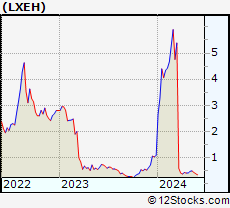 | LXEH Lixiang Education Holding Co., Ltd. |
| Sector: Consumer Staples | |
| SubSector: Education & Training Services | |
| MarketCap: 12347 Millions | |
| Recent Price: 0.36 Smart Investing & Trading Score : 32 | |
| Day Percent Change: -0.83% Day Change: 0.00 | |
| Week Change: -0.83% Year-to-date Change: -66.8% | |
| LXEH Links: Profile News Message Board | |
| Charts:- Daily , Weekly | |
| Add LXEH to Watchlist: View: Get Complete LXEH Trend Analysis ➞ | |
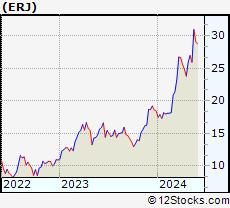 | ERJ Embraer S.A. |
| Sector: Industrials | |
| SubSector: Aerospace/Defense Products & Services | |
| MarketCap: 1623.71 Millions | |
| Recent Price: 27.50 Smart Investing & Trading Score : 39 | |
| Day Percent Change: -0.90% Day Change: -0.25 | |
| Week Change: -0.83% Year-to-date Change: 49.1% | |
| ERJ Links: Profile News Message Board | |
| Charts:- Daily , Weekly | |
| Add ERJ to Watchlist: View: Get Complete ERJ Trend Analysis ➞ | |
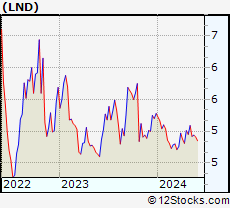 | LND BrasilAgro - Companhia Brasileira de Propriedades Agricolas |
| Sector: Financials | |
| SubSector: Property Management | |
| MarketCap: 157.842 Millions | |
| Recent Price: 4.73 Smart Investing & Trading Score : 18 | |
| Day Percent Change: 0.64% Day Change: 0.03 | |
| Week Change: -0.84% Year-to-date Change: -10.4% | |
| LND Links: Profile News Message Board | |
| Charts:- Daily , Weekly | |
| Add LND to Watchlist: View: Get Complete LND Trend Analysis ➞ | |
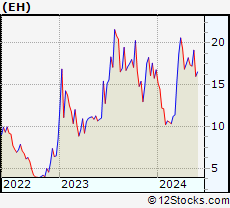 | EH EHang Holdings Limited |
| Sector: Industrials | |
| SubSector: Aerospace/Defense Products & Services | |
| MarketCap: 513.401 Millions | |
| Recent Price: 14.14 Smart Investing & Trading Score : 10 | |
| Day Percent Change: 0.78% Day Change: 0.11 | |
| Week Change: -0.91% Year-to-date Change: -15.8% | |
| EH Links: Profile News Message Board | |
| Charts:- Daily , Weekly | |
| Add EH to Watchlist: View: Get Complete EH Trend Analysis ➞ | |
| For tabular summary view of above stock list: Summary View ➞ 0 - 25 , 25 - 50 , 50 - 75 , 75 - 100 , 100 - 125 , 125 - 150 , 150 - 175 , 175 - 200 | ||
| Click To Change The Sort Order: By Market Cap or Company Size Performance: Year-to-date, Week and Day | |
| Select Chart Type: | ||
|
Best Stocks Today 12Stocks.com |
© 2024 12Stocks.com Terms & Conditions Privacy Contact Us
All Information Provided Only For Education And Not To Be Used For Investing or Trading. See Terms & Conditions


One More Thing ... Get Best Stocks Delivered Daily!
Never Ever Miss A Move With Our Top Ten Stocks Lists
Find Best Stocks In Any Market - Bull or Bear Market
Take A Peek At Our Top Ten Stocks Lists: Daily, Weekly, Year-to-Date & Top Trends
Find Best Stocks In Any Market - Bull or Bear Market
Take A Peek At Our Top Ten Stocks Lists: Daily, Weekly, Year-to-Date & Top Trends
Emerging Markets Stocks With Best Up Trends [0-bearish to 100-bullish]: ASE [100], Taiwan Semiconductor[100], United Microelectronics[100], China Online[100], Atour Lifestyle[100], MOGU [100], HDFC Bank[95], X Financial[95], Bilibili [95], U Power[90], CI&T [90]
Best Emerging Markets Stocks Year-to-Date:
U Power[3744.87%], China Liberal[1457.61%], DouYu [954.74%], Burning Rock[663.29%], Yatsen Holding[355.17%], MicroCloud Hologram[216.55%], Zhongchao [214.98%], Zhihu [206.15%], Uxin [203.85%], Cheetah Mobile[116.23%], Smart Share[103.88%] Best Emerging Markets Stocks This Week:
Fangdd Network[17.16%], TH [9.81%], Hywin [9.4%], Companhia Siderurgica[9.33%], China Online[9.22%], iHuman [8.38%], Sasol [7.9%], MingZhu Logistics[7.58%], Bilibili [7.5%], U Power[7.49%], Lufax Holding[6.59%] Best Emerging Markets Stocks Daily:
Companhia Siderurgica[11.31%], TH [9.81%], China Liberal[8.58%], CNFinance [7.81%], MingZhu Logistics[7.58%], U Power[6.16%], Sasol [5.34%], WiMi Hologram[5.33%], 17 Education[4.25%], Grupo Televisa[4.10%], Skillful Craftsman[3.92%]