
 Login Sign Up


| |||||
 |  | ||||

| 12Stocks.com Market Intelligence |
Best Consumer Staples Stocks
| In a hurry? Consumer Staples Stocks: Performance Trends Table, Stock Charts
Sort Consumer Staples : Daily, Weekly, Year-to-Date, Market Cap & Trends. Filter Consumer Staples stocks list by size: All Large Mid-Range Small |
| 12Stocks.com Consumer Staples Stocks Performances & Trends Daily | |||||||||
|
|  The overall Smart Investing & Trading Score is 83 (0-bearish to 100-bullish) which puts Consumer Staples sector in short term bullish trend. The Smart Investing & Trading Score from previous trading session is 44 and hence an improvement of trend.
| ||||||||
Here are the Smart Investing & Trading Scores of the most requested Consumer Staples stocks at 12Stocks.com (click stock name for detailed review):
|


| 12Stocks.com: Investing in Consumer Staples sector with Stocks | |
|
The following table helps investors and traders sort through current performance and trends (as measured by Smart Investing & Trading Score) of various
stocks in the Consumer Staples sector. Quick View: Move mouse or cursor over stock symbol (ticker) to view short-term Technical chart and over stock name to view long term chart. Click on  to add stock symbol to your watchlist and to add stock symbol to your watchlist and  to view watchlist. Click on any ticker or stock name for detailed market intelligence report for that stock. to view watchlist. Click on any ticker or stock name for detailed market intelligence report for that stock. |
12Stocks.com Performance of Stocks in Consumer Staples Sector
| Ticker | Stock Name | Watchlist | Category | Recent Price | Smart Investing & Trading Score | Change % | YTD Change% |
| CPS | Cooper-Standard |   | Auto Parts | 13.20 | 32 | 3.45 | -32.45% |
| UAA | Under Armour | | Textile - Apparel Clothing | 7.19 | 64 | 3.45 | -18.20% |
| ZVIA | Zevia PBC | | Beverages - Non-Alcoholic | 0.85 | 35 | 3.44 | -57.84% |
| REVG | REV | | Trucks & Other Vehicles | 27.41 | 100 | 3.43 | 50.85% |
| SJM | J. M. | | Processed | 111.64 | 42 | 3.42 | -11.66% |
| SCS | Steelcase | | Equipment | 13.66 | 82 | 3.41 | 1.04% |
| MYE | Myers Industries | | Rubber & Plastics | 15.80 | 32 | 3.40 | -19.18% |
| NWL | Newell Brands | | Housewares & Accessories | 7.72 | 53 | 3.35 | -11.06% |
| POST | Post | | Food | 106.57 | 78 | 3.31 | 21.02% |
| WHR | Whirlpool | | Appliances | 93.03 | 49 | 3.29 | -23.60% |
| BYND | Beyond Meat | | Processed | 7.59 | 47 | 3.27 | -14.72% |
| GPK | Graphic Packaging | | Packaging & Containers | 28.32 | 90 | 3.21 | 14.89% |
| GIS | General Mills | | Processed | 68.75 | 68 | 3.15 | 5.54% |
| SEE | Sealed Air | | Packaging & Containers | 38.87 | 93 | 3.13 | 6.43% |
| LW | Lamb Weston | | Food | 88.29 | 50 | 3.11 | -18.32% |
| OXM | Oxford Industries | | Textile - Apparel Clothing | 110.69 | 75 | 3.08 | 10.69% |
| F | Ford Motor | | Auto Manufacturers - Major | 12.13 | 32 | 3.06 | -0.49% |
| GTX | Garrett Motion | | Auto Parts | 9.08 | 32 | 3.06 | -6.10% |
| LULU | Lululemon Athletica | | Textile - Apparel Clothing | 311.99 | 42 | 3.00 | -38.98% |
| TAP | Molson Coors | | Beverages | 54.81 | 32 | 2.99 | -10.46% |
| DNUT | Krispy Kreme | | Grocery Stores | 10.46 | 17 | 2.95 | -31.16% |
| AMCR | Amcor | | Packaging & Containers | 10.17 | 73 | 2.94 | 5.50% |
| SNBR | Sleep Number | | Home Furnishings & Fixtures | 15.12 | 42 | 2.93 | 1.96% |
| VRA | Vera Bradley | | Textile - Apparel Footwear & Accessories | 8.16 | 100 | 2.90 | 5.97% |
| THS | TreeHouse Foods | | Processed | 36.31 | 85 | 2.89 | -12.40% |
| For chart view version of above stock list: Chart View ➞ 0 - 25 , 25 - 50 , 50 - 75 , 75 - 100 , 100 - 125 , 125 - 150 , 150 - 175 , 175 - 200 , 200 - 225 , 225 - 250 , 250 - 275 , 275 - 300 | ||
 | Click To Change The Sort Order: By Market Cap or Company Size Performance: Year-to-date, Week and Day |  |
|
Get the most comprehensive stock market coverage daily at 12Stocks.com ➞ Best Stocks Today ➞ Best Stocks Weekly ➞ Best Stocks Year-to-Date ➞ Best Stocks Trends ➞  Best Stocks Today 12Stocks.com Best Nasdaq Stocks ➞ Best S&P 500 Stocks ➞ Best Tech Stocks ➞ Best Biotech Stocks ➞ |
| Detailed Overview of Consumer Staples Stocks |
| Consumer Staples Technical Overview, Leaders & Laggards, Top Consumer Staples ETF Funds & Detailed Consumer Staples Stocks List, Charts, Trends & More |
| Consumer Staples Sector: Technical Analysis, Trends & YTD Performance | |
| Consumer Staples sector is composed of stocks
from household consumer products, food, farm, cosmetics, tobacco,
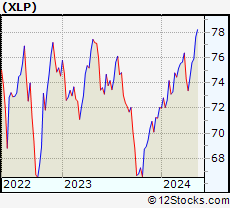
and beverages subsectors. Consumer Staples sector, as represented by XLP, an exchange-traded fund [ETF] that holds basket of Consumer Staples stocks (e.g, Proctor & Gamble, Pepsi) is up by 7.37% and is currently underperforming the overall market by -2.42% year-to-date. Below is a quick view of Technical charts and trends: |
|
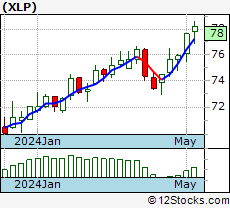 XLP Weekly Chart |
|
| Long Term Trend: Very Good | |
| Medium Term Trend: Good | |
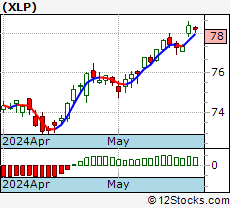 XLP Daily Chart |
|
| Short Term Trend: Very Good | |
| Overall Trend Score: 83 | |
| YTD Performance: 7.37% | |
| **Trend Scores & Views Are Only For Educational Purposes And Not For Investing | |
| 12Stocks.com: Top Performing Consumer Staples Sector Stocks | ||||||||||||||||||||||||||||||||||||||||||||||||
 The top performing Consumer Staples sector stocks year to date are
Now, more recently, over last week, the top performing Consumer Staples sector stocks on the move are


|
||||||||||||||||||||||||||||||||||||||||||||||||
| 12Stocks.com: Investing in Consumer Staples Sector using Exchange Traded Funds | |
|
The following table shows list of key exchange traded funds (ETF) that
help investors track Consumer Staples Index. For detailed view, check out our ETF Funds section of our website. Quick View: Move mouse or cursor over ETF symbol (ticker) to view short-term Technical chart and over ETF name to view long term chart. Click on ticker or stock name for detailed view. Click on to add stock symbol to your watchlist and to view watchlist. |
12Stocks.com List of ETFs that track Consumer Staples Index
| Ticker | ETF Name | Watchlist | Recent Price | Smart Investing & Trading Score | Change % | Week % | Year-to-date % |
| XLP | Consumer Staples | | 77.34 | 83 | 1.56 | 0.31 | 7.37% |
| VDC | Consumer Staples | | 203.16 | 61 | 0.26 | -1.3 | 6.39% |
| KXI | Global Consumer Staples | | 61.31 | 68 | 0.58 | -0.69 | 3.42% |
| PSL | DWA Consumer Staples | | 96.75 | 20 | -0.70 | -2.83 | 5.74% |
| FSTA | Consumer Staples | | 47.37 | 68 | 0.15 | -1.29 | 6.14% |
| 12Stocks.com: Charts, Trends, Fundamental Data and Performances of Consumer Staples Stocks | |
|
We now take in-depth look at all Consumer Staples stocks including charts, multi-period performances and overall trends (as measured by Smart Investing & Trading Score). One can sort Consumer Staples stocks (click link to choose) by Daily, Weekly and by Year-to-Date performances. Also, one can sort by size of the company or by market capitalization. |
| Select Your Default Chart Type: | |||||
| |||||
| Click on stock symbol or name for detailed view. Click on to add stock symbol to your watchlist and to view watchlist. Quick View: Move mouse or cursor over "Daily" to quickly view daily Technical stock chart and over "Weekly" to view weekly Technical stock chart. | |||||
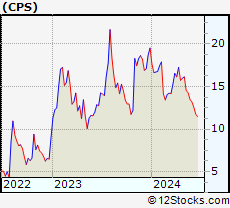 | CPS Cooper-Standard Holdings Inc. |
| Sector: Consumer Staples | |
| SubSector: Auto Parts | |
| MarketCap: 184.339 Millions | |
| Recent Price: 13.20 Smart Investing & Trading Score: 32 | |
| Day Percent Change: 3.45% Day Change: 0.44 | |
| Week Change: -2.22% Year-to-date Change: -32.5% | |
| CPS Links: Profile News Message Board | |
| Charts:- Daily , Weekly | |
| Add CPS to Watchlist: View: Get Complete CPS Trend Analysis ➞ | |
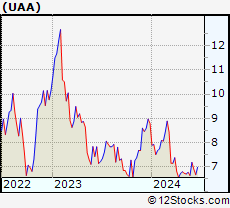 | UAA Under Armour, Inc. |
| Sector: Consumer Staples | |
| SubSector: Textile - Apparel Clothing | |
| MarketCap: 4066.75 Millions | |
| Recent Price: 7.19 Smart Investing & Trading Score: 64 | |
| Day Percent Change: 3.45% Day Change: 0.24 | |
| Week Change: 8.12% Year-to-date Change: -18.2% | |
| UAA Links: Profile News Message Board | |
| Charts:- Daily , Weekly | |
| Add UAA to Watchlist: View: Get Complete UAA Trend Analysis ➞ | |
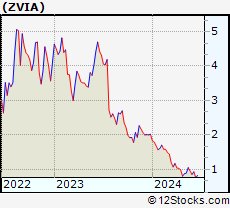 | ZVIA Zevia PBC |
| Sector: Consumer Staples | |
| SubSector: Beverages - Non-Alcoholic | |
| MarketCap: 303 Millions | |
| Recent Price: 0.85 Smart Investing & Trading Score: 35 | |
| Day Percent Change: 3.44% Day Change: 0.03 | |
| Week Change: -10.35% Year-to-date Change: -57.8% | |
| ZVIA Links: Profile News Message Board | |
| Charts:- Daily , Weekly | |
| Add ZVIA to Watchlist: View: Get Complete ZVIA Trend Analysis ➞ | |
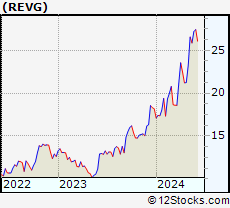 | REVG REV Group, Inc. |
| Sector: Consumer Staples | |
| SubSector: Trucks & Other Vehicles | |
| MarketCap: 398.597 Millions | |
| Recent Price: 27.41 Smart Investing & Trading Score: 100 | |
| Day Percent Change: 3.43% Day Change: 0.91 | |
| Week Change: 0.77% Year-to-date Change: 50.9% | |
| REVG Links: Profile News Message Board | |
| Charts:- Daily , Weekly | |
| Add REVG to Watchlist: View: Get Complete REVG Trend Analysis ➞ | |
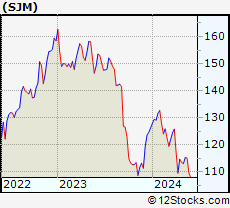 | SJM The J. M. Smucker Company |
| Sector: Consumer Staples | |
| SubSector: Processed & Packaged Goods | |
| MarketCap: 12635.8 Millions | |
| Recent Price: 111.64 Smart Investing & Trading Score: 42 | |
| Day Percent Change: 3.42% Day Change: 3.69 | |
| Week Change: 1.7% Year-to-date Change: -11.7% | |
| SJM Links: Profile News Message Board | |
| Charts:- Daily , Weekly | |
| Add SJM to Watchlist: View: Get Complete SJM Trend Analysis ➞ | |
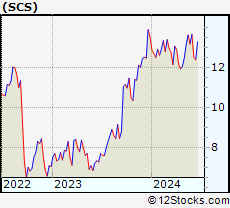 | SCS Steelcase Inc. |
| Sector: Consumer Staples | |
| SubSector: Business Equipment | |
| MarketCap: 1310.77 Millions | |
| Recent Price: 13.66 Smart Investing & Trading Score: 82 | |
| Day Percent Change: 3.41% Day Change: 0.45 | |
| Week Change: 3.64% Year-to-date Change: 1.0% | |
| SCS Links: Profile News Message Board | |
| Charts:- Daily , Weekly | |
| Add SCS to Watchlist: View: Get Complete SCS Trend Analysis ➞ | |
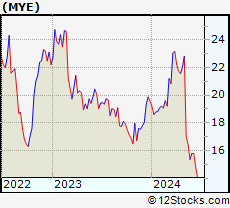 | MYE Myers Industries, Inc. |
| Sector: Consumer Staples | |
| SubSector: Rubber & Plastics | |
| MarketCap: 347.57 Millions | |
| Recent Price: 15.80 Smart Investing & Trading Score: 32 | |
| Day Percent Change: 3.40% Day Change: 0.52 | |
| Week Change: 2.93% Year-to-date Change: -19.2% | |
| MYE Links: Profile News Message Board | |
| Charts:- Daily , Weekly | |
| Add MYE to Watchlist: View: Get Complete MYE Trend Analysis ➞ | |
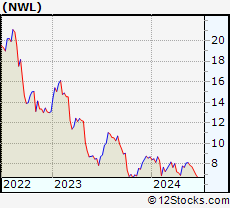 | NWL Newell Brands Inc. |
| Sector: Consumer Staples | |
| SubSector: Housewares & Accessories | |
| MarketCap: 5833.53 Millions | |
| Recent Price: 7.72 Smart Investing & Trading Score: 53 | |
| Day Percent Change: 3.35% Day Change: 0.25 | |
| Week Change: -1.78% Year-to-date Change: -11.1% | |
| NWL Links: Profile News Message Board | |
| Charts:- Daily , Weekly | |
| Add NWL to Watchlist: View: Get Complete NWL Trend Analysis ➞ | |
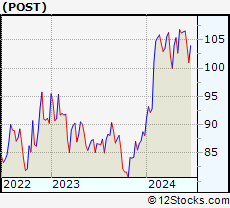 | POST Post Holdings, Inc. |
| Sector: Consumer Staples | |
| SubSector: Food - Major Diversified | |
| MarketCap: 5576.53 Millions | |
| Recent Price: 106.57 Smart Investing & Trading Score: 78 | |
| Day Percent Change: 3.31% Day Change: 3.41 | |
| Week Change: 0.13% Year-to-date Change: 21.0% | |
| POST Links: Profile News Message Board | |
| Charts:- Daily , Weekly | |
| Add POST to Watchlist: View: Get Complete POST Trend Analysis ➞ | |
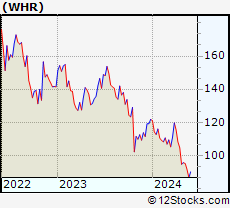 | WHR Whirlpool Corporation |
| Sector: Consumer Staples | |
| SubSector: Appliances | |
| MarketCap: 5015.08 Millions | |
| Recent Price: 93.03 Smart Investing & Trading Score: 49 | |
| Day Percent Change: 3.29% Day Change: 2.96 | |
| Week Change: 7.52% Year-to-date Change: -23.6% | |
| WHR Links: Profile News Message Board | |
| Charts:- Daily , Weekly | |
| Add WHR to Watchlist: View: Get Complete WHR Trend Analysis ➞ | |
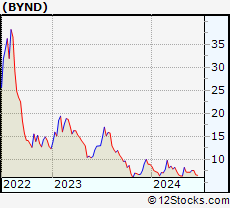 | BYND Beyond Meat, Inc. |
| Sector: Consumer Staples | |
| SubSector: Processed & Packaged Goods | |
| MarketCap: 3987.98 Millions | |
| Recent Price: 7.59 Smart Investing & Trading Score: 47 | |
| Day Percent Change: 3.27% Day Change: 0.24 | |
| Week Change: 5.86% Year-to-date Change: -14.7% | |
| BYND Links: Profile News Message Board | |
| Charts:- Daily , Weekly | |
| Add BYND to Watchlist: View: Get Complete BYND Trend Analysis ➞ | |
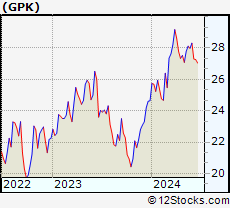 | GPK Graphic Packaging Holding Company |
| Sector: Consumer Staples | |
| SubSector: Packaging & Containers | |
| MarketCap: 3350.23 Millions | |
| Recent Price: 28.32 Smart Investing & Trading Score: 90 | |
| Day Percent Change: 3.21% Day Change: 0.88 | |
| Week Change: 1.18% Year-to-date Change: 14.9% | |
| GPK Links: Profile News Message Board | |
| Charts:- Daily , Weekly | |
| Add GPK to Watchlist: View: Get Complete GPK Trend Analysis ➞ | |
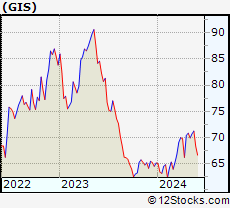 | GIS General Mills, Inc. |
| Sector: Consumer Staples | |
| SubSector: Processed & Packaged Goods | |
| MarketCap: 34131.7 Millions | |
| Recent Price: 68.75 Smart Investing & Trading Score: 68 | |
| Day Percent Change: 3.15% Day Change: 2.10 | |
| Week Change: 0.66% Year-to-date Change: 5.5% | |
| GIS Links: Profile News Message Board | |
| Charts:- Daily , Weekly | |
| Add GIS to Watchlist: View: Get Complete GIS Trend Analysis ➞ | |
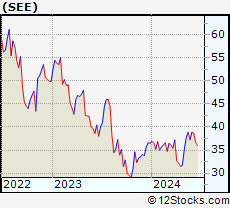 | SEE Sealed Air Corporation |
| Sector: Consumer Staples | |
| SubSector: Packaging & Containers | |
| MarketCap: 4037.23 Millions | |
| Recent Price: 38.87 Smart Investing & Trading Score: 93 | |
| Day Percent Change: 3.13% Day Change: 1.18 | |
| Week Change: 4.41% Year-to-date Change: 6.4% | |
| SEE Links: Profile News Message Board | |
| Charts:- Daily , Weekly | |
| Add SEE to Watchlist: View: Get Complete SEE Trend Analysis ➞ | |
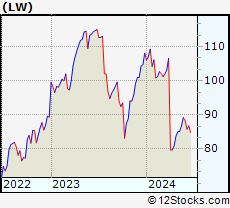 | LW Lamb Weston Holdings, Inc. |
| Sector: Consumer Staples | |
| SubSector: Food - Major Diversified | |
| MarketCap: 7844.63 Millions | |
| Recent Price: 88.29 Smart Investing & Trading Score: 50 | |
| Day Percent Change: 3.11% Day Change: 2.66 | |
| Week Change: -1.03% Year-to-date Change: -18.3% | |
| LW Links: Profile News Message Board | |
| Charts:- Daily , Weekly | |
| Add LW to Watchlist: View: Get Complete LW Trend Analysis ➞ | |
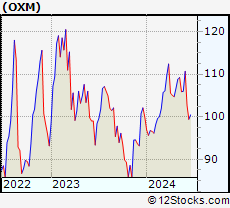 | OXM Oxford Industries, Inc. |
| Sector: Consumer Staples | |
| SubSector: Textile - Apparel Clothing | |
| MarketCap: 647.665 Millions | |
| Recent Price: 110.69 Smart Investing & Trading Score: 75 | |
| Day Percent Change: 3.08% Day Change: 3.31 | |
| Week Change: 4.42% Year-to-date Change: 10.7% | |
| OXM Links: Profile News Message Board | |
| Charts:- Daily , Weekly | |
| Add OXM to Watchlist: View: Get Complete OXM Trend Analysis ➞ | |
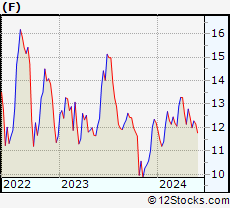 | F Ford Motor Company |
| Sector: Consumer Staples | |
| SubSector: Auto Manufacturers - Major | |
| MarketCap: 19052.1 Millions | |
| Recent Price: 12.13 Smart Investing & Trading Score: 32 | |
| Day Percent Change: 3.06% Day Change: 0.36 | |
| Week Change: -0.25% Year-to-date Change: -0.5% | |
| F Links: Profile News Message Board | |
| Charts:- Daily , Weekly | |
| Add F to Watchlist: View: Get Complete F Trend Analysis ➞ | |
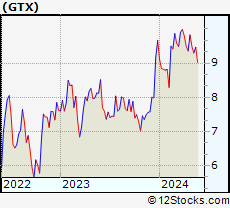 | GTX Garrett Motion Inc. |
| Sector: Consumer Staples | |
| SubSector: Auto Parts | |
| MarketCap: 256.439 Millions | |
| Recent Price: 9.08 Smart Investing & Trading Score: 32 | |
| Day Percent Change: 3.06% Day Change: 0.27 | |
| Week Change: 0.67% Year-to-date Change: -6.1% | |
| GTX Links: Profile News Message Board | |
| Charts:- Daily , Weekly | |
| Add GTX to Watchlist: View: Get Complete GTX Trend Analysis ➞ | |
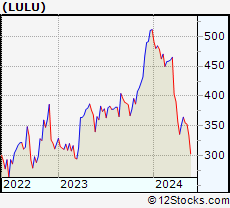 | LULU Lululemon Athletica Inc. |
| Sector: Consumer Staples | |
| SubSector: Textile - Apparel Clothing | |
| MarketCap: 24627.8 Millions | |
| Recent Price: 311.99 Smart Investing & Trading Score: 42 | |
| Day Percent Change: 3.00% Day Change: 9.09 | |
| Week Change: 2.97% Year-to-date Change: -39.0% | |
| LULU Links: Profile News Message Board | |
| Charts:- Daily , Weekly | |
| Add LULU to Watchlist: View: Get Complete LULU Trend Analysis ➞ | |
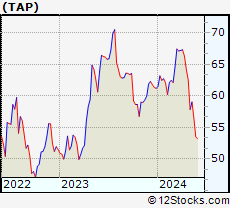 | TAP Molson Coors Beverage Company |
| Sector: Consumer Staples | |
| SubSector: Beverages - Brewers | |
| MarketCap: 8619.97 Millions | |
| Recent Price: 54.81 Smart Investing & Trading Score: 32 | |
| Day Percent Change: 2.99% Day Change: 1.59 | |
| Week Change: 2.45% Year-to-date Change: -10.5% | |
| TAP Links: Profile News Message Board | |
| Charts:- Daily , Weekly | |
| Add TAP to Watchlist: View: Get Complete TAP Trend Analysis ➞ | |
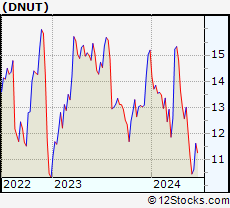 | DNUT Krispy Kreme, Inc. |
| Sector: Consumer Staples | |
| SubSector: Grocery Stores | |
| MarketCap: 2480 Millions | |
| Recent Price: 10.46 Smart Investing & Trading Score: 17 | |
| Day Percent Change: 2.95% Day Change: 0.30 | |
| Week Change: -6.19% Year-to-date Change: -31.2% | |
| DNUT Links: Profile News Message Board | |
| Charts:- Daily , Weekly | |
| Add DNUT to Watchlist: View: Get Complete DNUT Trend Analysis ➞ | |
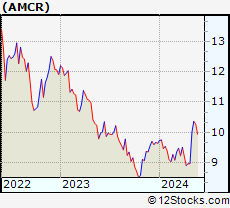 | AMCR Amcor plc |
| Sector: Consumer Staples | |
| SubSector: Packaging & Containers | |
| MarketCap: 13964 Millions | |
| Recent Price: 10.17 Smart Investing & Trading Score: 73 | |
| Day Percent Change: 2.94% Day Change: 0.29 | |
| Week Change: 2.31% Year-to-date Change: 5.5% | |
| AMCR Links: Profile News Message Board | |
| Charts:- Daily , Weekly | |
| Add AMCR to Watchlist: View: Get Complete AMCR Trend Analysis ➞ | |
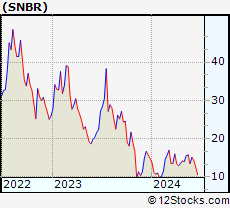 | SNBR Sleep Number Corporation |
| Sector: Consumer Staples | |
| SubSector: Home Furnishings & Fixtures | |
| MarketCap: 692.735 Millions | |
| Recent Price: 15.12 Smart Investing & Trading Score: 42 | |
| Day Percent Change: 2.93% Day Change: 0.43 | |
| Week Change: 12.08% Year-to-date Change: 2.0% | |
| SNBR Links: Profile News Message Board | |
| Charts:- Daily , Weekly | |
| Add SNBR to Watchlist: View: Get Complete SNBR Trend Analysis ➞ | |
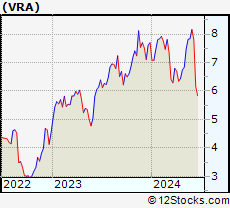 | VRA Vera Bradley, Inc. |
| Sector: Consumer Staples | |
| SubSector: Textile - Apparel Footwear & Accessories | |
| MarketCap: 151.17 Millions | |
| Recent Price: 8.16 Smart Investing & Trading Score: 100 | |
| Day Percent Change: 2.90% Day Change: 0.23 | |
| Week Change: 4.08% Year-to-date Change: 6.0% | |
| VRA Links: Profile News Message Board | |
| Charts:- Daily , Weekly | |
| Add VRA to Watchlist: View: Get Complete VRA Trend Analysis ➞ | |
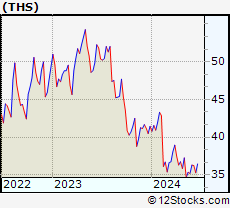 | THS TreeHouse Foods, Inc. |
| Sector: Consumer Staples | |
| SubSector: Processed & Packaged Goods | |
| MarketCap: 2392.08 Millions | |
| Recent Price: 36.31 Smart Investing & Trading Score: 85 | |
| Day Percent Change: 2.89% Day Change: 1.02 | |
| Week Change: 3.15% Year-to-date Change: -12.4% | |
| THS Links: Profile News Message Board | |
| Charts:- Daily , Weekly | |
| Add THS to Watchlist: View: Get Complete THS Trend Analysis ➞ | |
| For tabular summary view of above stock list: Summary View ➞ 0 - 25 , 25 - 50 , 50 - 75 , 75 - 100 , 100 - 125 , 125 - 150 , 150 - 175 , 175 - 200 , 200 - 225 , 225 - 250 , 250 - 275 , 275 - 300 | ||
| Click To Change The Sort Order: By Market Cap or Company Size Performance: Year-to-date, Week and Day | |
| Select Chart Type: | ||
|
Best Stocks Today 12Stocks.com |
© 2024 12Stocks.com Terms & Conditions Privacy Contact Us
All Information Provided Only For Education And Not To Be Used For Investing or Trading. See Terms & Conditions


One More Thing ... Get Best Stocks Delivered Daily!
Never Ever Miss A Move With Our Top Ten Stocks Lists
Find Best Stocks In Any Market - Bull or Bear Market
Take A Peek At Our Top Ten Stocks Lists: Daily, Weekly, Year-to-Date & Top Trends
Find Best Stocks In Any Market - Bull or Bear Market
Take A Peek At Our Top Ten Stocks Lists: Daily, Weekly, Year-to-Date & Top Trends
Consumer Staples Stocks With Best Up Trends [0-bearish to 100-bullish]: Boston Beer[100], CHS [100], Sportsman s[100], Vita Coco[100], REV [100], Vera Bradley[100], Miller Industries[100], Cal-Maine Foods[100], Gildan Activewear[100], Superior [100], Philip Morris[100]
Best Consumer Staples Stocks Year-to-Date:
China Liberal[498.43%], Laird Superfood[198.87%], Vital Farms[163.57%], Blue Bird[111.46%], Flexsteel Industries[89.92%], Modine [69.05%], Crocs [66.62%], Deckers Outdoor[63.66%], QuantaSing [61.11%], Lifetime Brands[60.51%], Tuniu [59.46%] Best Consumer Staples Stocks This Week:
Foot Locker[25.65%], Boston Beer[20.3%], QuantaSing [17.04%], SunOpta [15.58%], Peloton Interactive[15.56%], Sportsman s[14.76%], Sleep Number[12.08%], NIO [11.59%], Hain Celestial[10.69%], Gentherm [9.61%], CHS [9.06%] Best Consumer Staples Stocks Daily:
Boston Beer[22.33%], CHS [9.58%], Sportsman s[7.93%], V.F [7.70%], SunOpta [7.32%], Foot Locker[7.11%], 17 Education[7.09%], Hain Celestial[6.09%], Leggett & Platt[5.26%], Rocky Brands[4.97%], Carter s[4.92%]