
 Login Sign Up


| |||||
 |  | ||||

| 12Stocks.com Market Intelligence |
Best Latin America Stocks
|
|
| Quick Read: Top Latin America Stocks By Performances & Trends: Daily, Weekly, Year-to-Date, Market Cap (Size) & Technical Trends | |||
| Best Latin America Views: Quick Browse View, Summary & Slide Show | |||
| 12Stocks.com Latin America Stocks Performances & Trends Daily | |||||||||
|
|  The overall market intelligence score is 71 (0-bearish to 100-bullish) which puts Latin America index in short term neutral to bullish trend. The market intelligence score from previous trading session is 66 and hence an improvement of trend.
| ||||||||
| Here are the market intelligence trend scores of the most requested Latin America stocks at 12Stocks.com (click stock name for detailed review): | |
| Scroll down this page for most comprehensive review of Latin America stocks by performance, trends, technical analysis, charts, fund plays & more | |


| 12Stocks.com: Top Performing Latin America Index Stocks | ||||||||||||||||||||||||||||||||||||||||||||||||
 The top performing Latin America Index stocks year to date are
Now, more recently, over last week, the top performing Latin America Index stocks on the move are


|
||||||||||||||||||||||||||||||||||||||||||||||||
| 12Stocks.com: Investing in Latin America Index with Stocks | |
|
The following table helps investors and traders sort through current performance and trends (as measured by market intelligence score) of various
stocks in the Latin America Index. Quick View: Move mouse or cursor over stock symbol (ticker) to view short-term technical chart and over stock name to view long term chart. Click on  to add stock symbol to your watchlist and to add stock symbol to your watchlist and  to view watchlist. Click on any ticker or stock name for detailed market intelligence report for that stock. to view watchlist. Click on any ticker or stock name for detailed market intelligence report for that stock. |
12Stocks.com Performance of Stocks in Latin America Index
| Ticker | Stock Name | Watchlist | Category | Recent Price | Market Intelligence Score | Change % | YTD Change% |
| FSM | Fortuna Silver |   | Materials | 5.73 | 100 | 5.52% | 48.45% |
| VET | Vermilion Energy | | Energy | 12.11 | 81 | 0.37% | 0.37% |
| QBTS | D-Wave Quantum | | Technology | 1.28 | 5 | -0.39% | 46.46% |
| MUX | McEwen Mining | | Materials | 11.12 | 68 | 4.91% | 54.23% |
| IRS | IRSA Inversiones | | Financials | 11.43 | 95 | 1.65% | 32.85% |
| GROY | Gold Royalty | | Materials | 1.91 | 68 | 4.37% | 32.18% |
| SUPV | Grupo Supervielle | | Financials | 7.66 | 90 | 0.66% | 88.67% |
| CRESY | Cresud Sociedad | | Consumer Staples | 10.15 | 83 | -0.59% | 7.07% |
| EXK | Endeavour Silver | | Materials | 3.86 | 100 | 10.29% | 95.94% |
| STKL | SunOpta | | Consumer Staples | 5.51 | 7 | -1.96% | 0.73% |
| NAK | Northern Dynasty | | Materials | 0.30 | 80 | -0.03% | -6.87% |
| NOA | North American | | Energy | 20.32 | 20 | 0.44% | -2.54% |
| LND | BrasilAgro - | | Financials | 4.93 | 68 | -0.40% | -6.63% |
| DNN | Denison Mines | | Materials | 2.21 | 93 | 5.00% | 24.58% |
| VOXR | Vox Royalty | | Materials | 2.13 | 68 | 0.95% | 3.40% |
| TMQ | Trilogy Metals | | Materials | 0.49 | 68 | -8.62% | 14.19% |
| APT | Alpha Pro | | Industrials | 4.93 | 18 | -1.89% | -6.81% |
| WPRT | Westport Fuel | | Consumer Staples | 6.28 | 70 | -0.08% | -5.21% |
| EDN | Empresa Distribuidora | | Utilities | 19.25 | 71 | -0.72% | -0.62% |
| PDS | Precision Drilling | | Energy | 72.04 | 76 | 1.55% | 32.69% |
| TRX | Tanzanian Gold | | Materials | 0.47 | 93 | 2.50% | 22.91% |
| GTE | Gran Tierra | | Energy | 9.36 | 80 | 0.86% | 65.96% |
| SPPP | Sprott Physical | | Materials | 10.53 | 100 | 1.10% | 4.31% |
| PLG | Platinum | | Materials | 1.77 | 100 | 7.93% | 55.26% |
| THM | Tower | | Materials | 0.68 | 63 | 3.70% | 16.09% |
| To view more stocks, click on Next / Previous arrows or select different range: 0 - 25 , 25 - 50 , 50 - 75 , 75 - 100 , 100 - 125 , 125 - 150 , 150 - 175 , 175 - 200 | ||
 | Click To Change The Sort Order: By Market Cap or Company Size Performance: Year-to-date, Week and Day |  |
| Detailed Overview Of Latin America Stocks |
| Latin America Technical Overview, Leaders & Laggards, Top Latin America ETF Funds & Detailed Latin America Stocks List, Charts, Trends & More |
| Latin America: Technical Analysis, Trends & YTD Performance | |
 ILF Weekly Chart |
|
| Long Term Trend: Good | |
| Medium Term Trend: Very Good | |
 ILF Daily Chart |
|
| Short Term Trend: Not Good | |
| Overall Trend Score: 71 | |
| YTD Performance: -2.03% | |
| **Trend Scores & Views Are Only For Educational Purposes And Not For Investing | |
| 12Stocks.com: Investing in Latin America Index using Exchange Traded Funds | |
|
The following table shows list of key exchange traded funds (ETF) that
help investors play Latin America stock market. For detailed view, check out our ETF Funds section of our website. Quick View: Move mouse or cursor over ETF symbol (ticker) to view short-term technical chart and over ETF name to view long term chart. Click on ticker or stock name for detailed view. Click on to add stock symbol to your watchlist and to view watchlist. |
12Stocks.com List of ETFs that track Latin America Index
| Ticker | ETF Name | Watchlist | Recent Price | Market Intelligence Score | Change % | Week % | Year-to-date % |
| ILF | Latin America 40 | | 28.47 | 71 | 0.49 | 0.14 | -2.03% |
| EWC | Canada | | 38.47 | 95 | 0.44 | 0.73 | 4.88% |
| FLN | Latin America AlphaDEX | | 20.30 | 72 | 0.10 | 1.35 | -2.36% |
| EWZ | Brazil | | 31.68 | 18 | -0.06 | 0.22 | -9.38% |
| EWW | Mexico | | 69.06 | 95 | 0.54 | 0.86 | 1.78% |
| ARGT | Argentina | | 64.11 | 76 | 0.69 | 2.92 | 24.87% |
| EWZS | Brazil Small-Cap | | 13.78 | 57 | 0.66 | 2.61 | -8.5% |
| BRF | Brazil Small-Cap | | 15.45 | 37 | 0.23 | 1.18 | -12.16% |
| BZQ | Short Brazil | | 11.92 | 61 | -1.24 | -0.41 | 18.84% |
| BRZU | Brazil Bull 3X | | 81.03 | 25 | 0.40 | 0.57 | -21.24% |
| FBZ | Brazil AlphaDEX | | 11.81 | 57 | 0.20 | 2.07 | -3.37% |
| 12Stocks.com: Charts, Trends, Fundamental Data and Performances of Latin America Stocks | |
|
We now take in-depth look at all Latin America stocks including charts, multi-period performances and overall trends (as measured by market intelligence score). One can sort Latin America stocks (click link to choose) by Daily, Weekly and by Year-to-Date performances. Also, one can sort by size of the company or by market capitalization. |
| Select Your Default Chart Type: | |||||
| |||||
| Click on stock symbol or name for detailed view. Click on to add stock symbol to your watchlist and to view watchlist. Quick View: Move mouse or cursor over "Daily" to quickly view daily technical stock chart and over "Weekly" to view weekly technical stock chart. | |||||

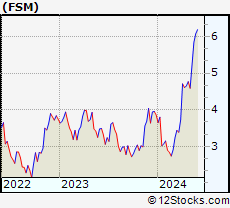 | FSM Fortuna Silver Mines Inc. |
| Sector: Materials | |
| SubSector: Silver | |
| MarketCap: 362.256 Millions | |
| Recent Price: 5.73 Market Intelligence Score: 100 | |
| Day Percent Change: 5.52% Day Change: 0.30 | |
| Week Change: 9.98% Year-to-date Change: 48.5% | |
| FSM Links: Profile News Message Board | |
| Charts:- Daily , Weekly | |
| Add FSM to Watchlist: View: Get Complete FSM Trend Analysis ➞ | |
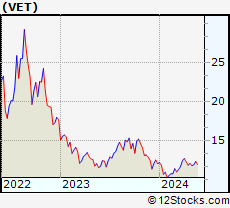 | VET Vermilion Energy Inc. |
| Sector: Energy | |
| SubSector: Oil & Gas Drilling & Exploration | |
| MarketCap: 335.839 Millions | |
| Recent Price: 12.11 Market Intelligence Score: 81 | |
| Day Percent Change: 0.37% Day Change: 0.04 | |
| Week Change: 1.64% Year-to-date Change: 0.4% | |
| VET Links: Profile News Message Board | |
| Charts:- Daily , Weekly | |
| Add VET to Watchlist: View: Get Complete VET Trend Analysis ➞ | |
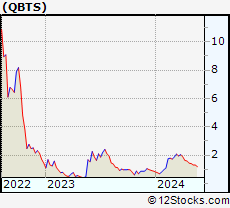 | QBTS D-Wave Quantum Inc. |
| Sector: Technology | |
| SubSector: Computer Hardware | |
| MarketCap: 290 Millions | |
| Recent Price: 1.28 Market Intelligence Score: 5 | |
| Day Percent Change: -0.39% Day Change: -0.01 | |
| Week Change: -1.15% Year-to-date Change: 46.5% | |
| QBTS Links: Profile News Message Board | |
| Charts:- Daily , Weekly | |
| Add QBTS to Watchlist: View: Get Complete QBTS Trend Analysis ➞ | |
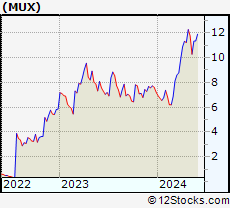 | MUX McEwen Mining Inc. |
| Sector: Materials | |
| SubSector: Gold | |
| MarketCap: 264.819 Millions | |
| Recent Price: 11.12 Market Intelligence Score: 68 | |
| Day Percent Change: 4.91% Day Change: 0.52 | |
| Week Change: 8.17% Year-to-date Change: 54.2% | |
| MUX Links: Profile News Message Board | |
| Charts:- Daily , Weekly | |
| Add MUX to Watchlist: View: Get Complete MUX Trend Analysis ➞ | |
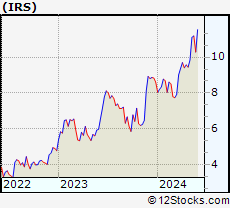 | IRS IRSA Inversiones y Representaciones Sociedad Anonima |
| Sector: Financials | |
| SubSector: Real Estate Development | |
| MarketCap: 257.519 Millions | |
| Recent Price: 11.43 Market Intelligence Score: 95 | |
| Day Percent Change: 1.65% Day Change: 0.19 | |
| Week Change: 2.84% Year-to-date Change: 32.9% | |
| IRS Links: Profile News Message Board | |
| Charts:- Daily , Weekly | |
| Add IRS to Watchlist: View: Get Complete IRS Trend Analysis ➞ | |
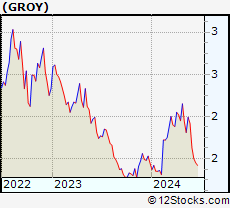 | GROY Gold Royalty Corp. |
| Sector: Materials | |
| SubSector: Other Precious Metals & Mining | |
| MarketCap: 254 Millions | |
| Recent Price: 1.91 Market Intelligence Score: 68 | |
| Day Percent Change: 4.37% Day Change: 0.08 | |
| Week Change: 5.52% Year-to-date Change: 32.2% | |
| GROY Links: Profile News Message Board | |
| Charts:- Daily , Weekly | |
| Add GROY to Watchlist: View: Get Complete GROY Trend Analysis ➞ | |
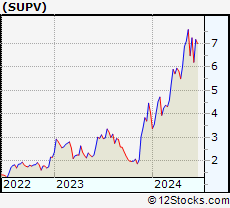 | SUPV Grupo Supervielle S.A. |
| Sector: Financials | |
| SubSector: Foreign Regional Banks | |
| MarketCap: 224.779 Millions | |
| Recent Price: 7.66 Market Intelligence Score: 90 | |
| Day Percent Change: 0.66% Day Change: 0.05 | |
| Week Change: 7.89% Year-to-date Change: 88.7% | |
| SUPV Links: Profile News Message Board | |
| Charts:- Daily , Weekly | |
| Add SUPV to Watchlist: View: Get Complete SUPV Trend Analysis ➞ | |
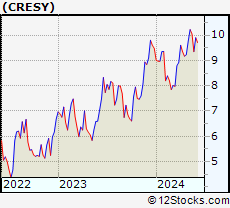 | CRESY Cresud Sociedad Anonima Comercial, Inmobiliaria, Financiera y Agropecuaria |
| Sector: Consumer Staples | |
| SubSector: Farm Products | |
| MarketCap: 224.187 Millions | |
| Recent Price: 10.15 Market Intelligence Score: 83 | |
| Day Percent Change: -0.59% Day Change: -0.06 | |
| Week Change: -0.68% Year-to-date Change: 7.1% | |
| CRESY Links: Profile News Message Board | |
| Charts:- Daily , Weekly | |
| Add CRESY to Watchlist: View: Get Complete CRESY Trend Analysis ➞ | |
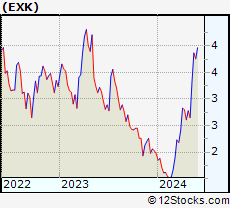 | EXK Endeavour Silver Corp. |
| Sector: Materials | |
| SubSector: Silver | |
| MarketCap: 204.456 Millions | |
| Recent Price: 3.86 Market Intelligence Score: 100 | |
| Day Percent Change: 10.29% Day Change: 0.36 | |
| Week Change: 16.27% Year-to-date Change: 95.9% | |
| EXK Links: Profile News Message Board | |
| Charts:- Daily , Weekly | |
| Add EXK to Watchlist: View: Get Complete EXK Trend Analysis ➞ | |
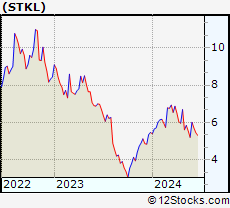 | STKL SunOpta Inc. |
| Sector: Consumer Staples | |
| SubSector: Processed & Packaged Goods | |
| MarketCap: 174.548 Millions | |
| Recent Price: 5.51 Market Intelligence Score: 7 | |
| Day Percent Change: -1.96% Day Change: -0.11 | |
| Week Change: -5.65% Year-to-date Change: 0.7% | |
| STKL Links: Profile News Message Board | |
| Charts:- Daily , Weekly | |
| Add STKL to Watchlist: View: Get Complete STKL Trend Analysis ➞ | |
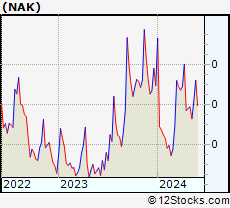 | NAK Northern Dynasty Minerals Ltd. |
| Sector: Materials | |
| SubSector: Industrial Metals & Minerals | |
| MarketCap: 167.01 Millions | |
| Recent Price: 0.30 Market Intelligence Score: 80 | |
| Day Percent Change: -0.03% Day Change: 0.00 | |
| Week Change: 6.77% Year-to-date Change: -6.9% | |
| NAK Links: Profile News Message Board | |
| Charts:- Daily , Weekly | |
| Add NAK to Watchlist: View: Get Complete NAK Trend Analysis ➞ | |
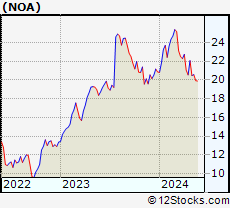 | NOA North American Construction Group Ltd. |
| Sector: Energy | |
| SubSector: Oil & Gas Equipment & Services | |
| MarketCap: 160.461 Millions | |
| Recent Price: 20.32 Market Intelligence Score: 20 | |
| Day Percent Change: 0.44% Day Change: 0.09 | |
| Week Change: -1.22% Year-to-date Change: -2.5% | |
| NOA Links: Profile News Message Board | |
| Charts:- Daily , Weekly | |
| Add NOA to Watchlist: View: Get Complete NOA Trend Analysis ➞ | |
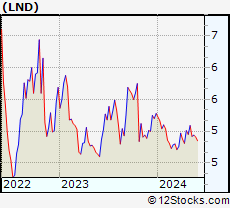 | LND BrasilAgro - Companhia Brasileira de Propriedades Agricolas |
| Sector: Financials | |
| SubSector: Property Management | |
| MarketCap: 157.842 Millions | |
| Recent Price: 4.93 Market Intelligence Score: 68 | |
| Day Percent Change: -0.40% Day Change: -0.02 | |
| Week Change: 0.2% Year-to-date Change: -6.6% | |
| LND Links: Profile News Message Board | |
| Charts:- Daily , Weekly | |
| Add LND to Watchlist: View: Get Complete LND Trend Analysis ➞ | |
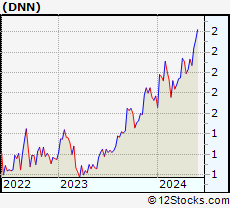 | DNN Denison Mines Corp. |
| Sector: Materials | |
| SubSector: Industrial Metals & Minerals | |
| MarketCap: 154.11 Millions | |
| Recent Price: 2.21 Market Intelligence Score: 93 | |
| Day Percent Change: 5.00% Day Change: 0.10 | |
| Week Change: 6.52% Year-to-date Change: 24.6% | |
| DNN Links: Profile News Message Board | |
| Charts:- Daily , Weekly | |
| Add DNN to Watchlist: View: Get Complete DNN Trend Analysis ➞ | |
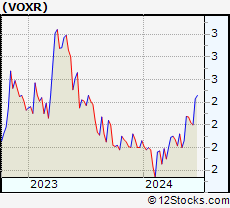 | VOXR Vox Royalty Corp. |
| Sector: Materials | |
| SubSector: Other Precious Metals & Mining | |
| MarketCap: 154 Millions | |
| Recent Price: 2.13 Market Intelligence Score: 68 | |
| Day Percent Change: 0.95% Day Change: 0.02 | |
| Week Change: 3.4% Year-to-date Change: 3.4% | |
| VOXR Links: Profile News Message Board | |
| Charts:- Daily , Weekly | |
| Add VOXR to Watchlist: View: Get Complete VOXR Trend Analysis ➞ | |
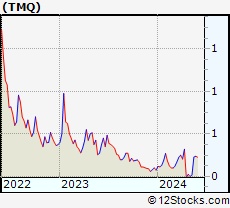 | TMQ Trilogy Metals Inc. |
| Sector: Materials | |
| SubSector: Industrial Metals & Minerals | |
| MarketCap: 151.21 Millions | |
| Recent Price: 0.49 Market Intelligence Score: 68 | |
| Day Percent Change: -8.62% Day Change: -0.05 | |
| Week Change: 20.7% Year-to-date Change: 14.2% | |
| TMQ Links: Profile News Message Board | |
| Charts:- Daily , Weekly | |
| Add TMQ to Watchlist: View: Get Complete TMQ Trend Analysis ➞ | |
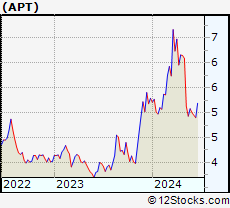 | APT Alpha Pro Tech, Ltd. |
| Sector: Industrials | |
| SubSector: General Building Materials | |
| MarketCap: 125.953 Millions | |
| Recent Price: 4.93 Market Intelligence Score: 18 | |
| Day Percent Change: -1.89% Day Change: -0.10 | |
| Week Change: -3.9% Year-to-date Change: -6.8% | |
| APT Links: Profile News Message Board | |
| Charts:- Daily , Weekly | |
| Add APT to Watchlist: View: Get Complete APT Trend Analysis ➞ | |
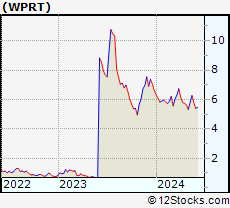 | WPRT Westport Fuel Systems Inc. |
| Sector: Consumer Staples | |
| SubSector: Auto Parts | |
| MarketCap: 108.939 Millions | |
| Recent Price: 6.28 Market Intelligence Score: 70 | |
| Day Percent Change: -0.08% Day Change: 0.00 | |
| Week Change: 8% Year-to-date Change: -5.2% | |
| WPRT Links: Profile News Message Board | |
| Charts:- Daily , Weekly | |
| Add WPRT to Watchlist: View: Get Complete WPRT Trend Analysis ➞ | |
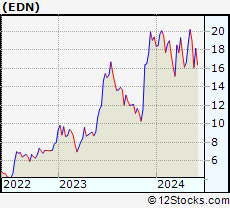 | EDN Empresa Distribuidora y Comercializadora Norte Sociedad Anonima |
| Sector: Utilities | |
| SubSector: Electric Utilities | |
| MarketCap: 105.914 Millions | |
| Recent Price: 19.25 Market Intelligence Score: 71 | |
| Day Percent Change: -0.72% Day Change: -0.14 | |
| Week Change: -4.61% Year-to-date Change: -0.6% | |
| EDN Links: Profile News Message Board | |
| Charts:- Daily , Weekly | |
| Add EDN to Watchlist: View: Get Complete EDN Trend Analysis ➞ | |
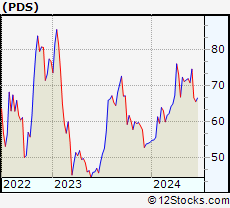 | PDS Precision Drilling Corporation |
| Sector: Energy | |
| SubSector: Oil & Gas Equipment & Services | |
| MarketCap: 103.461 Millions | |
| Recent Price: 72.04 Market Intelligence Score: 76 | |
| Day Percent Change: 1.55% Day Change: 1.10 | |
| Week Change: 0.68% Year-to-date Change: 32.7% | |
| PDS Links: Profile News Message Board | |
| Charts:- Daily , Weekly | |
| Add PDS to Watchlist: View: Get Complete PDS Trend Analysis ➞ | |
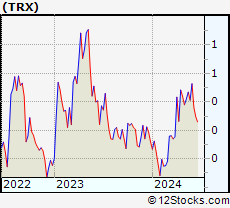 | TRX Tanzanian Gold Corporation |
| Sector: Materials | |
| SubSector: Gold | |
| MarketCap: 95.9619 Millions | |
| Recent Price: 0.47 Market Intelligence Score: 93 | |
| Day Percent Change: 2.50% Day Change: 0.01 | |
| Week Change: 2.75% Year-to-date Change: 22.9% | |
| TRX Links: Profile News Message Board | |
| Charts:- Daily , Weekly | |
| Add TRX to Watchlist: View: Get Complete TRX Trend Analysis ➞ | |
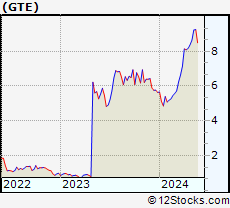 | GTE Gran Tierra Energy Inc. |
| Sector: Energy | |
| SubSector: Independent Oil & Gas | |
| MarketCap: 87.0593 Millions | |
| Recent Price: 9.36 Market Intelligence Score: 80 | |
| Day Percent Change: 0.86% Day Change: 0.08 | |
| Week Change: 1.41% Year-to-date Change: 66.0% | |
| GTE Links: Profile News Message Board | |
| Charts:- Daily , Weekly | |
| Add GTE to Watchlist: View: Get Complete GTE Trend Analysis ➞ | |
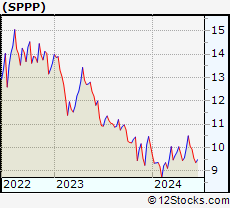 | SPPP Sprott Physical Platinum and Palladium Trust |
| Sector: Materials | |
| SubSector: Industrial Metals & Minerals | |
| MarketCap: 82.791 Millions | |
| Recent Price: 10.53 Market Intelligence Score: 100 | |
| Day Percent Change: 1.10% Day Change: 0.12 | |
| Week Change: 5.57% Year-to-date Change: 4.3% | |
| SPPP Links: Profile News Message Board | |
| Charts:- Daily , Weekly | |
| Add SPPP to Watchlist: View: Get Complete SPPP Trend Analysis ➞ | |
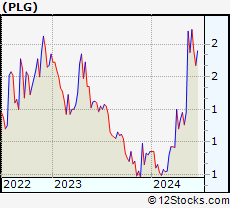 | PLG Platinum Group Metals Ltd. |
| Sector: Materials | |
| SubSector: Industrial Metals & Minerals | |
| MarketCap: 77.591 Millions | |
| Recent Price: 1.77 Market Intelligence Score: 100 | |
| Day Percent Change: 7.93% Day Change: 0.13 | |
| Week Change: 28.26% Year-to-date Change: 55.3% | |
| PLG Links: Profile News Message Board | |
| Charts:- Daily , Weekly | |
| Add PLG to Watchlist: View: Get Complete PLG Trend Analysis ➞ | |
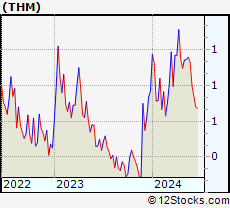 | THM International Tower Hill Mines Ltd. |
| Sector: Materials | |
| SubSector: Gold | |
| MarketCap: 70.4619 Millions | |
| Recent Price: 0.68 Market Intelligence Score: 63 | |
| Day Percent Change: 3.70% Day Change: 0.02 | |
| Week Change: 1.01% Year-to-date Change: 16.1% | |
| THM Links: Profile News Message Board | |
| Charts:- Daily , Weekly | |
| Add THM to Watchlist: View: Get Complete THM Trend Analysis ➞ | |
| To view more stocks, click on Next / Previous arrows or select different range: 0 - 25 , 25 - 50 , 50 - 75 , 75 - 100 , 100 - 125 , 125 - 150 , 150 - 175 , 175 - 200 | ||
| Click To Change The Sort Order: By Market Cap or Company Size Performance: Year-to-date, Week and Day | |
| Select Chart Type: | ||
 Best Stocks Today 12Stocks.com |
© 2024 12Stocks.com Terms & Conditions Privacy Contact Us
All Information Provided Only For Education And Not To Be Used For Investing or Trading. See Terms & Conditions


One More Thing ... Get Best Stocks Delivered Daily!
Never Ever Miss A Move With Our Top Ten Stocks Lists
Find Best Stocks In Any Market - Bull or Bear Market
Take A Peek At Our Top Ten Stocks Lists: Daily, Weekly, Year-to-Date & Top Trends
Find Best Stocks In Any Market - Bull or Bear Market
Take A Peek At Our Top Ten Stocks Lists: Daily, Weekly, Year-to-Date & Top Trends
Latin America Stocks With Best Up Trends [0-bearish to 100-bullish]: Endeavour Silver[100], NovaGold Resources[100], First Majestic[100], Cameco [100], Fortuna Silver[100], SSR Mining[100], Eldorado Gold[100], Alamos Gold[100], Sprott Physical[100], Sandstorm Gold[100], Pan American[100]
Best Latin America Stocks Year-to-Date:
Aurora Cannabis[1473.92%], Banco Macro[127.21%], Fusion [123.65%], Canopy Growth[123.39%], Grupo Financiero[113.47%], Banco BBVA[111.58%], Endeavour Silver[95.94%], Grupo Supervielle[88.67%], Hudbay Minerals[82.25%], IAMGOLD [80.83%], Embraer S.A[65.26%] Best Latin America Stocks This Week:
Canopy Growth[29.13%], Canada Goose[22.63%], NovaGold Resources[22.18%], Trilogy Metals[20.7%], Aurora Cannabis[18.03%], Embraer S.A[17.63%], Endeavour Silver[16.27%], Hudbay Minerals[14.58%], Aurinia [13.75%], Lion Electric[11.64%], Ballard Power[10.95%] Best Latin America Stocks Daily:
Endeavour Silver[10.29%], NovaGold Resources[6.12%], Equinox Gold[5.74%], First Majestic[5.59%], Cameco [5.53%], Fortuna Silver[5.52%], SSR Mining[5.08%], New Gold[5.05%], Denison Mines[5.00%], McEwen Mining[4.91%], Gold Royalty[4.37%]