
 Login Sign Up


| |||||
 |  | ||||

| 12Stocks.com Market Intelligence |
Best Latin America Stocks
|
|
| Quick Read: Top Latin America Stocks By Performances & Trends: Daily, Weekly, Year-to-Date, Market Cap (Size) & Technical Trends | |||
| Best Latin America Views: Quick Browse View, Summary & Slide Show | |||
| 12Stocks.com Latin America Stocks Performances & Trends Daily | |||||||||
|
|  The overall market intelligence score is 10 (0-bearish to 100-bullish) which puts Latin America index in short term bearish trend. The market intelligence score from previous trading session is 0 and an improvement of trend continues.
| ||||||||
| Here are the market intelligence trend scores of the most requested Latin America stocks at 12Stocks.com (click stock name for detailed review): | |
| Scroll down this page for most comprehensive review of Latin America stocks by performance, trends, technical analysis, charts, fund plays & more | |


| 12Stocks.com: Top Performing Latin America Index Stocks | ||||||||||||||||||||||||||||||||||||||||||||||||
 The top performing Latin America Index stocks year to date are
Now, more recently, over last week, the top performing Latin America Index stocks on the move are


|
||||||||||||||||||||||||||||||||||||||||||||||||
| 12Stocks.com: Investing in Latin America Index with Stocks | |
|
The following table helps investors and traders sort through current performance and trends (as measured by market intelligence score) of various
stocks in the Latin America Index. Quick View: Move mouse or cursor over stock symbol (ticker) to view short-term technical chart and over stock name to view long term chart. Click on  to add stock symbol to your watchlist and to add stock symbol to your watchlist and  to view watchlist. Click on any ticker or stock name for detailed market intelligence report for that stock. to view watchlist. Click on any ticker or stock name for detailed market intelligence report for that stock. |
12Stocks.com Performance of Stocks in Latin America Index
| Ticker | Stock Name | Watchlist | Category | Recent Price | Market Intelligence Score | Change % | YTD Change% |
| ARCO | Arcos Dorados |   | Services & Goods | 9.11 | 10 | -0.33% | -28.21% |
| VLRS | Controladora Vuela | | Transports | 6.71 | 10 | -2.47% | -28.46% |
| MGA | Magna | | Services & Goods | 42.19 | 0 | -1.29% | -28.59% |
| VALE | Vale S.A | | Materials | 11.26 | 10 | -0.53% | -29.00% |
| VSTA | Vasta Platform | | Consumer Staples | 3.11 | 0 | -1.27% | -29.32% |
| BLDP | Ballard Power | | Industrials | 2.58 | 10 | -4.80% | -30.27% |
| TIXT | TELUS | | Technology | 5.89 | 48 | 1.20% | -31.11% |
| OTEX | Open Text | | Technology | 28.78 | 35 | 0.66% | -31.51% |
| BBD | Banco Bradesco | | Financials | 2.39 | 20 | 0.00% | -31.71% |
| STNE | StoneCo | | Technology | 12.14 | 0 | -2.02% | -32.67% |
| BBDO | Banco Bradesco | | Financials | 2.13 | 0 | -0.47% | -33.02% |
| BB | BlackBerry | | Technology | 2.34 | 0 | -7.14% | -33.90% |
| XP | XP | | Financials | 17.18 | 0 | -1.04% | -34.10% |
| CSIQ | Canadian Solar | | Technology | 17.04 | 15 | -5.70% | -35.04% |
| GGB | Gerdau S.A | | Materials | 3.13 | 10 | -1.88% | -35.46% |
| AUPH | Aurinia | | Health Care | 5.65 | 100 | 5.61% | -37.15% |
| LVRO | Lavoro | | Materials | 5.45 | 25 | -1.18% | -38.63% |
| CSAN | Cosan S.A | | Energy | 9.45 | 17 | 2.38% | -40.02% |
| LULU | Lululemon Athletica | | Consumer Staples | 306.01 | 32 | -0.48% | -40.15% |
| LEV | Lion Electric | | Industrials | 1.05 | 15 | -4.55% | -40.85% |
| SID | Companhia Siderurgica | | Materials | 2.25 | 20 | 0.45% | -42.75% |
| ABCL | AbCellera Biologics | | Health Care | 3.23 | 0 | -3.00% | -42.83% |
| BGI | Birks | | Services & Goods | 2.56 | 10 | 3.22% | -45.42% |
| AZUL | Azul S.A | | Transports | 5.10 | 20 | -0.78% | -47.37% |
| VMAR | Vision Marine | | Services & Goods | 0.56 | 10 | -4.25% | -47.94% |
| To view more stocks, click on Next / Previous arrows or select different range: 0 - 25 , 25 - 50 , 50 - 75 , 75 - 100 , 100 - 125 , 125 - 150 , 150 - 175 , 175 - 200 , 200 - 225 | ||
 | Click To Change The Sort Order: By Market Cap or Company Size Performance: Year-to-date, Week and Day |  |
| Detailed Overview Of Latin America Stocks |
| Latin America Technical Overview, Leaders & Laggards, Top Latin America ETF Funds & Detailed Latin America Stocks List, Charts, Trends & More |
| Latin America: Technical Analysis, Trends & YTD Performance | |
 ILF Weekly Chart |
|
| Long Term Trend: Not Good | |
| Medium Term Trend: Not Good | |
 ILF Daily Chart |
|
| Short Term Trend: Deteriorating | |
| Overall Trend Score: 10 | |
| YTD Performance: -16.41% | |
| **Trend Scores & Views Are Only For Educational Purposes And Not For Investing | |
| 12Stocks.com: Investing in Latin America Index using Exchange Traded Funds | |
|
The following table shows list of key exchange traded funds (ETF) that
help investors play Latin America stock market. For detailed view, check out our ETF Funds section of our website. Quick View: Move mouse or cursor over ETF symbol (ticker) to view short-term technical chart and over ETF name to view long term chart. Click on ticker or stock name for detailed view. Click on to add stock symbol to your watchlist and to view watchlist. |
12Stocks.com List of ETFs that track Latin America Index
| Ticker | ETF Name | Watchlist | Recent Price | Market Intelligence Score | Change % | Week % | Year-to-date % |
| ILF | Latin America 40 | | 24.29 | 10 | -0.45 | -5.27 | -16.41% |
| EWC | Canada | | 36.54 | 0 | -0.16 | -2.46 | -0.38% |
| FLN | Latin America AlphaDEX | | 17.95 | 10 | -0.55 | -2.6 | -13.66% |
| EWZ | Brazil | | 27.27 | 17 | -0.07 | -5.18 | -22% |
| EWW | Mexico | | 55.61 | 10 | -0.05 | -2.86 | -18.04% |
| ARGT | Argentina | | 58.46 | 58 | -0.73 | 2.35 | 13.87% |
| EWZS | Brazil Small-Cap | | 11.99 | 10 | -0.58 | -4.69 | -20.39% |
| BRF | Brazil Small-Cap | | 13.70 | 17 | -0.11 | -2.56 | -22.11% |
| BZQ | Short Brazil | | 15.11 | 83 | 0.46 | 7.93 | 50.65% |
| BRZU | Brazil Bull 3X | | 63.44 | 17 | -0.25 | -8.24 | -38.34% |
| FBZ | Brazil AlphaDEX | | 10.59 | 10 | 0.00 | -1.46 | -13.35% |
| 12Stocks.com: Charts, Trends, Fundamental Data and Performances of Latin America Stocks | |
|
We now take in-depth look at all Latin America stocks including charts, multi-period performances and overall trends (as measured by market intelligence score). One can sort Latin America stocks (click link to choose) by Daily, Weekly and by Year-to-Date performances. Also, one can sort by size of the company or by market capitalization. |
| Select Your Default Chart Type: | |||||
| |||||
| Click on stock symbol or name for detailed view. Click on to add stock symbol to your watchlist and to view watchlist. Quick View: Move mouse or cursor over "Daily" to quickly view daily technical stock chart and over "Weekly" to view weekly technical stock chart. | |||||

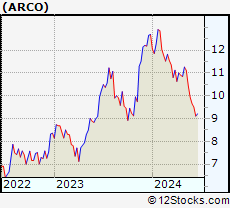 | ARCO Arcos Dorados Holdings Inc. |
| Sector: Services & Goods | |
| SubSector: Restaurants | |
| MarketCap: 778.87 Millions | |
| Recent Price: 9.11 Market Intelligence Score: 10 | |
| Day Percent Change: -0.33% Day Change: -0.03 | |
| Week Change: -4.11% Year-to-date Change: -28.2% | |
| ARCO Links: Profile News Message Board | |
| Charts:- Daily , Weekly | |
| Add ARCO to Watchlist: View: Get Complete ARCO Trend Analysis ➞ | |
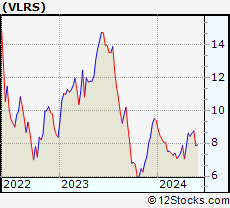 | VLRS Controladora Vuela Compania de Aviacion, S.A.B. de C.V. |
| Sector: Transports | |
| SubSector: Major Airlines | |
| MarketCap: 382 Millions | |
| Recent Price: 6.71 Market Intelligence Score: 10 | |
| Day Percent Change: -2.47% Day Change: -0.17 | |
| Week Change: -4.28% Year-to-date Change: -28.5% | |
| VLRS Links: Profile News Message Board | |
| Charts:- Daily , Weekly | |
| Add VLRS to Watchlist: View: Get Complete VLRS Trend Analysis ➞ | |
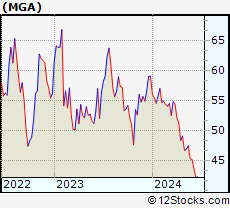 | MGA Magna International Inc. |
| Sector: Services & Goods | |
| SubSector: Auto Parts Wholesale | |
| MarketCap: 8967.3 Millions | |
| Recent Price: 42.19 Market Intelligence Score: 0 | |
| Day Percent Change: -1.29% Day Change: -0.55 | |
| Week Change: -3.59% Year-to-date Change: -28.6% | |
| MGA Links: Profile News Message Board | |
| Charts:- Daily , Weekly | |
| Add MGA to Watchlist: View: Get Complete MGA Trend Analysis ➞ | |
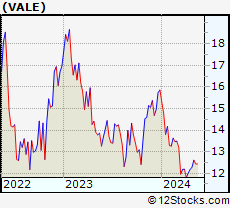 | VALE Vale S.A. |
| Sector: Materials | |
| SubSector: Industrial Metals & Minerals | |
| MarketCap: 43601 Millions | |
| Recent Price: 11.26 Market Intelligence Score: 10 | |
| Day Percent Change: -0.53% Day Change: -0.06 | |
| Week Change: -0.79% Year-to-date Change: -29.0% | |
| VALE Links: Profile News Message Board | |
| Charts:- Daily , Weekly | |
| Add VALE to Watchlist: View: Get Complete VALE Trend Analysis ➞ | |
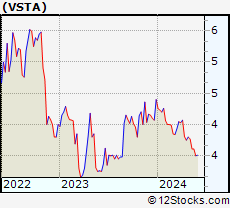 | VSTA Vasta Platform Limited |
| Sector: Consumer Staples | |
| SubSector: Education & Training Services | |
| MarketCap: 12747 Millions | |
| Recent Price: 3.11 Market Intelligence Score: 0 | |
| Day Percent Change: -1.27% Day Change: -0.04 | |
| Week Change: -8.53% Year-to-date Change: -29.3% | |
| VSTA Links: Profile News Message Board | |
| Charts:- Daily , Weekly | |
| Add VSTA to Watchlist: View: Get Complete VSTA Trend Analysis ➞ | |
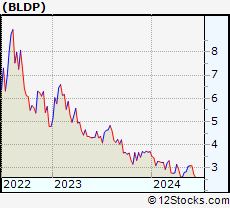 | BLDP Ballard Power Systems Inc. |
| Sector: Industrials | |
| SubSector: Industrial Electrical Equipment | |
| MarketCap: 2124.79 Millions | |
| Recent Price: 2.58 Market Intelligence Score: 10 | |
| Day Percent Change: -4.80% Day Change: -0.13 | |
| Week Change: -5.15% Year-to-date Change: -30.3% | |
| BLDP Links: Profile News Message Board | |
| Charts:- Daily , Weekly | |
| Add BLDP to Watchlist: View: Get Complete BLDP Trend Analysis ➞ | |
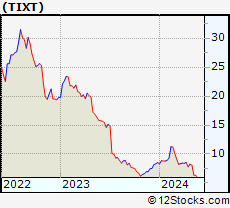 | TIXT TELUS International (Cda) Inc. |
| Sector: Technology | |
| SubSector: Software - Infrastructure | |
| MarketCap: 1470 Millions | |
| Recent Price: 5.89 Market Intelligence Score: 48 | |
| Day Percent Change: 1.20% Day Change: 0.07 | |
| Week Change: 0.68% Year-to-date Change: -31.1% | |
| TIXT Links: Profile News Message Board | |
| Charts:- Daily , Weekly | |
| Add TIXT to Watchlist: View: Get Complete TIXT Trend Analysis ➞ | |
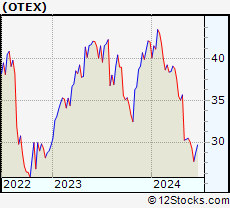 | OTEX Open Text Corporation |
| Sector: Technology | |
| SubSector: Application Software | |
| MarketCap: 9291.92 Millions | |
| Recent Price: 28.78 Market Intelligence Score: 35 | |
| Day Percent Change: 0.66% Day Change: 0.19 | |
| Week Change: 3.9% Year-to-date Change: -31.5% | |
| OTEX Links: Profile News Message Board | |
| Charts:- Daily , Weekly | |
| Add OTEX to Watchlist: View: Get Complete OTEX Trend Analysis ➞ | |
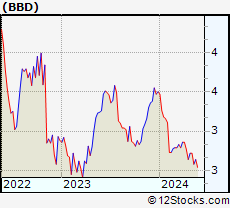 | BBD Banco Bradesco S.A. |
| Sector: Financials | |
| SubSector: Foreign Regional Banks | |
| MarketCap: 30281.7 Millions | |
| Recent Price: 2.39 Market Intelligence Score: 20 | |
| Day Percent Change: 0.00% Day Change: 0.00 | |
| Week Change: -2.45% Year-to-date Change: -31.7% | |
| BBD Links: Profile News Message Board | |
| Charts:- Daily , Weekly | |
| Add BBD to Watchlist: View: Get Complete BBD Trend Analysis ➞ | |
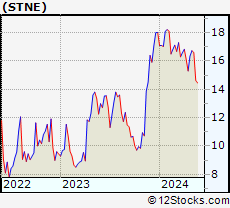 | STNE StoneCo Ltd. |
| Sector: Technology | |
| SubSector: Application Software | |
| MarketCap: 7347.82 Millions | |
| Recent Price: 12.14 Market Intelligence Score: 0 | |
| Day Percent Change: -2.02% Day Change: -0.25 | |
| Week Change: -8.31% Year-to-date Change: -32.7% | |
| STNE Links: Profile News Message Board | |
| Charts:- Daily , Weekly | |
| Add STNE to Watchlist: View: Get Complete STNE Trend Analysis ➞ | |
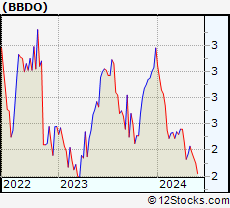 | BBDO Banco Bradesco S.A. |
| Sector: Financials | |
| SubSector: Foreign Regional Banks | |
| MarketCap: 27711.4 Millions | |
| Recent Price: 2.13 Market Intelligence Score: 0 | |
| Day Percent Change: -0.47% Day Change: -0.01 | |
| Week Change: -2.74% Year-to-date Change: -33.0% | |
| BBDO Links: Profile News Message Board | |
| Charts:- Daily , Weekly | |
| Add BBDO to Watchlist: View: Get Complete BBDO Trend Analysis ➞ | |
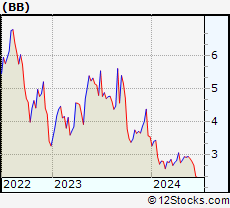 | BB BlackBerry Limited |
| Sector: Technology | |
| SubSector: Communication Equipment | |
| MarketCap: 2100.39 Millions | |
| Recent Price: 2.34 Market Intelligence Score: 0 | |
| Day Percent Change: -7.14% Day Change: -0.18 | |
| Week Change: -12.69% Year-to-date Change: -33.9% | |
| BB Links: Profile News Message Board | |
| Charts:- Daily , Weekly | |
| Add BB to Watchlist: View: Get Complete BB Trend Analysis ➞ | |
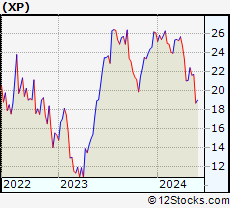 | XP XP Inc. |
| Sector: Financials | |
| SubSector: Asset Management | |
| MarketCap: 12990.3 Millions | |
| Recent Price: 17.18 Market Intelligence Score: 0 | |
| Day Percent Change: -1.04% Day Change: -0.18 | |
| Week Change: -8.76% Year-to-date Change: -34.1% | |
| XP Links: Profile News Message Board | |
| Charts:- Daily , Weekly | |
| Add XP to Watchlist: View: Get Complete XP Trend Analysis ➞ | |
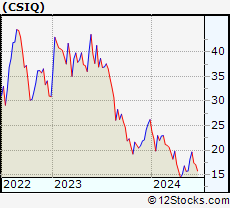 | CSIQ Canadian Solar Inc. |
| Sector: Technology | |
| SubSector: Semiconductor - Specialized | |
| MarketCap: 957.96 Millions | |
| Recent Price: 17.04 Market Intelligence Score: 15 | |
| Day Percent Change: -5.70% Day Change: -1.03 | |
| Week Change: -2.01% Year-to-date Change: -35.0% | |
| CSIQ Links: Profile News Message Board | |
| Charts:- Daily , Weekly | |
| Add CSIQ to Watchlist: View: Get Complete CSIQ Trend Analysis ➞ | |
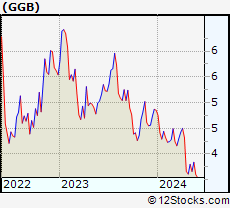 | GGB Gerdau S.A. |
| Sector: Materials | |
| SubSector: Steel & Iron | |
| MarketCap: 3607.48 Millions | |
| Recent Price: 3.13 Market Intelligence Score: 10 | |
| Day Percent Change: -1.88% Day Change: -0.06 | |
| Week Change: -0.95% Year-to-date Change: -35.5% | |
| GGB Links: Profile News Message Board | |
| Charts:- Daily , Weekly | |
| Add GGB to Watchlist: View: Get Complete GGB Trend Analysis ➞ | |
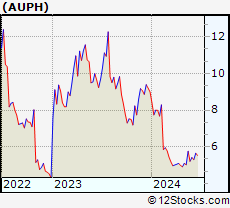 | AUPH Aurinia Pharmaceuticals Inc. |
| Sector: Health Care | |
| SubSector: Biotechnology | |
| MarketCap: 1319.75 Millions | |
| Recent Price: 5.65 Market Intelligence Score: 100 | |
| Day Percent Change: 5.61% Day Change: 0.30 | |
| Week Change: 6.6% Year-to-date Change: -37.2% | |
| AUPH Links: Profile News Message Board | |
| Charts:- Daily , Weekly | |
| Add AUPH to Watchlist: View: Get Complete AUPH Trend Analysis ➞ | |
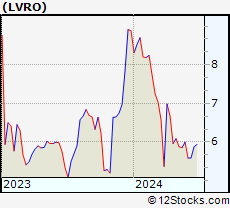 | LVRO Lavoro Limited |
| Sector: Materials | |
| SubSector: Agricultural Inputs | |
| MarketCap: 686 Millions | |
| Recent Price: 5.45 Market Intelligence Score: 25 | |
| Day Percent Change: -1.18% Day Change: -0.06 | |
| Week Change: -4.97% Year-to-date Change: -38.6% | |
| LVRO Links: Profile News Message Board | |
| Charts:- Daily , Weekly | |
| Add LVRO to Watchlist: View: Get Complete LVRO Trend Analysis ➞ | |
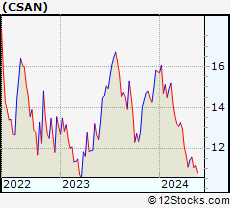 | CSAN Cosan S.A. |
| Sector: Energy | |
| SubSector: Oil & Gas Refining & Marketing | |
| MarketCap: 6890 Millions | |
| Recent Price: 9.45 Market Intelligence Score: 17 | |
| Day Percent Change: 2.38% Day Change: 0.22 | |
| Week Change: -4.64% Year-to-date Change: -40.0% | |
| CSAN Links: Profile News Message Board | |
| Charts:- Daily , Weekly | |
| Add CSAN to Watchlist: View: Get Complete CSAN Trend Analysis ➞ | |
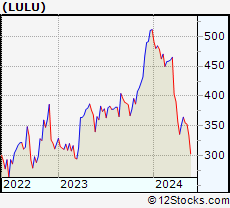 | LULU Lululemon Athletica Inc. |
| Sector: Consumer Staples | |
| SubSector: Textile - Apparel Clothing | |
| MarketCap: 24627.8 Millions | |
| Recent Price: 306.01 Market Intelligence Score: 32 | |
| Day Percent Change: -0.48% Day Change: -1.48 | |
| Week Change: -3.73% Year-to-date Change: -40.2% | |
| LULU Links: Profile News Message Board | |
| Charts:- Daily , Weekly | |
| Add LULU to Watchlist: View: Get Complete LULU Trend Analysis ➞ | |
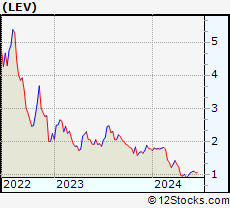 | LEV The Lion Electric Company |
| Sector: Industrials | |
| SubSector: Farm & Heavy Construction Machinery | |
| MarketCap: 414 Millions | |
| Recent Price: 1.05 Market Intelligence Score: 15 | |
| Day Percent Change: -4.55% Day Change: -0.05 | |
| Week Change: -4.55% Year-to-date Change: -40.9% | |
| LEV Links: Profile News Message Board | |
| Charts:- Daily , Weekly | |
| Add LEV to Watchlist: View: Get Complete LEV Trend Analysis ➞ | |
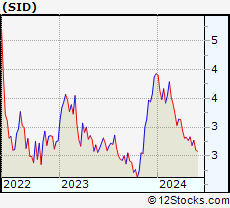 | SID Companhia Siderurgica Nacional |
| Sector: Materials | |
| SubSector: Steel & Iron | |
| MarketCap: 2087.58 Millions | |
| Recent Price: 2.25 Market Intelligence Score: 20 | |
| Day Percent Change: 0.45% Day Change: 0.01 | |
| Week Change: -3.43% Year-to-date Change: -42.8% | |
| SID Links: Profile News Message Board | |
| Charts:- Daily , Weekly | |
| Add SID to Watchlist: View: Get Complete SID Trend Analysis ➞ | |
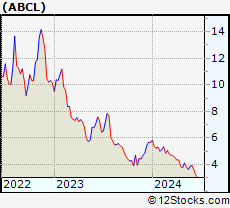 | ABCL AbCellera Biologics Inc. |
| Sector: Health Care | |
| SubSector: Biotechnology | |
| MarketCap: 1870 Millions | |
| Recent Price: 3.23 Market Intelligence Score: 0 | |
| Day Percent Change: -3.00% Day Change: -0.10 | |
| Week Change: -10.77% Year-to-date Change: -42.8% | |
| ABCL Links: Profile News Message Board | |
| Charts:- Daily , Weekly | |
| Add ABCL to Watchlist: View: Get Complete ABCL Trend Analysis ➞ | |
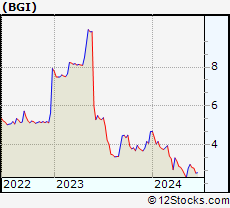 | BGI Birks Group Inc. |
| Sector: Services & Goods | |
| SubSector: Jewelry Stores | |
| MarketCap: 9 Millions | |
| Recent Price: 2.56 Market Intelligence Score: 10 | |
| Day Percent Change: 3.22% Day Change: 0.08 | |
| Week Change: -8.9% Year-to-date Change: -45.4% | |
| BGI Links: Profile News Message Board | |
| Charts:- Daily , Weekly | |
| Add BGI to Watchlist: View: Get Complete BGI Trend Analysis ➞ | |
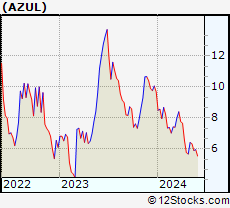 | AZUL Azul S.A. |
| Sector: Transports | |
| SubSector: Major Airlines | |
| MarketCap: 1289.85 Millions | |
| Recent Price: 5.10 Market Intelligence Score: 20 | |
| Day Percent Change: -0.78% Day Change: -0.04 | |
| Week Change: -1.35% Year-to-date Change: -47.4% | |
| AZUL Links: Profile News Message Board | |
| Charts:- Daily , Weekly | |
| Add AZUL to Watchlist: View: Get Complete AZUL Trend Analysis ➞ | |
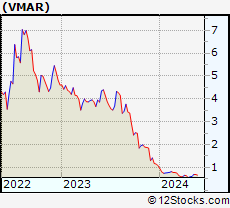 | VMAR Vision Marine Technologies Inc. |
| Sector: Services & Goods | |
| SubSector: Leisure | |
| MarketCap: 99027 Millions | |
| Recent Price: 0.56 Market Intelligence Score: 10 | |
| Day Percent Change: -4.25% Day Change: -0.03 | |
| Week Change: -11.67% Year-to-date Change: -47.9% | |
| VMAR Links: Profile News Message Board | |
| Charts:- Daily , Weekly | |
| Add VMAR to Watchlist: View: Get Complete VMAR Trend Analysis ➞ | |
| To view more stocks, click on Next / Previous arrows or select different range: 0 - 25 , 25 - 50 , 50 - 75 , 75 - 100 , 100 - 125 , 125 - 150 , 150 - 175 , 175 - 200 , 200 - 225 | ||
| Click To Change The Sort Order: By Market Cap or Company Size Performance: Year-to-date, Week and Day | |
| Select Chart Type: | ||
 Best Stocks Today 12Stocks.com |
© 2024 12Stocks.com Terms & Conditions Privacy Contact Us
All Information Provided Only For Education And Not To Be Used For Investing or Trading. See Terms & Conditions


One More Thing ... Get Best Stocks Delivered Daily!
Never Ever Miss A Move With Our Top Ten Stocks Lists
Find Best Stocks In Any Market - Bull or Bear Market
Take A Peek At Our Top Ten Stocks Lists: Daily, Weekly, Year-to-Date & Top Trends
Find Best Stocks In Any Market - Bull or Bear Market
Take A Peek At Our Top Ten Stocks Lists: Daily, Weekly, Year-to-Date & Top Trends
Latin America Stocks With Best Up Trends [0-bearish to 100-bullish]: Li-Cycle [100], Aurinia [100], Vox Royalty[93], Grupo Supervielle[90], Pampa Energia[83], GFL Environmental[83], Ritchie Bros.[81], Banco Macro[78], Transportadora de[78], Grupo Financiero[78], Banco BBVA[78]
Best Latin America Stocks Year-to-Date:
Aurora Cannabis[1105.38%], Li-Cycle [581.56%], Banco Macro[121.15%], Grupo Financiero[101.51%], Banco BBVA[92.65%], Endeavour Silver[81.22%], Grupo Supervielle[76.6%], Hudbay Minerals[57.79%], Embraer S.A[50.3%], McEwen Mining[43.69%], IAMGOLD [43.08%] Best Latin America Stocks This Week:
Li-Cycle [49.82%], Ivanhoe Electric[17.47%], Grupo Supervielle[15.65%], Transportadora de[11.62%], Banco Macro[11.21%], Vox Royalty[10.45%], Ritchie Bros.[10.06%], Shopify [9.86%], Grupo Financiero[9.85%], Central Puerto[8.82%], Pampa Energia[8.81%] Best Latin America Stocks Daily:
Li-Cycle [18.44%], Afya [5.91%], Aurinia [5.61%], Ambipar Emergency[5.00%], Shopify [4.59%], Vox Royalty[4.29%], D-Wave Quantum[3.64%], Inter & Co[2.84%], CI&T [2.73%], SilverCrest Metals[2.65%], Sprott Physical[2.47%]