
 Login Sign Up


| |||||
 |  | ||||

| 12Stocks.com Market Intelligence |
Best Latin America Stocks
|
|
| Quick Read: Top Latin America Stocks By Performances & Trends: Daily, Weekly, Year-to-Date, Market Cap (Size) & Technical Trends | |||
| Best Latin America Views: Quick Browse View, Summary & Slide Show | |||
| 12Stocks.com Latin America Stocks Performances & Trends Daily | |||||||||
|
|  The overall market intelligence score is 10 (0-bearish to 100-bullish) which puts Latin America index in short term bearish trend. The market intelligence score from previous trading session is 17 and hence a deterioration of trend.
| ||||||||
| Here are the market intelligence trend scores of the most requested Latin America stocks at 12Stocks.com (click stock name for detailed review): | |
| Scroll down this page for most comprehensive review of Latin America stocks by performance, trends, technical analysis, charts, fund plays & more | |


| 12Stocks.com: Top Performing Latin America Index Stocks | ||||||||||||||||||||||||||||||||||||||||||||||||
 The top performing Latin America Index stocks year to date are
Now, more recently, over last week, the top performing Latin America Index stocks on the move are


|
||||||||||||||||||||||||||||||||||||||||||||||||
| 12Stocks.com: Investing in Latin America Index with Stocks | |
|
The following table helps investors and traders sort through current performance and trends (as measured by market intelligence score) of various
stocks in the Latin America Index. Quick View: Move mouse or cursor over stock symbol (ticker) to view short-term technical chart and over stock name to view long term chart. Click on  to add stock symbol to your watchlist and to add stock symbol to your watchlist and  to view watchlist. Click on any ticker or stock name for detailed market intelligence report for that stock. to view watchlist. Click on any ticker or stock name for detailed market intelligence report for that stock. |
12Stocks.com Performance of Stocks in Latin America Index
| Ticker | Stock Name | Watchlist | Category | Recent Price | Market Intelligence Score | Change % | YTD Change% |
| GFL | GFL Environmental |   | Industrials | 31.47 | 25 | 1.32% | -8.81% |
| KFS | Kingsway Financial | | Financials | 8.02 | 25 | 0.25% | -4.52% |
| TIXT | TELUS | | Technology | 5.73 | 25 | 0.17% | -32.98% |
| XP | XP | | Financials | 18.99 | 25 | -0.37% | -27.16% |
| ABCL | AbCellera Biologics | | Health Care | 3.92 | 22 | -2.97% | -30.62% |
| VERO | Venus Concept | | Health Care | 0.53 | 20 | 3.92% | -55.08% |
| LAC | Lithium Americas | | Materials | 3.39 | 20 | 0.89% | -47.03% |
| AZUL | Azul S.A | | Transports | 5.45 | 20 | -1.62% | -43.76% |
| ONCY | Oncolytics Biotech | | Health Care | 1.07 | 20 | -0.93% | -20.74% |
| VTMX | Vesta Financials | | Financials | 34.84 | 18 | 0.61% | -12.39% |
| PROF | Profound Medical | | Materials | 7.37 | 18 | -1.73% | -13.19% |
| IMAX | IMAX | | Services & Goods | 16.44 | 18 | -1.14% | 9.45% |
| KOF | Coca-Cola FEMSA | | Consumer Staples | 93.66 | 18 | -0.98% | -1.04% |
| SLF | Sun Life | | Financials | 50.13 | 17 | 1.97% | -3.34% |
| BUR | Burcon Nutrascience | | Health Care | 14.44 | 17 | 1.91% | -7.44% |
| XENE | Xenon | | Health Care | 38.09 | 17 | -2.43% | -17.30% |
| QBTS | D-Wave Quantum | | Technology | 1.35 | 17 | -1.46% | 53.86% |
| CSAN | Cosan S.A | | Energy | 10.48 | 17 | -1.32% | -33.48% |
| CX | CEMEX S.A.B. | | Industrials | 7.53 | 17 | -1.18% | -2.84% |
| VSTA | Vasta Platform | | Consumer Staples | 3.50 | 17 | -0.57% | -20.45% |
| MXE | Mexico Equity | | Financials | 10.63 | 17 | -0.19% | -5.09% |
| OTEX | Open Text | | Technology | 29.25 | 15 | 1.42% | -30.39% |
| BAK | Braskem S.A | | Materials | 7.19 | 15 | -3.10% | -18.48% |
| WPRT | Westport Fuel | | Consumer Staples | 5.40 | 15 | -1.82% | -18.43% |
| BMO | Bank of Montreal | | Financials | 89.11 | 15 | 1.69% | -9.94% |
| To view more stocks, click on Next / Previous arrows or select different range: 0 - 25 , 25 - 50 , 50 - 75 , 75 - 100 , 100 - 125 , 125 - 150 , 150 - 175 , 175 - 200 , 200 - 225 | ||
 | Click To Change The Sort Order: By Market Cap or Company Size Performance: Year-to-date, Week and Day |  |
| Detailed Overview Of Latin America Stocks |
| Latin America Technical Overview, Leaders & Laggards, Top Latin America ETF Funds & Detailed Latin America Stocks List, Charts, Trends & More |
| Latin America: Technical Analysis, Trends & YTD Performance | |
 ILF Weekly Chart |
|
| Long Term Trend: Not Good | |
| Medium Term Trend: Not Good | |
 ILF Daily Chart |
|
| Short Term Trend: Not Good | |
| Overall Trend Score: 10 | |
| YTD Performance: -6.88% | |
| **Trend Scores & Views Are Only For Educational Purposes And Not For Investing | |
| 12Stocks.com: Investing in Latin America Index using Exchange Traded Funds | |
|
The following table shows list of key exchange traded funds (ETF) that
help investors play Latin America stock market. For detailed view, check out our ETF Funds section of our website. Quick View: Move mouse or cursor over ETF symbol (ticker) to view short-term technical chart and over ETF name to view long term chart. Click on ticker or stock name for detailed view. Click on to add stock symbol to your watchlist and to view watchlist. |
12Stocks.com List of ETFs that track Latin America Index
| Ticker | ETF Name | Watchlist | Recent Price | Market Intelligence Score | Change % | Week % | Year-to-date % |
| ILF | Latin America 40 | | 27.06 | 10 | -0.44 | -1.56 | -6.88% |
| EWC | Canada | | 38.26 | 76 | 1.49 | 0.08 | 4.31% |
| FLN | Latin America AlphaDEX | | 19.50 | 17 | 0.33 | -1.01 | -6.18% |
| EWZ | Brazil | | 29.60 | 0 | -1.43 | -2.73 | -15.33% |
| EWW | Mexico | | 64.90 | 31 | 0.20 | -1.55 | -4.35% |
| ARGT | Argentina | | 62.28 | 68 | -0.96 | 4.72 | 21.32% |
| EWZS | Brazil Small-Cap | | 12.97 | 0 | -1.18 | -2.85 | -13.88% |
| BRF | Brazil Small-Cap | | 14.69 | 17 | 0.15 | -2.31 | -16.46% |
| BZQ | Short Brazil | | 13.82 | 100 | 4.62 | 6.35 | 37.79% |
| BRZU | Brazil Bull 3X | | 70.46 | 0 | -2.92 | -5.51 | -31.51% |
| FBZ | Brazil AlphaDEX | | 11.24 | 17 | 0.72 | -1.71 | -8.03% |
| 12Stocks.com: Charts, Trends, Fundamental Data and Performances of Latin America Stocks | |
|
We now take in-depth look at all Latin America stocks including charts, multi-period performances and overall trends (as measured by market intelligence score). One can sort Latin America stocks (click link to choose) by Daily, Weekly and by Year-to-Date performances. Also, one can sort by size of the company or by market capitalization. |
| Select Your Default Chart Type: | |||||
| |||||
| Click on stock symbol or name for detailed view. Click on to add stock symbol to your watchlist and to view watchlist. Quick View: Move mouse or cursor over "Daily" to quickly view daily technical stock chart and over "Weekly" to view weekly technical stock chart. | |||||

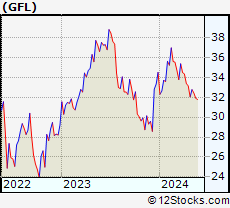 | GFL GFL Environmental Inc. |
| Sector: Industrials | |
| SubSector: Waste Management | |
| MarketCap: 87627 Millions | |
| Recent Price: 31.47 Market Intelligence Score: 25 | |
| Day Percent Change: 1.32% Day Change: 0.41 | |
| Week Change: 1.32% Year-to-date Change: -8.8% | |
| GFL Links: Profile News Message Board | |
| Charts:- Daily , Weekly | |
| Add GFL to Watchlist: View: Get Complete GFL Trend Analysis ➞ | |
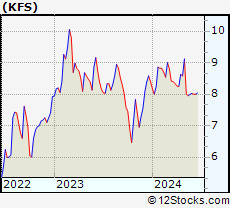 | KFS Kingsway Financial Services Inc. |
| Sector: Financials | |
| SubSector: Property & Casualty Insurance | |
| MarketCap: 47.5812 Millions | |
| Recent Price: 8.02 Market Intelligence Score: 25 | |
| Day Percent Change: 0.25% Day Change: 0.02 | |
| Week Change: 0.25% Year-to-date Change: -4.5% | |
| KFS Links: Profile News Message Board | |
| Charts:- Daily , Weekly | |
| Add KFS to Watchlist: View: Get Complete KFS Trend Analysis ➞ | |
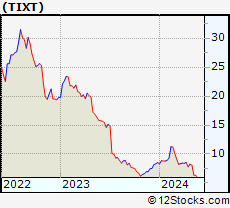 | TIXT TELUS International (Cda) Inc. |
| Sector: Technology | |
| SubSector: Software - Infrastructure | |
| MarketCap: 1470 Millions | |
| Recent Price: 5.73 Market Intelligence Score: 25 | |
| Day Percent Change: 0.17% Day Change: 0.01 | |
| Week Change: -3.05% Year-to-date Change: -33.0% | |
| TIXT Links: Profile News Message Board | |
| Charts:- Daily , Weekly | |
| Add TIXT to Watchlist: View: Get Complete TIXT Trend Analysis ➞ | |
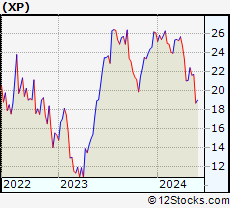 | XP XP Inc. |
| Sector: Financials | |
| SubSector: Asset Management | |
| MarketCap: 12990.3 Millions | |
| Recent Price: 18.99 Market Intelligence Score: 25 | |
| Day Percent Change: -0.37% Day Change: -0.07 | |
| Week Change: 1.66% Year-to-date Change: -27.2% | |
| XP Links: Profile News Message Board | |
| Charts:- Daily , Weekly | |
| Add XP to Watchlist: View: Get Complete XP Trend Analysis ➞ | |
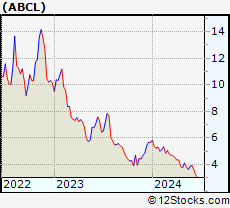 | ABCL AbCellera Biologics Inc. |
| Sector: Health Care | |
| SubSector: Biotechnology | |
| MarketCap: 1870 Millions | |
| Recent Price: 3.92 Market Intelligence Score: 22 | |
| Day Percent Change: -2.97% Day Change: -0.12 | |
| Week Change: 1.29% Year-to-date Change: -30.6% | |
| ABCL Links: Profile News Message Board | |
| Charts:- Daily , Weekly | |
| Add ABCL to Watchlist: View: Get Complete ABCL Trend Analysis ➞ | |
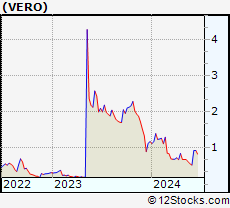 | VERO Venus Concept Inc. |
| Sector: Health Care | |
| SubSector: Medical Appliances & Equipment | |
| MarketCap: 101.08 Millions | |
| Recent Price: 0.53 Market Intelligence Score: 20 | |
| Day Percent Change: 3.92% Day Change: 0.02 | |
| Week Change: -6.18% Year-to-date Change: -55.1% | |
| VERO Links: Profile News Message Board | |
| Charts:- Daily , Weekly | |
| Add VERO to Watchlist: View: Get Complete VERO Trend Analysis ➞ | |
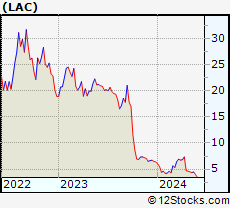 | LAC Lithium Americas Corp. |
| Sector: Materials | |
| SubSector: Industrial Metals & Minerals | |
| MarketCap: 192.01 Millions | |
| Recent Price: 3.39 Market Intelligence Score: 20 | |
| Day Percent Change: 0.89% Day Change: 0.03 | |
| Week Change: -13.3% Year-to-date Change: -47.0% | |
| LAC Links: Profile News Message Board | |
| Charts:- Daily , Weekly | |
| Add LAC to Watchlist: View: Get Complete LAC Trend Analysis ➞ | |
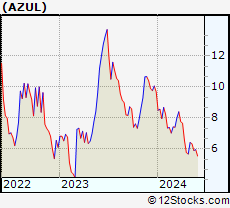 | AZUL Azul S.A. |
| Sector: Transports | |
| SubSector: Major Airlines | |
| MarketCap: 1289.85 Millions | |
| Recent Price: 5.45 Market Intelligence Score: 20 | |
| Day Percent Change: -1.62% Day Change: -0.09 | |
| Week Change: -8.56% Year-to-date Change: -43.8% | |
| AZUL Links: Profile News Message Board | |
| Charts:- Daily , Weekly | |
| Add AZUL to Watchlist: View: Get Complete AZUL Trend Analysis ➞ | |
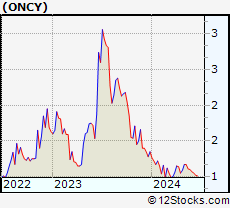 | ONCY Oncolytics Biotech Inc. |
| Sector: Health Care | |
| SubSector: Biotechnology | |
| MarketCap: 57.3785 Millions | |
| Recent Price: 1.07 Market Intelligence Score: 20 | |
| Day Percent Change: -0.93% Day Change: -0.01 | |
| Week Change: -2.73% Year-to-date Change: -20.7% | |
| ONCY Links: Profile News Message Board | |
| Charts:- Daily , Weekly | |
| Add ONCY to Watchlist: View: Get Complete ONCY Trend Analysis ➞ | |
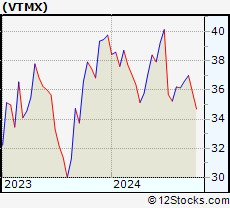 | VTMX Vesta Financials Corp SAB de CV |
| Sector: Financials | |
| SubSector: REIT - Industrial | |
| MarketCap: 2270 Millions | |
| Recent Price: 34.84 Market Intelligence Score: 18 | |
| Day Percent Change: 0.61% Day Change: 0.21 | |
| Week Change: -2.82% Year-to-date Change: -12.4% | |
| VTMX Links: Profile News Message Board | |
| Charts:- Daily , Weekly | |
| Add VTMX to Watchlist: View: Get Complete VTMX Trend Analysis ➞ | |
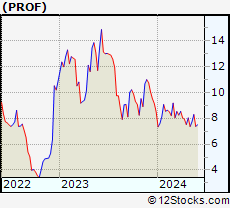 | PROF Profound Medical Corp. |
| Sector: Materials | |
| SubSector: Industrial Metals & Minerals | |
| MarketCap: 121.41 Millions | |
| Recent Price: 7.37 Market Intelligence Score: 18 | |
| Day Percent Change: -1.73% Day Change: -0.13 | |
| Week Change: 0% Year-to-date Change: -13.2% | |
| PROF Links: Profile News Message Board | |
| Charts:- Daily , Weekly | |
| Add PROF to Watchlist: View: Get Complete PROF Trend Analysis ➞ | |
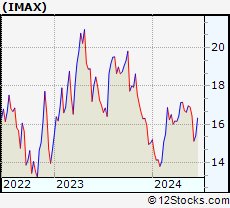 | IMAX IMAX Corporation |
| Sector: Services & Goods | |
| SubSector: Entertainment - Diversified | |
| MarketCap: 874.237 Millions | |
| Recent Price: 16.44 Market Intelligence Score: 18 | |
| Day Percent Change: -1.14% Day Change: -0.19 | |
| Week Change: -2.72% Year-to-date Change: 9.5% | |
| IMAX Links: Profile News Message Board | |
| Charts:- Daily , Weekly | |
| Add IMAX to Watchlist: View: Get Complete IMAX Trend Analysis ➞ | |
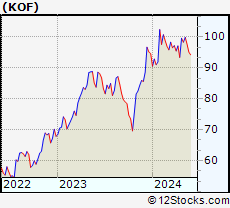 | KOF Coca-Cola FEMSA, S.A.B. de C.V. |
| Sector: Consumer Staples | |
| SubSector: Beverages - Soft Drinks | |
| MarketCap: 2258.9 Millions | |
| Recent Price: 93.66 Market Intelligence Score: 18 | |
| Day Percent Change: -0.98% Day Change: -0.93 | |
| Week Change: -1.51% Year-to-date Change: -1.0% | |
| KOF Links: Profile News Message Board | |
| Charts:- Daily , Weekly | |
| Add KOF to Watchlist: View: Get Complete KOF Trend Analysis ➞ | |
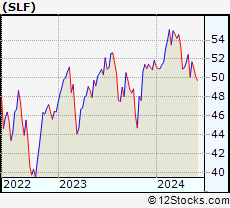 | SLF Sun Life Financial Inc. |
| Sector: Financials | |
| SubSector: Property & Casualty Insurance | |
| MarketCap: 17722 Millions | |
| Recent Price: 50.13 Market Intelligence Score: 17 | |
| Day Percent Change: 1.97% Day Change: 0.97 | |
| Week Change: -1.8% Year-to-date Change: -3.3% | |
| SLF Links: Profile News Message Board | |
| Charts:- Daily , Weekly | |
| Add SLF to Watchlist: View: Get Complete SLF Trend Analysis ➞ | |
 | BUR Burcon Nutrascience Corporation |
| Sector: Health Care | |
| SubSector: Biotechnology | |
| MarketCap: 0 Millions | |
| Recent Price: 14.44 Market Intelligence Score: 17 | |
| Day Percent Change: 1.91% Day Change: 0.27 | |
| Week Change: 1.33% Year-to-date Change: -7.4% | |
| BUR Links: Profile News Message Board | |
| Charts:- Daily , Weekly | |
| Add BUR to Watchlist: View: Get Complete BUR Trend Analysis ➞ | |
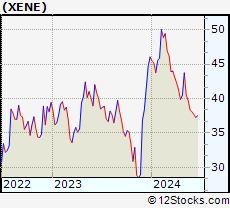 | XENE Xenon Pharmaceuticals Inc. |
| Sector: Health Care | |
| SubSector: Biotechnology | |
| MarketCap: 388.585 Millions | |
| Recent Price: 38.09 Market Intelligence Score: 17 | |
| Day Percent Change: -2.43% Day Change: -0.95 | |
| Week Change: -0.73% Year-to-date Change: -17.3% | |
| XENE Links: Profile News Message Board | |
| Charts:- Daily , Weekly | |
| Add XENE to Watchlist: View: Get Complete XENE Trend Analysis ➞ | |
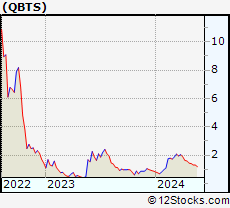 | QBTS D-Wave Quantum Inc. |
| Sector: Technology | |
| SubSector: Computer Hardware | |
| MarketCap: 290 Millions | |
| Recent Price: 1.35 Market Intelligence Score: 17 | |
| Day Percent Change: -1.46% Day Change: -0.02 | |
| Week Change: 15.38% Year-to-date Change: 53.9% | |
| QBTS Links: Profile News Message Board | |
| Charts:- Daily , Weekly | |
| Add QBTS to Watchlist: View: Get Complete QBTS Trend Analysis ➞ | |
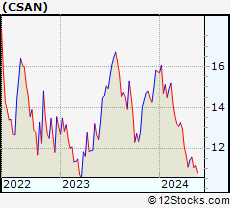 | CSAN Cosan S.A. |
| Sector: Energy | |
| SubSector: Oil & Gas Refining & Marketing | |
| MarketCap: 6890 Millions | |
| Recent Price: 10.48 Market Intelligence Score: 17 | |
| Day Percent Change: -1.32% Day Change: -0.14 | |
| Week Change: -2.87% Year-to-date Change: -33.5% | |
| CSAN Links: Profile News Message Board | |
| Charts:- Daily , Weekly | |
| Add CSAN to Watchlist: View: Get Complete CSAN Trend Analysis ➞ | |
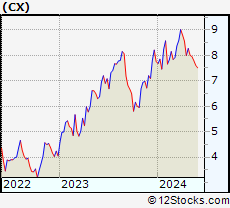 | CX CEMEX, S.A.B. de C.V. |
| Sector: Industrials | |
| SubSector: Cement | |
| MarketCap: 2948.23 Millions | |
| Recent Price: 7.53 Market Intelligence Score: 17 | |
| Day Percent Change: -1.18% Day Change: -0.09 | |
| Week Change: -1.05% Year-to-date Change: -2.8% | |
| CX Links: Profile News Message Board | |
| Charts:- Daily , Weekly | |
| Add CX to Watchlist: View: Get Complete CX Trend Analysis ➞ | |
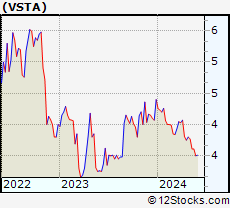 | VSTA Vasta Platform Limited |
| Sector: Consumer Staples | |
| SubSector: Education & Training Services | |
| MarketCap: 12747 Millions | |
| Recent Price: 3.50 Market Intelligence Score: 17 | |
| Day Percent Change: -0.57% Day Change: -0.02 | |
| Week Change: 0% Year-to-date Change: -20.5% | |
| VSTA Links: Profile News Message Board | |
| Charts:- Daily , Weekly | |
| Add VSTA to Watchlist: View: Get Complete VSTA Trend Analysis ➞ | |
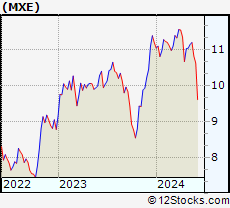 | MXE Mexico Equity & Income Fund Inc. |
| Sector: Financials | |
| SubSector: Asset Management | |
| MarketCap: 34.6203 Millions | |
| Recent Price: 10.63 Market Intelligence Score: 17 | |
| Day Percent Change: -0.19% Day Change: -0.02 | |
| Week Change: -1.76% Year-to-date Change: -5.1% | |
| MXE Links: Profile News Message Board | |
| Charts:- Daily , Weekly | |
| Add MXE to Watchlist: View: Get Complete MXE Trend Analysis ➞ | |
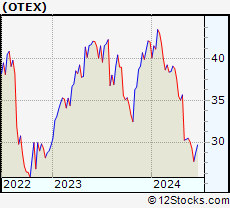 | OTEX Open Text Corporation |
| Sector: Technology | |
| SubSector: Application Software | |
| MarketCap: 9291.92 Millions | |
| Recent Price: 29.25 Market Intelligence Score: 15 | |
| Day Percent Change: 1.42% Day Change: 0.41 | |
| Week Change: -2.73% Year-to-date Change: -30.4% | |
| OTEX Links: Profile News Message Board | |
| Charts:- Daily , Weekly | |
| Add OTEX to Watchlist: View: Get Complete OTEX Trend Analysis ➞ | |
 | BAK Braskem S.A. |
| Sector: Materials | |
| SubSector: Chemicals - Major Diversified | |
| MarketCap: 2715.86 Millions | |
| Recent Price: 7.19 Market Intelligence Score: 15 | |
| Day Percent Change: -3.10% Day Change: -0.23 | |
| Week Change: -2.57% Year-to-date Change: -18.5% | |
| BAK Links: Profile News Message Board | |
| Charts:- Daily , Weekly | |
| Add BAK to Watchlist: View: Get Complete BAK Trend Analysis ➞ | |
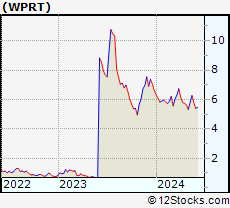 | WPRT Westport Fuel Systems Inc. |
| Sector: Consumer Staples | |
| SubSector: Auto Parts | |
| MarketCap: 108.939 Millions | |
| Recent Price: 5.40 Market Intelligence Score: 15 | |
| Day Percent Change: -1.82% Day Change: -0.10 | |
| Week Change: -6.57% Year-to-date Change: -18.4% | |
| WPRT Links: Profile News Message Board | |
| Charts:- Daily , Weekly | |
| Add WPRT to Watchlist: View: Get Complete WPRT Trend Analysis ➞ | |
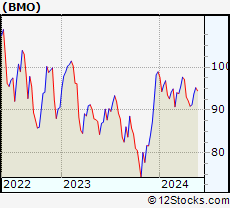 | BMO Bank of Montreal |
| Sector: Financials | |
| SubSector: Money Center Banks | |
| MarketCap: 32830.2 Millions | |
| Recent Price: 89.11 Market Intelligence Score: 15 | |
| Day Percent Change: 1.69% Day Change: 1.48 | |
| Week Change: -6.66% Year-to-date Change: -9.9% | |
| BMO Links: Profile News Message Board | |
| Charts:- Daily , Weekly | |
| Add BMO to Watchlist: View: Get Complete BMO Trend Analysis ➞ | |
| To view more stocks, click on Next / Previous arrows or select different range: 0 - 25 , 25 - 50 , 50 - 75 , 75 - 100 , 100 - 125 , 125 - 150 , 150 - 175 , 175 - 200 , 200 - 225 | ||
| Click To Change The Sort Order: By Market Cap or Company Size Performance: Year-to-date, Week and Day | |
| Select Chart Type: | ||
 Best Stocks Today 12Stocks.com |
© 2024 12Stocks.com Terms & Conditions Privacy Contact Us
All Information Provided Only For Education And Not To Be Used For Investing or Trading. See Terms & Conditions


One More Thing ... Get Best Stocks Delivered Daily!
Never Ever Miss A Move With Our Top Ten Stocks Lists
Find Best Stocks In Any Market - Bull or Bear Market
Take A Peek At Our Top Ten Stocks Lists: Daily, Weekly, Year-to-Date & Top Trends
Find Best Stocks In Any Market - Bull or Bear Market
Take A Peek At Our Top Ten Stocks Lists: Daily, Weekly, Year-to-Date & Top Trends
Latin America Stocks With Best Up Trends [0-bearish to 100-bullish]: Gildan Activewear[100], Cameco [100], Methanex [100], Royal Bank[100], TransAlta [100], Tucows [100], Pembina Pipeline[95], Denison Mines[95], City Office[93], MercadoLibre [93], Canada Goose[90]
Best Latin America Stocks Year-to-Date:
Aurora Cannabis[1199.87%], Banco Macro[130.98%], Fusion [124.17%], Grupo Financiero[107.65%], Banco BBVA[107.54%], Endeavour Silver[101.52%], Grupo Supervielle[78.33%], Hudbay Minerals[76.81%], Canopy Growth[66.93%], McEwen Mining[65.19%], Fortuna Silver[61.66%] Best Latin America Stocks This Week:
SunOpta [15.58%], D-Wave Quantum[15.38%], Banco BBVA[14.74%], Banco Macro[13.7%], Tucows [13.61%], Repare [12.62%], IRSA Inversiones[12.15%], Grupo Supervielle[11.73%], New Gold[11.17%], YPF Sociedad[10.47%], Grupo Financiero[10.41%] Best Latin America Stocks Daily:
Gold Royalty[12.41%], SunOpta [7.32%], Vitru [4.66%], Ambipar Emergency[4.41%], Bausch Health[4.29%], Bioceres Crop[4.06%], Repare [3.88%], Cronos [3.60%], Grupo Aeroportuario[3.47%], Lululemon Athletica[3.00%], CI&T [2.96%]