
 Login Sign Up


| |||||
 |  | ||||

| 12Stocks.com Market Intelligence |
Best Latin America Stocks
|
|
| Quick Read: Top Latin America Stocks By Performances & Trends: Daily, Weekly, Year-to-Date, Market Cap (Size) & Technical Trends | |||
| Best Latin America Views: Quick Browse View, Summary & Slide Show | |||
| 12Stocks.com Latin America Stocks Performances & Trends Daily | |||||||||
|
|  The overall market intelligence score is 10 (0-bearish to 100-bullish) which puts Latin America index in short term bearish trend. The market intelligence score from previous trading session is 17 and hence a deterioration of trend.
| ||||||||
| Here are the market intelligence trend scores of the most requested Latin America stocks at 12Stocks.com (click stock name for detailed review): | |
| Scroll down this page for most comprehensive review of Latin America stocks by performance, trends, technical analysis, charts, fund plays & more | |


| 12Stocks.com: Top Performing Latin America Index Stocks | ||||||||||||||||||||||||||||||||||||||||||||||||
 The top performing Latin America Index stocks year to date are
Now, more recently, over last week, the top performing Latin America Index stocks on the move are


|
||||||||||||||||||||||||||||||||||||||||||||||||
| 12Stocks.com: Investing in Latin America Index with Stocks | |
|
The following table helps investors and traders sort through current performance and trends (as measured by market intelligence score) of various
stocks in the Latin America Index. Quick View: Move mouse or cursor over stock symbol (ticker) to view short-term technical chart and over stock name to view long term chart. Click on  to add stock symbol to your watchlist and to add stock symbol to your watchlist and  to view watchlist. Click on any ticker or stock name for detailed market intelligence report for that stock. to view watchlist. Click on any ticker or stock name for detailed market intelligence report for that stock. |
12Stocks.com Performance of Stocks in Latin America Index
| Ticker | Stock Name | Watchlist | Category | Recent Price | Market Intelligence Score | Change % | YTD Change% |
| BUR | Burcon Nutrascience |   | Health Care | 14.44 | 17 | 1.91% | -7.44% |
| TU | TELUS | | Technology | 16.45 | 67 | 1.98% | -7.53% |
| ACST | Acasti Pharma | | Health Care | 2.67 | 32 | 1.87% | -7.61% |
| GIB | CGI | | Technology | 99.00 | 10 | 0.97% | -7.66% |
| NAK | Northern Dynasty | | Materials | 0.30 | 58 | -3.46% | -7.70% |
| GFL | GFL Environmental | | Industrials | 31.47 | 25 | 1.32% | -8.81% |
| LND | BrasilAgro - | | Financials | 4.80 | 0 | -1.84% | -9.09% |
| FSV | FirstService | | Financials | 147.12 | 42 | 2.43% | -9.24% |
| BLCO | Bausch + | | Health Care | 15.34 | 47 | -0.32% | -9.76% |
| BMO | Bank of Montreal | | Financials | 89.11 | 15 | 1.69% | -9.94% |
| MIST | Milestone | | Health Care | 1.50 | 10 | -1.96% | -10.18% |
| CIGI | Colliers | | Financials | 112.16 | 50 | 1.00% | -11.35% |
| BTG | B2Gold | | Materials | 2.80 | 70 | -1.41% | -11.39% |
| FMX | Fomento Economico | | Consumer Staples | 114.62 | 0 | -1.39% | -12.07% |
| QSR | Restaurant Brands | | Services & Goods | 68.58 | 32 | 2.70% | -12.22% |
| VTMX | Vesta Financials | | Financials | 34.84 | 18 | 0.61% | -12.39% |
| DOOO | BRP | | Consumer Staples | 62.50 | 10 | -5.82% | -12.82% |
| CAE | CAE | | Industrials | 18.78 | 58 | 1.24% | -13.02% |
| BCE | BCE | | Technology | 34.21 | 60 | 1.63% | -13.13% |
| PROF | Profound Medical | | Materials | 7.37 | 18 | -1.73% | -13.19% |
| TAC | TransAlta | | Utilities | 7.20 | 100 | 0.14% | -13.36% |
| TD | Toronto-Dominion Bank | | Financials | 55.92 | 50 | 1.75% | -13.46% |
| RCI | Rogers | | Technology | 40.40 | 74 | 2.05% | -13.69% |
| ITUB | Itau Unibanco | | Financials | 5.99 | 0 | -1.32% | -13.81% |
| BIOX | Bioceres Crop | | Industrials | 11.78 | 39 | 4.06% | -14.20% |
| To view more stocks, click on Next / Previous arrows or select different range: 0 - 25 , 25 - 50 , 50 - 75 , 75 - 100 , 100 - 125 , 125 - 150 , 150 - 175 , 175 - 200 , 200 - 225 | ||
 | Click To Change The Sort Order: By Market Cap or Company Size Performance: Year-to-date, Week and Day |  |
| Detailed Overview Of Latin America Stocks |
| Latin America Technical Overview, Leaders & Laggards, Top Latin America ETF Funds & Detailed Latin America Stocks List, Charts, Trends & More |
| Latin America: Technical Analysis, Trends & YTD Performance | |
 ILF Weekly Chart |
|
| Long Term Trend: Not Good | |
| Medium Term Trend: Not Good | |
 ILF Daily Chart |
|
| Short Term Trend: Not Good | |
| Overall Trend Score: 10 | |
| YTD Performance: -6.88% | |
| **Trend Scores & Views Are Only For Educational Purposes And Not For Investing | |
| 12Stocks.com: Investing in Latin America Index using Exchange Traded Funds | |
|
The following table shows list of key exchange traded funds (ETF) that
help investors play Latin America stock market. For detailed view, check out our ETF Funds section of our website. Quick View: Move mouse or cursor over ETF symbol (ticker) to view short-term technical chart and over ETF name to view long term chart. Click on ticker or stock name for detailed view. Click on to add stock symbol to your watchlist and to view watchlist. |
12Stocks.com List of ETFs that track Latin America Index
| Ticker | ETF Name | Watchlist | Recent Price | Market Intelligence Score | Change % | Week % | Year-to-date % |
| ILF | Latin America 40 | | 27.06 | 10 | -0.44 | -1.56 | -6.88% |
| EWC | Canada | | 38.26 | 76 | 1.49 | 0.08 | 4.31% |
| FLN | Latin America AlphaDEX | | 19.50 | 17 | 0.33 | -1.01 | -6.18% |
| EWZ | Brazil | | 29.60 | 0 | -1.43 | -2.73 | -15.33% |
| EWW | Mexico | | 64.90 | 31 | 0.20 | -1.55 | -4.35% |
| ARGT | Argentina | | 62.28 | 68 | -0.96 | 4.72 | 21.32% |
| EWZS | Brazil Small-Cap | | 12.97 | 0 | -1.18 | -2.85 | -13.88% |
| BRF | Brazil Small-Cap | | 14.69 | 17 | 0.15 | -2.31 | -16.46% |
| BZQ | Short Brazil | | 13.82 | 100 | 4.62 | 6.35 | 37.79% |
| BRZU | Brazil Bull 3X | | 70.46 | 0 | -2.92 | -5.51 | -31.51% |
| FBZ | Brazil AlphaDEX | | 11.24 | 17 | 0.72 | -1.71 | -8.03% |
| 12Stocks.com: Charts, Trends, Fundamental Data and Performances of Latin America Stocks | |
|
We now take in-depth look at all Latin America stocks including charts, multi-period performances and overall trends (as measured by market intelligence score). One can sort Latin America stocks (click link to choose) by Daily, Weekly and by Year-to-Date performances. Also, one can sort by size of the company or by market capitalization. |
| Select Your Default Chart Type: | |||||
| |||||
| Click on stock symbol or name for detailed view. Click on to add stock symbol to your watchlist and to view watchlist. Quick View: Move mouse or cursor over "Daily" to quickly view daily technical stock chart and over "Weekly" to view weekly technical stock chart. | |||||

 | BUR Burcon Nutrascience Corporation |
| Sector: Health Care | |
| SubSector: Biotechnology | |
| MarketCap: 0 Millions | |
| Recent Price: 14.44 Market Intelligence Score: 17 | |
| Day Percent Change: 1.91% Day Change: 0.27 | |
| Week Change: 1.33% Year-to-date Change: -7.4% | |
| BUR Links: Profile News Message Board | |
| Charts:- Daily , Weekly | |
| Add BUR to Watchlist: View: Get Complete BUR Trend Analysis ➞ | |
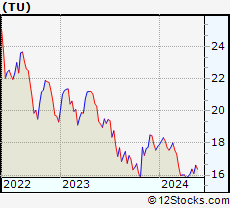 | TU TELUS Corporation |
| Sector: Technology | |
| SubSector: Wireless Communications | |
| MarketCap: 10864.7 Millions | |
| Recent Price: 16.45 Market Intelligence Score: 67 | |
| Day Percent Change: 1.98% Day Change: 0.32 | |
| Week Change: 1.04% Year-to-date Change: -7.5% | |
| TU Links: Profile News Message Board | |
| Charts:- Daily , Weekly | |
| Add TU to Watchlist: View: Get Complete TU Trend Analysis ➞ | |
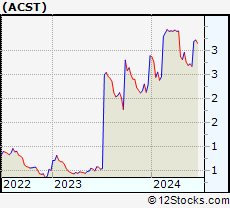 | ACST Acasti Pharma Inc. |
| Sector: Health Care | |
| SubSector: Biotechnology | |
| MarketCap: 28.2785 Millions | |
| Recent Price: 2.67 Market Intelligence Score: 32 | |
| Day Percent Change: 1.87% Day Change: 0.05 | |
| Week Change: -1.84% Year-to-date Change: -7.6% | |
| ACST Links: Profile News Message Board | |
| Charts:- Daily , Weekly | |
| Add ACST to Watchlist: View: Get Complete ACST Trend Analysis ➞ | |
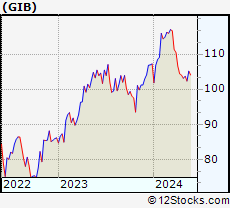 | GIB CGI Inc. |
| Sector: Technology | |
| SubSector: Information Technology Services | |
| MarketCap: 13185.3 Millions | |
| Recent Price: 99.00 Market Intelligence Score: 10 | |
| Day Percent Change: 0.97% Day Change: 0.95 | |
| Week Change: -4.98% Year-to-date Change: -7.7% | |
| GIB Links: Profile News Message Board | |
| Charts:- Daily , Weekly | |
| Add GIB to Watchlist: View: Get Complete GIB Trend Analysis ➞ | |
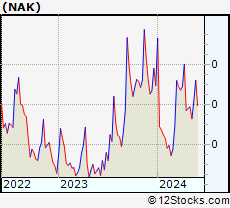 | NAK Northern Dynasty Minerals Ltd. |
| Sector: Materials | |
| SubSector: Industrial Metals & Minerals | |
| MarketCap: 167.01 Millions | |
| Recent Price: 0.30 Market Intelligence Score: 58 | |
| Day Percent Change: -3.46% Day Change: -0.01 | |
| Week Change: -9.58% Year-to-date Change: -7.7% | |
| NAK Links: Profile News Message Board | |
| Charts:- Daily , Weekly | |
| Add NAK to Watchlist: View: Get Complete NAK Trend Analysis ➞ | |
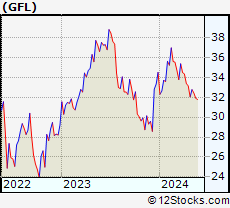 | GFL GFL Environmental Inc. |
| Sector: Industrials | |
| SubSector: Waste Management | |
| MarketCap: 87627 Millions | |
| Recent Price: 31.47 Market Intelligence Score: 25 | |
| Day Percent Change: 1.32% Day Change: 0.41 | |
| Week Change: 1.32% Year-to-date Change: -8.8% | |
| GFL Links: Profile News Message Board | |
| Charts:- Daily , Weekly | |
| Add GFL to Watchlist: View: Get Complete GFL Trend Analysis ➞ | |
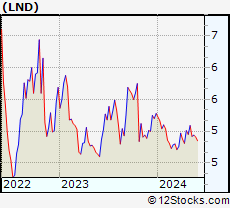 | LND BrasilAgro - Companhia Brasileira de Propriedades Agricolas |
| Sector: Financials | |
| SubSector: Property Management | |
| MarketCap: 157.842 Millions | |
| Recent Price: 4.80 Market Intelligence Score: 0 | |
| Day Percent Change: -1.84% Day Change: -0.09 | |
| Week Change: -2.24% Year-to-date Change: -9.1% | |
| LND Links: Profile News Message Board | |
| Charts:- Daily , Weekly | |
| Add LND to Watchlist: View: Get Complete LND Trend Analysis ➞ | |
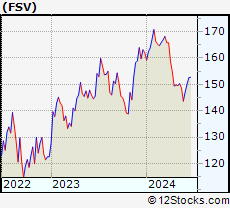 | FSV FirstService Corporation |
| Sector: Financials | |
| SubSector: Property Management | |
| MarketCap: 2793.92 Millions | |
| Recent Price: 147.12 Market Intelligence Score: 42 | |
| Day Percent Change: 2.43% Day Change: 3.49 | |
| Week Change: 2.42% Year-to-date Change: -9.2% | |
| FSV Links: Profile News Message Board | |
| Charts:- Daily , Weekly | |
| Add FSV to Watchlist: View: Get Complete FSV Trend Analysis ➞ | |
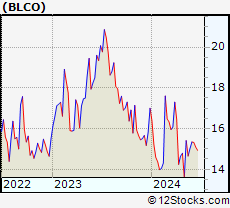 | BLCO Bausch + Lomb Corporation |
| Sector: Health Care | |
| SubSector: Medical Instruments & Supplies | |
| MarketCap: 7100 Millions | |
| Recent Price: 15.34 Market Intelligence Score: 47 | |
| Day Percent Change: -0.32% Day Change: -0.05 | |
| Week Change: 2.13% Year-to-date Change: -9.8% | |
| BLCO Links: Profile News Message Board | |
| Charts:- Daily , Weekly | |
| Add BLCO to Watchlist: View: Get Complete BLCO Trend Analysis ➞ | |
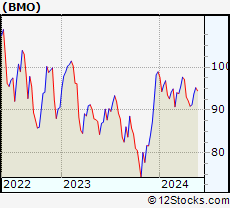 | BMO Bank of Montreal |
| Sector: Financials | |
| SubSector: Money Center Banks | |
| MarketCap: 32830.2 Millions | |
| Recent Price: 89.11 Market Intelligence Score: 15 | |
| Day Percent Change: 1.69% Day Change: 1.48 | |
| Week Change: -6.66% Year-to-date Change: -9.9% | |
| BMO Links: Profile News Message Board | |
| Charts:- Daily , Weekly | |
| Add BMO to Watchlist: View: Get Complete BMO Trend Analysis ➞ | |
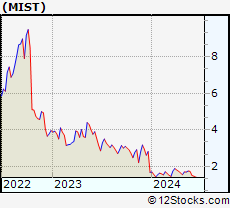 | MIST Milestone Pharmaceuticals Inc. |
| Sector: Health Care | |
| SubSector: Biotechnology | |
| MarketCap: 342.685 Millions | |
| Recent Price: 1.50 Market Intelligence Score: 10 | |
| Day Percent Change: -1.96% Day Change: -0.03 | |
| Week Change: -13.04% Year-to-date Change: -10.2% | |
| MIST Links: Profile News Message Board | |
| Charts:- Daily , Weekly | |
| Add MIST to Watchlist: View: Get Complete MIST Trend Analysis ➞ | |
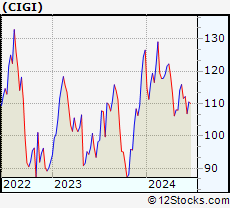 | CIGI Colliers International Group Inc. |
| Sector: Financials | |
| SubSector: Property Management | |
| MarketCap: 1928.42 Millions | |
| Recent Price: 112.16 Market Intelligence Score: 50 | |
| Day Percent Change: 1.00% Day Change: 1.11 | |
| Week Change: 0.49% Year-to-date Change: -11.4% | |
| CIGI Links: Profile News Message Board | |
| Charts:- Daily , Weekly | |
| Add CIGI to Watchlist: View: Get Complete CIGI Trend Analysis ➞ | |
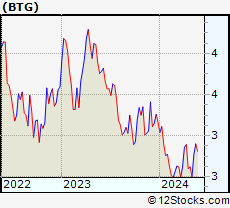 | BTG B2Gold Corp. |
| Sector: Materials | |
| SubSector: Gold | |
| MarketCap: 2792.39 Millions | |
| Recent Price: 2.80 Market Intelligence Score: 70 | |
| Day Percent Change: -1.41% Day Change: -0.04 | |
| Week Change: 1.45% Year-to-date Change: -11.4% | |
| BTG Links: Profile News Message Board | |
| Charts:- Daily , Weekly | |
| Add BTG to Watchlist: View: Get Complete BTG Trend Analysis ➞ | |
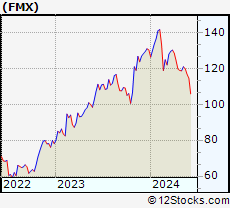 | FMX Fomento Economico Mexicano, S.A.B. de C.V. |
| Sector: Consumer Staples | |
| SubSector: Beverages - Brewers | |
| MarketCap: 22018.7 Millions | |
| Recent Price: 114.62 Market Intelligence Score: 0 | |
| Day Percent Change: -1.39% Day Change: -1.62 | |
| Week Change: -1.82% Year-to-date Change: -12.1% | |
| FMX Links: Profile News Message Board | |
| Charts:- Daily , Weekly | |
| Add FMX to Watchlist: View: Get Complete FMX Trend Analysis ➞ | |
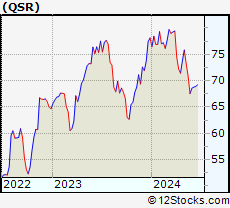 | QSR Restaurant Brands International Inc. |
| Sector: Services & Goods | |
| SubSector: Restaurants | |
| MarketCap: 9551 Millions | |
| Recent Price: 68.58 Market Intelligence Score: 32 | |
| Day Percent Change: 2.70% Day Change: 1.80 | |
| Week Change: 1.55% Year-to-date Change: -12.2% | |
| QSR Links: Profile News Message Board | |
| Charts:- Daily , Weekly | |
| Add QSR to Watchlist: View: Get Complete QSR Trend Analysis ➞ | |
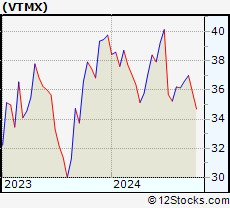 | VTMX Vesta Financials Corp SAB de CV |
| Sector: Financials | |
| SubSector: REIT - Industrial | |
| MarketCap: 2270 Millions | |
| Recent Price: 34.84 Market Intelligence Score: 18 | |
| Day Percent Change: 0.61% Day Change: 0.21 | |
| Week Change: -2.82% Year-to-date Change: -12.4% | |
| VTMX Links: Profile News Message Board | |
| Charts:- Daily , Weekly | |
| Add VTMX to Watchlist: View: Get Complete VTMX Trend Analysis ➞ | |
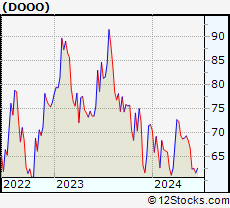 | DOOO BRP Inc. |
| Sector: Consumer Staples | |
| SubSector: Recreational Vehicles | |
| MarketCap: 638.559 Millions | |
| Recent Price: 62.50 Market Intelligence Score: 10 | |
| Day Percent Change: -5.82% Day Change: -3.86 | |
| Week Change: -6.51% Year-to-date Change: -12.8% | |
| DOOO Links: Profile News Message Board | |
| Charts:- Daily , Weekly | |
| Add DOOO to Watchlist: View: Get Complete DOOO Trend Analysis ➞ | |
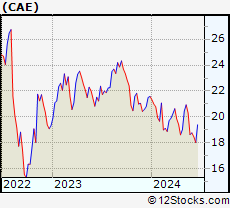 | CAE CAE Inc. |
| Sector: Industrials | |
| SubSector: Aerospace/Defense Products & Services | |
| MarketCap: 3739.61 Millions | |
| Recent Price: 18.78 Market Intelligence Score: 58 | |
| Day Percent Change: 1.24% Day Change: 0.23 | |
| Week Change: 0.7% Year-to-date Change: -13.0% | |
| CAE Links: Profile News Message Board | |
| Charts:- Daily , Weekly | |
| Add CAE to Watchlist: View: Get Complete CAE Trend Analysis ➞ | |
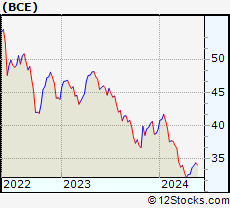 | BCE BCE Inc. |
| Sector: Technology | |
| SubSector: Telecom Services - Domestic | |
| MarketCap: 37288.3 Millions | |
| Recent Price: 34.21 Market Intelligence Score: 60 | |
| Day Percent Change: 1.63% Day Change: 0.55 | |
| Week Change: 1.91% Year-to-date Change: -13.1% | |
| BCE Links: Profile News Message Board | |
| Charts:- Daily , Weekly | |
| Add BCE to Watchlist: View: Get Complete BCE Trend Analysis ➞ | |
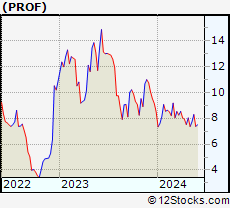 | PROF Profound Medical Corp. |
| Sector: Materials | |
| SubSector: Industrial Metals & Minerals | |
| MarketCap: 121.41 Millions | |
| Recent Price: 7.37 Market Intelligence Score: 18 | |
| Day Percent Change: -1.73% Day Change: -0.13 | |
| Week Change: 0% Year-to-date Change: -13.2% | |
| PROF Links: Profile News Message Board | |
| Charts:- Daily , Weekly | |
| Add PROF to Watchlist: View: Get Complete PROF Trend Analysis ➞ | |
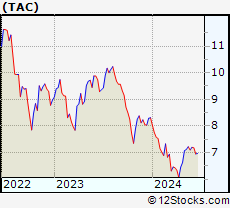 | TAC TransAlta Corporation |
| Sector: Utilities | |
| SubSector: Diversified Utilities | |
| MarketCap: 1487.8 Millions | |
| Recent Price: 7.20 Market Intelligence Score: 100 | |
| Day Percent Change: 0.14% Day Change: 0.01 | |
| Week Change: 1.41% Year-to-date Change: -13.4% | |
| TAC Links: Profile News Message Board | |
| Charts:- Daily , Weekly | |
| Add TAC to Watchlist: View: Get Complete TAC Trend Analysis ➞ | |
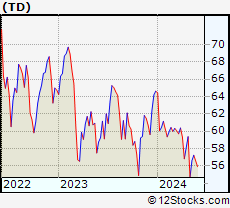 | TD The Toronto-Dominion Bank |
| Sector: Financials | |
| SubSector: Money Center Banks | |
| MarketCap: 75152.4 Millions | |
| Recent Price: 55.92 Market Intelligence Score: 50 | |
| Day Percent Change: 1.75% Day Change: 0.96 | |
| Week Change: -1.13% Year-to-date Change: -13.5% | |
| TD Links: Profile News Message Board | |
| Charts:- Daily , Weekly | |
| Add TD to Watchlist: View: Get Complete TD Trend Analysis ➞ | |
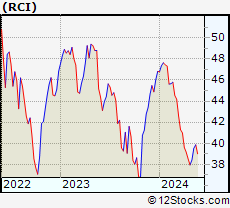 | RCI Rogers Communications Inc. |
| Sector: Technology | |
| SubSector: Wireless Communications | |
| MarketCap: 22111.6 Millions | |
| Recent Price: 40.40 Market Intelligence Score: 74 | |
| Day Percent Change: 2.05% Day Change: 0.81 | |
| Week Change: 2.85% Year-to-date Change: -13.7% | |
| RCI Links: Profile News Message Board | |
| Charts:- Daily , Weekly | |
| Add RCI to Watchlist: View: Get Complete RCI Trend Analysis ➞ | |
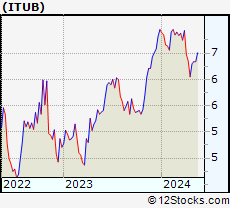 | ITUB Itau Unibanco Holding S.A. |
| Sector: Financials | |
| SubSector: Foreign Regional Banks | |
| MarketCap: 48121 Millions | |
| Recent Price: 5.99 Market Intelligence Score: 0 | |
| Day Percent Change: -1.32% Day Change: -0.08 | |
| Week Change: -2.92% Year-to-date Change: -13.8% | |
| ITUB Links: Profile News Message Board | |
| Charts:- Daily , Weekly | |
| Add ITUB to Watchlist: View: Get Complete ITUB Trend Analysis ➞ | |
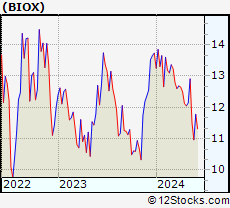 | BIOX Bioceres Crop Solutions Corp. |
| Sector: Industrials | |
| SubSector: Conglomerates | |
| MarketCap: 198.348 Millions | |
| Recent Price: 11.78 Market Intelligence Score: 39 | |
| Day Percent Change: 4.06% Day Change: 0.46 | |
| Week Change: 7.43% Year-to-date Change: -14.2% | |
| BIOX Links: Profile News Message Board | |
| Charts:- Daily , Weekly | |
| Add BIOX to Watchlist: View: Get Complete BIOX Trend Analysis ➞ | |
| To view more stocks, click on Next / Previous arrows or select different range: 0 - 25 , 25 - 50 , 50 - 75 , 75 - 100 , 100 - 125 , 125 - 150 , 150 - 175 , 175 - 200 , 200 - 225 | ||
| Click To Change The Sort Order: By Market Cap or Company Size Performance: Year-to-date, Week and Day | |
| Select Chart Type: | ||
 Best Stocks Today 12Stocks.com |
© 2024 12Stocks.com Terms & Conditions Privacy Contact Us
All Information Provided Only For Education And Not To Be Used For Investing or Trading. See Terms & Conditions


One More Thing ... Get Best Stocks Delivered Daily!
Never Ever Miss A Move With Our Top Ten Stocks Lists
Find Best Stocks In Any Market - Bull or Bear Market
Take A Peek At Our Top Ten Stocks Lists: Daily, Weekly, Year-to-Date & Top Trends
Find Best Stocks In Any Market - Bull or Bear Market
Take A Peek At Our Top Ten Stocks Lists: Daily, Weekly, Year-to-Date & Top Trends
Latin America Stocks With Best Up Trends [0-bearish to 100-bullish]: Gildan Activewear[100], Cameco [100], Methanex [100], Royal Bank[100], TransAlta [100], Tucows [100], Pembina Pipeline[95], Denison Mines[95], City Office[93], MercadoLibre [93], Canada Goose[90]
Best Latin America Stocks Year-to-Date:
Aurora Cannabis[1199.87%], Banco Macro[130.98%], Fusion [124.17%], Grupo Financiero[107.65%], Banco BBVA[107.54%], Endeavour Silver[101.52%], Grupo Supervielle[78.33%], Hudbay Minerals[76.81%], Canopy Growth[66.93%], McEwen Mining[65.19%], Fortuna Silver[61.66%] Best Latin America Stocks This Week:
SunOpta [15.58%], D-Wave Quantum[15.38%], Banco BBVA[14.74%], Banco Macro[13.7%], Tucows [13.61%], Repare [12.62%], IRSA Inversiones[12.15%], Grupo Supervielle[11.73%], New Gold[11.17%], YPF Sociedad[10.47%], Grupo Financiero[10.41%] Best Latin America Stocks Daily:
Gold Royalty[12.41%], SunOpta [7.32%], Vitru [4.66%], Ambipar Emergency[4.41%], Bausch Health[4.29%], Bioceres Crop[4.06%], Repare [3.88%], Cronos [3.60%], Grupo Aeroportuario[3.47%], Lululemon Athletica[3.00%], CI&T [2.96%]