
 Login Sign Up


| |||||
 |  | ||||

| 12Stocks.com Market Intelligence |
Best Latin America Stocks
|
|
| Quick Read: Top Latin America Stocks By Performances & Trends: Daily, Weekly, Year-to-Date, Market Cap (Size) & Technical Trends | |||
| Best Latin America Views: Quick Browse View, Summary & Slide Show | |||
| 12Stocks.com Latin America Stocks Performances & Trends Daily | |||||||||
|
|  The overall market intelligence score is 10 (0-bearish to 100-bullish) which puts Latin America index in short term bearish trend. The market intelligence score from previous trading session is 0 and hence an improvement of trend.
| ||||||||
| Here are the market intelligence trend scores of the most requested Latin America stocks at 12Stocks.com (click stock name for detailed review): | |
| Scroll down this page for most comprehensive review of Latin America stocks by performance, trends, technical analysis, charts, fund plays & more | |


| 12Stocks.com: Top Performing Latin America Index Stocks | ||||||||||||||||||||||||||||||||||||||||||||||||
 The top performing Latin America Index stocks year to date are
Now, more recently, over last week, the top performing Latin America Index stocks on the move are


|
||||||||||||||||||||||||||||||||||||||||||||||||
| 12Stocks.com: Investing in Latin America Index with Stocks | |
|
The following table helps investors and traders sort through current performance and trends (as measured by market intelligence score) of various
stocks in the Latin America Index. Quick View: Move mouse or cursor over stock symbol (ticker) to view short-term technical chart and over stock name to view long term chart. Click on  to add stock symbol to your watchlist and to add stock symbol to your watchlist and  to view watchlist. Click on any ticker or stock name for detailed market intelligence report for that stock. to view watchlist. Click on any ticker or stock name for detailed market intelligence report for that stock. |
12Stocks.com Performance of Stocks in Latin America Index
| Ticker | Stock Name | Watchlist | Category | Recent Price | Market Intelligence Score | Change % | Weekly Change% |
| TD | Toronto-Dominion Bank |   | Financials | 54.30 | 0 | -1.58% | -2.32% |
| GROY | Gold Royalty | | Materials | 1.47 | 10 | 1.03% | -2.33% |
| EGO | Eldorado Gold | | Materials | 14.69 | 26 | -2.20% | -2.33% |
| MGA | Magna | | Services & Goods | 42.74 | 10 | -1.36% | -2.33% |
| BSBR | Banco Santander | | Financials | 5.01 | 10 | 0.80% | -2.34% |
| PSLV | Sprott Physical | | Financials | 9.72 | 46 | -2.21% | -2.36% |
| ONCY | Oncolytics Biotech | | Health Care | 1.02 | 32 | -0.49% | -2.38% |
| EDSA | Edesa Biotech | | Health Care | 4.48 | 51 | -2.40% | -2.39% |
| SNDL | Sundial Growers | | Health Care | 1.99 | 36 | -2.93% | -2.45% |
| STKL | SunOpta | | Consumer Staples | 5.57 | 32 | -1.24% | -2.45% |
| BBD | Banco Bradesco | | Financials | 2.39 | 28 | 0.84% | -2.45% |
| CVE | Cenovus Energy | | Energy | 18.43 | 0 | -3.86% | -2.54% |
| AMX | America Movil | | Technology | 16.84 | 25 | 0.18% | -2.55% |
| SVM | Silvercorp Metals | | Materials | 3.43 | 41 | -3.38% | -2.56% |
| NOA | North American | | Energy | 20.09 | 25 | -4.06% | -2.57% |
| MFC | Manulife Financial | | Financials | 25.18 | 31 | -2.40% | -2.59% |
| LVRO | Lavoro | | Materials | 5.59 | 35 | 1.92% | -2.61% |
| MEOH | Methanex | | Materials | 49.56 | 31 | -2.69% | -2.61% |
| SU | Suncor Energy | | Energy | 36.92 | 13 | -3.00% | -2.82% |
| ACHV | Achieve Life | | Health Care | 5.17 | 36 | -1.05% | -2.91% |
| BLCO | Bausch + | | Health Care | 14.87 | 0 | -0.20% | -2.94% |
| BUR | Burcon Nutrascience | | Health Care | 13.85 | 10 | -0.50% | -2.94% |
| DESP | Despegar.com | | Services & Goods | 14.36 | 56 | -1.03% | -2.97% |
| HBM | Hudbay Minerals | | Materials | 8.81 | 41 | -2.33% | -2.97% |
| WPRT | Westport Fuel | | Consumer Staples | 6.03 | 25 | -0.58% | -2.98% |
| To view more stocks, click on Next / Previous arrows or select different range: 0 - 25 , 25 - 50 , 50 - 75 , 75 - 100 , 100 - 125 , 125 - 150 , 150 - 175 , 175 - 200 , 200 - 225 | ||
 | Click To Change The Sort Order: By Market Cap or Company Size Performance: Year-to-date, Week and Day |  |
| Detailed Overview Of Latin America Stocks |
| Latin America Technical Overview, Leaders & Laggards, Top Latin America ETF Funds & Detailed Latin America Stocks List, Charts, Trends & More |
| Latin America: Technical Analysis, Trends & YTD Performance | |
 ILF Weekly Chart |
|
| Long Term Trend: Not Good | |
| Medium Term Trend: Not Good | |
 ILF Daily Chart |
|
| Short Term Trend: Deteriorating | |
| Overall Trend Score: 10 | |
| YTD Performance: -16.04% | |
| **Trend Scores & Views Are Only For Educational Purposes And Not For Investing | |
| 12Stocks.com: Investing in Latin America Index using Exchange Traded Funds | |
|
The following table shows list of key exchange traded funds (ETF) that
help investors play Latin America stock market. For detailed view, check out our ETF Funds section of our website. Quick View: Move mouse or cursor over ETF symbol (ticker) to view short-term technical chart and over ETF name to view long term chart. Click on ticker or stock name for detailed view. Click on to add stock symbol to your watchlist and to view watchlist. |
12Stocks.com List of ETFs that track Latin America Index
| Ticker | ETF Name | Watchlist | Recent Price | Market Intelligence Score | Change % | Week % | Year-to-date % |
| ILF | Latin America 40 | | 24.40 | 10 | 0.00 | -4.84 | -16.04% |
| EWC | Canada | | 36.60 | 0 | -1.37 | -2.3 | -0.22% |
| FLN | Latin America AlphaDEX | | 18.04 | 17 | 0.06 | -2.12 | -13.23% |
| EWZ | Brazil | | 27.29 | 10 | 0.18 | -5.11 | -21.94% |
| EWW | Mexico | | 55.64 | 10 | 0.23 | -2.81 | -18% |
| ARGT | Argentina | | 58.89 | 66 | 1.99 | 3.1 | 14.71% |
| EWZS | Brazil Small-Cap | | 12.07 | 10 | 0.00 | -4.05 | -19.85% |
| BRF | Brazil Small-Cap | | 13.72 | 10 | -0.94 | -2.42 | -21.99% |
| BZQ | Short Brazil | | 15.06 | 80 | -0.79 | 7.57 | 50.15% |
| BRZU | Brazil Bull 3X | | 63.60 | 10 | 0.71 | -8.01 | -38.18% |
| FBZ | Brazil AlphaDEX | | 10.58 | 10 | -1.03 | -1.56 | -13.43% |
| 12Stocks.com: Charts, Trends, Fundamental Data and Performances of Latin America Stocks | |
|
We now take in-depth look at all Latin America stocks including charts, multi-period performances and overall trends (as measured by market intelligence score). One can sort Latin America stocks (click link to choose) by Daily, Weekly and by Year-to-Date performances. Also, one can sort by size of the company or by market capitalization. |
| Select Your Default Chart Type: | |||||
| |||||
| Click on stock symbol or name for detailed view. Click on to add stock symbol to your watchlist and to view watchlist. Quick View: Move mouse or cursor over "Daily" to quickly view daily technical stock chart and over "Weekly" to view weekly technical stock chart. | |||||

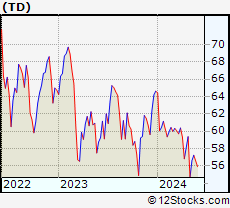 | TD The Toronto-Dominion Bank |
| Sector: Financials | |
| SubSector: Money Center Banks | |
| MarketCap: 75152.4 Millions | |
| Recent Price: 54.30 Market Intelligence Score: 0 | |
| Day Percent Change: -1.58% Day Change: -0.87 | |
| Week Change: -2.32% Year-to-date Change: -16.0% | |
| TD Links: Profile News Message Board | |
| Charts:- Daily , Weekly | |
| Add TD to Watchlist: View: Get Complete TD Trend Analysis ➞ | |
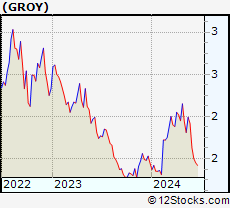 | GROY Gold Royalty Corp. |
| Sector: Materials | |
| SubSector: Other Precious Metals & Mining | |
| MarketCap: 254 Millions | |
| Recent Price: 1.47 Market Intelligence Score: 10 | |
| Day Percent Change: 1.03% Day Change: 0.02 | |
| Week Change: -2.33% Year-to-date Change: 1.4% | |
| GROY Links: Profile News Message Board | |
| Charts:- Daily , Weekly | |
| Add GROY to Watchlist: View: Get Complete GROY Trend Analysis ➞ | |
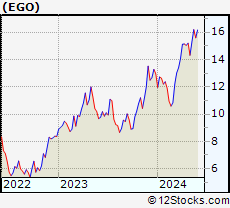 | EGO Eldorado Gold Corporation |
| Sector: Materials | |
| SubSector: Gold | |
| MarketCap: 982.519 Millions | |
| Recent Price: 14.69 Market Intelligence Score: 26 | |
| Day Percent Change: -2.20% Day Change: -0.33 | |
| Week Change: -2.33% Year-to-date Change: 13.3% | |
| EGO Links: Profile News Message Board | |
| Charts:- Daily , Weekly | |
| Add EGO to Watchlist: View: Get Complete EGO Trend Analysis ➞ | |
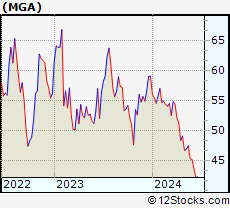 | MGA Magna International Inc. |
| Sector: Services & Goods | |
| SubSector: Auto Parts Wholesale | |
| MarketCap: 8967.3 Millions | |
| Recent Price: 42.74 Market Intelligence Score: 10 | |
| Day Percent Change: -1.36% Day Change: -0.59 | |
| Week Change: -2.33% Year-to-date Change: -27.7% | |
| MGA Links: Profile News Message Board | |
| Charts:- Daily , Weekly | |
| Add MGA to Watchlist: View: Get Complete MGA Trend Analysis ➞ | |
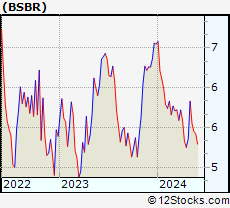 | BSBR Banco Santander (Brasil) S.A. |
| Sector: Financials | |
| SubSector: Foreign Regional Banks | |
| MarketCap: 21961.4 Millions | |
| Recent Price: 5.01 Market Intelligence Score: 10 | |
| Day Percent Change: 0.80% Day Change: 0.04 | |
| Week Change: -2.34% Year-to-date Change: -23.5% | |
| BSBR Links: Profile News Message Board | |
| Charts:- Daily , Weekly | |
| Add BSBR to Watchlist: View: Get Complete BSBR Trend Analysis ➞ | |
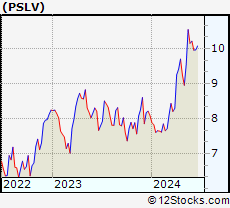 | PSLV Sprott Physical Silver Trust |
| Sector: Financials | |
| SubSector: Exchange Traded Fund | |
| MarketCap: 765.851 Millions | |
| Recent Price: 9.72 Market Intelligence Score: 46 | |
| Day Percent Change: -2.21% Day Change: -0.22 | |
| Week Change: -2.36% Year-to-date Change: 20.3% | |
| PSLV Links: Profile News Message Board | |
| Charts:- Daily , Weekly | |
| Add PSLV to Watchlist: View: Get Complete PSLV Trend Analysis ➞ | |
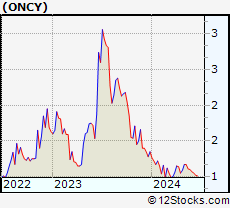 | ONCY Oncolytics Biotech Inc. |
| Sector: Health Care | |
| SubSector: Biotechnology | |
| MarketCap: 57.3785 Millions | |
| Recent Price: 1.02 Market Intelligence Score: 32 | |
| Day Percent Change: -0.49% Day Change: -0.01 | |
| Week Change: -2.38% Year-to-date Change: -24.1% | |
| ONCY Links: Profile News Message Board | |
| Charts:- Daily , Weekly | |
| Add ONCY to Watchlist: View: Get Complete ONCY Trend Analysis ➞ | |
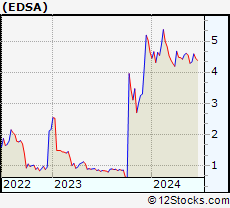 | EDSA Edesa Biotech, Inc. |
| Sector: Health Care | |
| SubSector: Biotechnology | |
| MarketCap: 19.6785 Millions | |
| Recent Price: 4.48 Market Intelligence Score: 51 | |
| Day Percent Change: -2.40% Day Change: -0.11 | |
| Week Change: -2.39% Year-to-date Change: -3.5% | |
| EDSA Links: Profile News Message Board | |
| Charts:- Daily , Weekly | |
| Add EDSA to Watchlist: View: Get Complete EDSA Trend Analysis ➞ | |
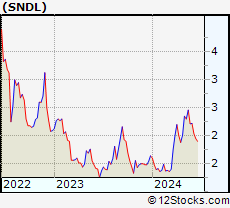 | SNDL Sundial Growers Inc. |
| Sector: Health Care | |
| SubSector: Drug Manufacturers - Other | |
| MarketCap: 94.4033 Millions | |
| Recent Price: 1.99 Market Intelligence Score: 36 | |
| Day Percent Change: -2.93% Day Change: -0.06 | |
| Week Change: -2.45% Year-to-date Change: 21.3% | |
| SNDL Links: Profile News Message Board | |
| Charts:- Daily , Weekly | |
| Add SNDL to Watchlist: View: Get Complete SNDL Trend Analysis ➞ | |
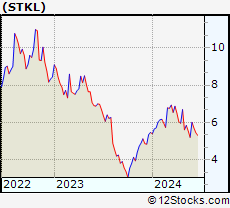 | STKL SunOpta Inc. |
| Sector: Consumer Staples | |
| SubSector: Processed & Packaged Goods | |
| MarketCap: 174.548 Millions | |
| Recent Price: 5.57 Market Intelligence Score: 32 | |
| Day Percent Change: -1.24% Day Change: -0.07 | |
| Week Change: -2.45% Year-to-date Change: 1.8% | |
| STKL Links: Profile News Message Board | |
| Charts:- Daily , Weekly | |
| Add STKL to Watchlist: View: Get Complete STKL Trend Analysis ➞ | |
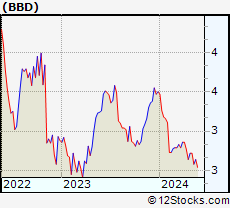 | BBD Banco Bradesco S.A. |
| Sector: Financials | |
| SubSector: Foreign Regional Banks | |
| MarketCap: 30281.7 Millions | |
| Recent Price: 2.39 Market Intelligence Score: 28 | |
| Day Percent Change: 0.84% Day Change: 0.02 | |
| Week Change: -2.45% Year-to-date Change: -31.7% | |
| BBD Links: Profile News Message Board | |
| Charts:- Daily , Weekly | |
| Add BBD to Watchlist: View: Get Complete BBD Trend Analysis ➞ | |
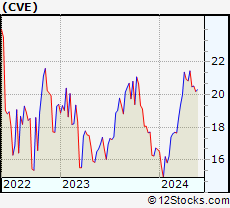 | CVE Cenovus Energy Inc. |
| Sector: Energy | |
| SubSector: Oil & Gas Drilling & Exploration | |
| MarketCap: 2369.29 Millions | |
| Recent Price: 18.43 Market Intelligence Score: 0 | |
| Day Percent Change: -3.86% Day Change: -0.74 | |
| Week Change: -2.54% Year-to-date Change: 10.7% | |
| CVE Links: Profile News Message Board | |
| Charts:- Daily , Weekly | |
| Add CVE to Watchlist: View: Get Complete CVE Trend Analysis ➞ | |
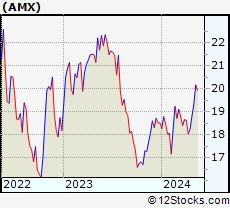 | AMX America Movil, S.A.B. de C.V. |
| Sector: Technology | |
| SubSector: Wireless Communications | |
| MarketCap: 44726.6 Millions | |
| Recent Price: 16.84 Market Intelligence Score: 25 | |
| Day Percent Change: 0.18% Day Change: 0.03 | |
| Week Change: -2.55% Year-to-date Change: -9.1% | |
| AMX Links: Profile News Message Board | |
| Charts:- Daily , Weekly | |
| Add AMX to Watchlist: View: Get Complete AMX Trend Analysis ➞ | |
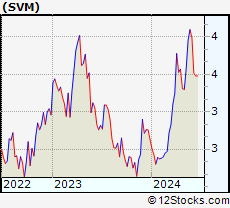 | SVM Silvercorp Metals Inc. |
| Sector: Materials | |
| SubSector: Silver | |
| MarketCap: 504.056 Millions | |
| Recent Price: 3.43 Market Intelligence Score: 41 | |
| Day Percent Change: -3.38% Day Change: -0.12 | |
| Week Change: -2.56% Year-to-date Change: 30.4% | |
| SVM Links: Profile News Message Board | |
| Charts:- Daily , Weekly | |
| Add SVM to Watchlist: View: Get Complete SVM Trend Analysis ➞ | |
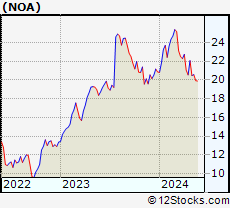 | NOA North American Construction Group Ltd. |
| Sector: Energy | |
| SubSector: Oil & Gas Equipment & Services | |
| MarketCap: 160.461 Millions | |
| Recent Price: 20.09 Market Intelligence Score: 25 | |
| Day Percent Change: -4.06% Day Change: -0.85 | |
| Week Change: -2.57% Year-to-date Change: -3.7% | |
| NOA Links: Profile News Message Board | |
| Charts:- Daily , Weekly | |
| Add NOA to Watchlist: View: Get Complete NOA Trend Analysis ➞ | |
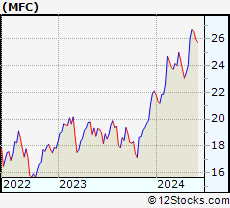 | MFC Manulife Financial Corporation |
| Sector: Financials | |
| SubSector: Life Insurance | |
| MarketCap: 22188.7 Millions | |
| Recent Price: 25.18 Market Intelligence Score: 31 | |
| Day Percent Change: -2.40% Day Change: -0.62 | |
| Week Change: -2.59% Year-to-date Change: 13.9% | |
| MFC Links: Profile News Message Board | |
| Charts:- Daily , Weekly | |
| Add MFC to Watchlist: View: Get Complete MFC Trend Analysis ➞ | |
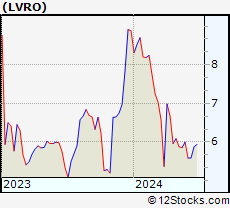 | LVRO Lavoro Limited |
| Sector: Materials | |
| SubSector: Agricultural Inputs | |
| MarketCap: 686 Millions | |
| Recent Price: 5.59 Market Intelligence Score: 35 | |
| Day Percent Change: 1.92% Day Change: 0.11 | |
| Week Change: -2.61% Year-to-date Change: -37.1% | |
| LVRO Links: Profile News Message Board | |
| Charts:- Daily , Weekly | |
| Add LVRO to Watchlist: View: Get Complete LVRO Trend Analysis ➞ | |
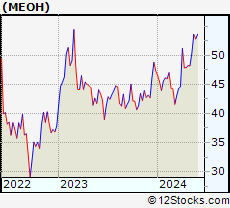 | MEOH Methanex Corporation |
| Sector: Materials | |
| SubSector: Specialty Chemicals | |
| MarketCap: 894.357 Millions | |
| Recent Price: 49.56 Market Intelligence Score: 31 | |
| Day Percent Change: -2.69% Day Change: -1.37 | |
| Week Change: -2.61% Year-to-date Change: 4.7% | |
| MEOH Links: Profile News Message Board | |
| Charts:- Daily , Weekly | |
| Add MEOH to Watchlist: View: Get Complete MEOH Trend Analysis ➞ | |
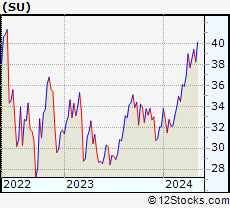 | SU Suncor Energy Inc. |
| Sector: Energy | |
| SubSector: Independent Oil & Gas | |
| MarketCap: 21550.6 Millions | |
| Recent Price: 36.92 Market Intelligence Score: 13 | |
| Day Percent Change: -3.00% Day Change: -1.14 | |
| Week Change: -2.82% Year-to-date Change: 15.2% | |
| SU Links: Profile News Message Board | |
| Charts:- Daily , Weekly | |
| Add SU to Watchlist: View: Get Complete SU Trend Analysis ➞ | |
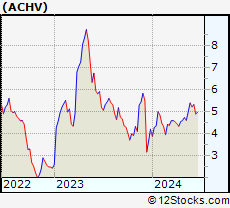 | ACHV Achieve Life Sciences, Inc. |
| Sector: Health Care | |
| SubSector: Biotechnology | |
| MarketCap: 7.32785 Millions | |
| Recent Price: 5.17 Market Intelligence Score: 36 | |
| Day Percent Change: -1.05% Day Change: -0.05 | |
| Week Change: -2.91% Year-to-date Change: 22.7% | |
| ACHV Links: Profile News Message Board | |
| Charts:- Daily , Weekly | |
| Add ACHV to Watchlist: View: Get Complete ACHV Trend Analysis ➞ | |
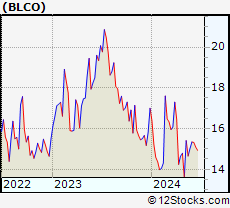 | BLCO Bausch + Lomb Corporation |
| Sector: Health Care | |
| SubSector: Medical Instruments & Supplies | |
| MarketCap: 7100 Millions | |
| Recent Price: 14.87 Market Intelligence Score: 0 | |
| Day Percent Change: -0.20% Day Change: -0.03 | |
| Week Change: -2.94% Year-to-date Change: -12.5% | |
| BLCO Links: Profile News Message Board | |
| Charts:- Daily , Weekly | |
| Add BLCO to Watchlist: View: Get Complete BLCO Trend Analysis ➞ | |
 | BUR Burcon Nutrascience Corporation |
| Sector: Health Care | |
| SubSector: Biotechnology | |
| MarketCap: 0 Millions | |
| Recent Price: 13.85 Market Intelligence Score: 10 | |
| Day Percent Change: -0.50% Day Change: -0.07 | |
| Week Change: -2.94% Year-to-date Change: -11.2% | |
| BUR Links: Profile News Message Board | |
| Charts:- Daily , Weekly | |
| Add BUR to Watchlist: View: Get Complete BUR Trend Analysis ➞ | |
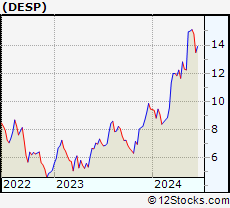 | DESP Despegar.com, Corp. |
| Sector: Services & Goods | |
| SubSector: Lodging | |
| MarketCap: 547.536 Millions | |
| Recent Price: 14.36 Market Intelligence Score: 56 | |
| Day Percent Change: -1.03% Day Change: -0.15 | |
| Week Change: -2.97% Year-to-date Change: 51.8% | |
| DESP Links: Profile News Message Board | |
| Charts:- Daily , Weekly | |
| Add DESP to Watchlist: View: Get Complete DESP Trend Analysis ➞ | |
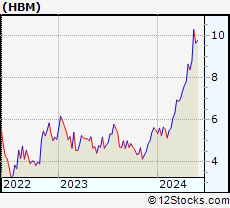 | HBM Hudbay Minerals Inc. |
| Sector: Materials | |
| SubSector: Copper | |
| MarketCap: 363.157 Millions | |
| Recent Price: 8.81 Market Intelligence Score: 41 | |
| Day Percent Change: -2.33% Day Change: -0.21 | |
| Week Change: -2.97% Year-to-date Change: 59.6% | |
| HBM Links: Profile News Message Board | |
| Charts:- Daily , Weekly | |
| Add HBM to Watchlist: View: Get Complete HBM Trend Analysis ➞ | |
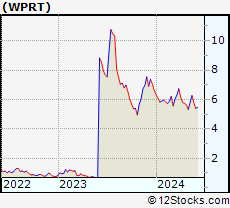 | WPRT Westport Fuel Systems Inc. |
| Sector: Consumer Staples | |
| SubSector: Auto Parts | |
| MarketCap: 108.939 Millions | |
| Recent Price: 6.03 Market Intelligence Score: 25 | |
| Day Percent Change: -0.58% Day Change: -0.03 | |
| Week Change: -2.98% Year-to-date Change: -9.0% | |
| WPRT Links: Profile News Message Board | |
| Charts:- Daily , Weekly | |
| Add WPRT to Watchlist: View: Get Complete WPRT Trend Analysis ➞ | |
| To view more stocks, click on Next / Previous arrows or select different range: 0 - 25 , 25 - 50 , 50 - 75 , 75 - 100 , 100 - 125 , 125 - 150 , 150 - 175 , 175 - 200 , 200 - 225 | ||
| Click To Change The Sort Order: By Market Cap or Company Size Performance: Year-to-date, Week and Day | |
| Select Chart Type: | ||
 Best Stocks Today 12Stocks.com |
© 2024 12Stocks.com Terms & Conditions Privacy Contact Us
All Information Provided Only For Education And Not To Be Used For Investing or Trading. See Terms & Conditions


One More Thing ... Get Best Stocks Delivered Daily!
Never Ever Miss A Move With Our Top Ten Stocks Lists
Find Best Stocks In Any Market - Bull or Bear Market
Take A Peek At Our Top Ten Stocks Lists: Daily, Weekly, Year-to-Date & Top Trends
Find Best Stocks In Any Market - Bull or Bear Market
Take A Peek At Our Top Ten Stocks Lists: Daily, Weekly, Year-to-Date & Top Trends
Latin America Stocks With Best Up Trends [0-bearish to 100-bullish]: Ritchie Bros.[100], Grupo Supervielle[95], Loma Negra[93], Li-Cycle [83], Central Puerto[83], Pampa Energia[83], GFL Environmental[83], Vox Royalty[83], Aurinia [83], Banco BBVA[78], Transportadora de[78]
Best Latin America Stocks Year-to-Date:
Aurora Cannabis[1140.03%], Li-Cycle [475.47%], Banco Macro[119.51%], Grupo Financiero[104.23%], Banco BBVA[96.69%], Endeavour Silver[78.68%], Grupo Supervielle[77.59%], Hudbay Minerals[59.6%], Embraer S.A[59.46%], Despegar.com [51.8%], Canopy Growth[45.99%] Best Latin America Stocks This Week:
Li-Cycle [26.5%], Ivanhoe Electric[18.46%], Grupo Supervielle[16.29%], Transportadora de[11.98%], Grupo Financiero[11.34%], Banco Macro[10.39%], Central Puerto[9.97%], Ritchie Bros.[9.88%], Banco BBVA[9.41%], Vox Royalty[9.32%], Pampa Energia[8.42%] Best Latin America Stocks Daily:
Grupo Supervielle[9.91%], Li-Cycle [9.15%], Banco BBVA[7.32%], Central Puerto[7.02%], Transportadora de[6.81%], Banco Macro[5.56%], IRSA Inversiones[5.25%], Telecom Argentina[5.10%], Pampa Energia[4.20%], Braskem S.A[3.94%], Grupo Financiero[3.89%]