
 Login Sign Up


| |||||
 |  | ||||

| 12Stocks.com Market Intelligence |
Best Latin America Stocks
|
|
| Quick Read: Top Latin America Stocks By Performances & Trends: Daily, Weekly, Year-to-Date, Market Cap (Size) & Technical Trends | |||
| Best Latin America Views: Quick Browse View, Summary & Slide Show | |||
| 12Stocks.com Latin America Stocks Performances & Trends Daily | |||||||||
|
|  The overall market intelligence score is 10 (0-bearish to 100-bullish) which puts Latin America index in short term bearish trend. The market intelligence score from previous trading session is 0 and hence an improvement of trend.
| ||||||||
| Here are the market intelligence trend scores of the most requested Latin America stocks at 12Stocks.com (click stock name for detailed review): | |
| Scroll down this page for most comprehensive review of Latin America stocks by performance, trends, technical analysis, charts, fund plays & more | |


| 12Stocks.com: Top Performing Latin America Index Stocks | ||||||||||||||||||||||||||||||||||||||||||||||||
 The top performing Latin America Index stocks year to date are
Now, more recently, over last week, the top performing Latin America Index stocks on the move are


|
||||||||||||||||||||||||||||||||||||||||||||||||
| 12Stocks.com: Investing in Latin America Index with Stocks | |
|
The following table helps investors and traders sort through current performance and trends (as measured by market intelligence score) of various
stocks in the Latin America Index. Quick View: Move mouse or cursor over stock symbol (ticker) to view short-term technical chart and over stock name to view long term chart. Click on  to add stock symbol to your watchlist and to add stock symbol to your watchlist and  to view watchlist. Click on any ticker or stock name for detailed market intelligence report for that stock. to view watchlist. Click on any ticker or stock name for detailed market intelligence report for that stock. |
12Stocks.com Performance of Stocks in Latin America Index
| Ticker | Stock Name | Watchlist | Category | Recent Price | Market Intelligence Score | Change % | YTD Change% |
| SUPV | Grupo Supervielle |   | Financials | 7.21 | 90 | 9.91 | 77.59% |
| LICY | Li-Cycle | | Industrials | 3.58 | 88 | 9.15 | 475.47% |
| BBAR | Banco BBVA | | Financials | 10.70 | 78 | 7.32 | 96.69% |
| CEPU | Central Puerto | | Utilities | 9.60 | 83 | 7.02 | 5.49% |
| TGS | Transportadora de | | Utilities | 18.98 | 88 | 6.81 | 25.78% |
| EDN | Empresa Distribuidora | | Utilities | 17.57 | 70 | 6.10 | -9.29% |
| BMA | Banco Macro | | Financials | 63.00 | 78 | 5.56 | 119.51% |
| IRS | IRSA Inversiones | | Financials | 10.02 | 58 | 5.25 | 16.51% |
| TEO | Telecom Argentina | | Technology | 7.42 | 32 | 5.10 | 3.78% |
| PAM | Pampa Energia | | Utilities | 47.11 | 83 | 4.20 | -4.87% |
| BAK | Braskem S.A | | Materials | 6.86 | 22 | 3.94 | -22.22% |
| GGAL | Grupo Financiero | | Financials | 35.20 | 78 | 3.71 | 103.88% |
| THTX | Thera | | Health Care | 1.27 | 42 | 3.25 | -21.60% |
| CIO | City Office | | Financials | 4.85 | 42 | 3.19 | -20.62% |
| PAC | Grupo Aeroportuario | | Transports | 165.69 | 51 | 3.12 | -5.44% |
| DNN | Denison Mines | | Materials | 2.14 | 58 | 2.88 | 20.90% |
| LOMA | Loma Negra | | Industrials | 7.17 | 71 | 2.43 | 1.13% |
| YPF | YPF Sociedad | | Energy | 21.17 | 73 | 2.42 | 23.15% |
| CRESY | Cresud Sociedad | | Consumer Staples | 8.49 | 32 | 2.41 | -10.44% |
| MOGO | Mogo | | Financials | 1.56 | 27 | 2.29 | -15.41% |
| SBS | Companhia de | | Utilities | 13.86 | 20 | 2.21 | -9.00% |
| CINT | CI&T | | Technology | 4.76 | 76 | 1.93 | -10.61% |
| VALE | Vale S.A | | Materials | 11.32 | 10 | 1.80 | -28.63% |
| IE | Ivanhoe Electric | | Materials | 10.79 | 54 | 1.79 | 6.46% |
| CIG | Companhia Energetica | | Utilities | 1.85 | 10 | 1.65 | -20.26% |
| To view more stocks, click on Next / Previous arrows or select different range: 0 - 25 , 25 - 50 , 50 - 75 , 75 - 100 , 100 - 125 , 125 - 150 , 150 - 175 , 175 - 200 , 200 - 225 | ||
 | Click To Change The Sort Order: By Market Cap or Company Size Performance: Year-to-date, Week and Day |  |
| Detailed Overview Of Latin America Stocks |
| Latin America Technical Overview, Leaders & Laggards, Top Latin America ETF Funds & Detailed Latin America Stocks List, Charts, Trends & More |
| Latin America: Technical Analysis, Trends & YTD Performance | |
 ILF Weekly Chart |
|
| Long Term Trend: Not Good | |
| Medium Term Trend: Not Good | |
 ILF Daily Chart |
|
| Short Term Trend: Not Good | |
| Overall Trend Score: 10 | |
| YTD Performance: -16.04% | |
| **Trend Scores & Views Are Only For Educational Purposes And Not For Investing | |
| 12Stocks.com: Investing in Latin America Index using Exchange Traded Funds | |
|
The following table shows list of key exchange traded funds (ETF) that
help investors play Latin America stock market. For detailed view, check out our ETF Funds section of our website. Quick View: Move mouse or cursor over ETF symbol (ticker) to view short-term technical chart and over ETF name to view long term chart. Click on ticker or stock name for detailed view. Click on to add stock symbol to your watchlist and to view watchlist. |
12Stocks.com List of ETFs that track Latin America Index
| Ticker | ETF Name | Watchlist | Recent Price | Market Intelligence Score | Change % | Week % | Year-to-date % |
| ILF | Latin America 40 | | 24.40 | 10 | 0.00 | -4.84 | -16.04% |
| EWC | Canada | | 36.60 | 0 | -1.37 | -2.3 | -0.22% |
| FLN | Latin America AlphaDEX | | 18.04 | 17 | 0.06 | -2.12 | -13.23% |
| EWZ | Brazil | | 27.29 | 10 | 0.18 | -5.11 | -21.94% |
| EWW | Mexico | | 55.64 | 10 | 0.23 | -2.81 | -18% |
| ARGT | Argentina | | 58.89 | 66 | 1.99 | 3.1 | 14.71% |
| EWZS | Brazil Small-Cap | | 12.07 | 10 | 0.00 | -4.05 | -19.85% |
| BRF | Brazil Small-Cap | | 13.72 | 10 | -0.94 | -2.42 | -21.99% |
| BZQ | Short Brazil | | 15.04 | 80 | -0.92 | 7.43 | 49.95% |
| BRZU | Brazil Bull 3X | | 63.60 | 10 | 0.71 | -8.01 | -38.18% |
| FBZ | Brazil AlphaDEX | | 10.58 | 10 | -1.03 | -1.56 | -13.43% |
| 12Stocks.com: Charts, Trends, Fundamental Data and Performances of Latin America Stocks | |
|
We now take in-depth look at all Latin America stocks including charts, multi-period performances and overall trends (as measured by market intelligence score). One can sort Latin America stocks (click link to choose) by Daily, Weekly and by Year-to-Date performances. Also, one can sort by size of the company or by market capitalization. |
| Select Your Default Chart Type: | |||||
| |||||
| Click on stock symbol or name for detailed view. Click on to add stock symbol to your watchlist and to view watchlist. Quick View: Move mouse or cursor over "Daily" to quickly view daily technical stock chart and over "Weekly" to view weekly technical stock chart. | |||||

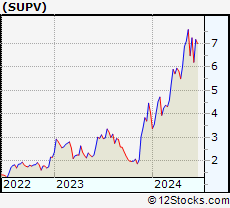 | SUPV Grupo Supervielle S.A. |
| Sector: Financials | |
| SubSector: Foreign Regional Banks | |
| MarketCap: 224.779 Millions | |
| Recent Price: 7.21 Market Intelligence Score: 90 | |
| Day Percent Change: 9.91% Day Change: 0.65 | |
| Week Change: 16.29% Year-to-date Change: 77.6% | |
| SUPV Links: Profile News Message Board | |
| Charts:- Daily , Weekly | |
| Add SUPV to Watchlist: View: Get Complete SUPV Trend Analysis ➞ | |
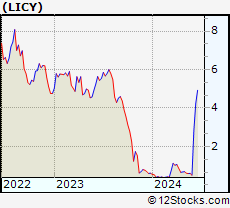 | LICY Li-Cycle Holdings Corp. |
| Sector: Industrials | |
| SubSector: Waste Management | |
| MarketCap: 959 Millions | |
| Recent Price: 3.58 Market Intelligence Score: 88 | |
| Day Percent Change: 9.15% Day Change: 0.30 | |
| Week Change: 26.5% Year-to-date Change: 475.5% | |
| LICY Links: Profile News Message Board | |
| Charts:- Daily , Weekly | |
| Add LICY to Watchlist: View: Get Complete LICY Trend Analysis ➞ | |
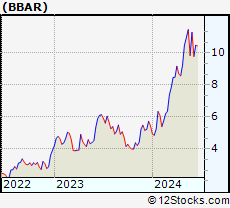 | BBAR Banco BBVA Argentina S.A. |
| Sector: Financials | |
| SubSector: Foreign Regional Banks | |
| MarketCap: 895.479 Millions | |
| Recent Price: 10.70 Market Intelligence Score: 78 | |
| Day Percent Change: 7.32% Day Change: 0.73 | |
| Week Change: 9.41% Year-to-date Change: 96.7% | |
| BBAR Links: Profile News Message Board | |
| Charts:- Daily , Weekly | |
| Add BBAR to Watchlist: View: Get Complete BBAR Trend Analysis ➞ | |
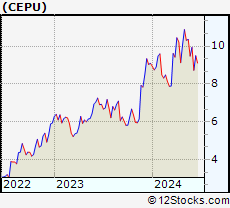 | CEPU Central Puerto S.A. |
| Sector: Utilities | |
| SubSector: Electric Utilities | |
| MarketCap: 340.114 Millions | |
| Recent Price: 9.60 Market Intelligence Score: 83 | |
| Day Percent Change: 7.02% Day Change: 0.63 | |
| Week Change: 9.97% Year-to-date Change: 5.5% | |
| CEPU Links: Profile News Message Board | |
| Charts:- Daily , Weekly | |
| Add CEPU to Watchlist: View: Get Complete CEPU Trend Analysis ➞ | |
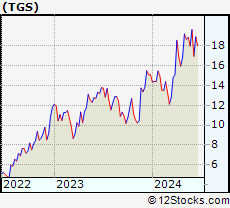 | TGS Transportadora de Gas del Sur S.A. |
| Sector: Utilities | |
| SubSector: Gas Utilities | |
| MarketCap: 514.177 Millions | |
| Recent Price: 18.98 Market Intelligence Score: 88 | |
| Day Percent Change: 6.81% Day Change: 1.21 | |
| Week Change: 11.98% Year-to-date Change: 25.8% | |
| TGS Links: Profile News Message Board | |
| Charts:- Daily , Weekly | |
| Add TGS to Watchlist: View: Get Complete TGS Trend Analysis ➞ | |
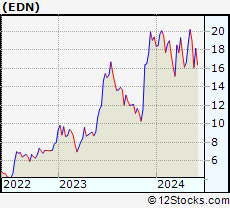 | EDN Empresa Distribuidora y Comercializadora Norte Sociedad Anonima |
| Sector: Utilities | |
| SubSector: Electric Utilities | |
| MarketCap: 105.914 Millions | |
| Recent Price: 17.57 Market Intelligence Score: 70 | |
| Day Percent Change: 6.10% Day Change: 1.01 | |
| Week Change: 7.46% Year-to-date Change: -9.3% | |
| EDN Links: Profile News Message Board | |
| Charts:- Daily , Weekly | |
| Add EDN to Watchlist: View: Get Complete EDN Trend Analysis ➞ | |
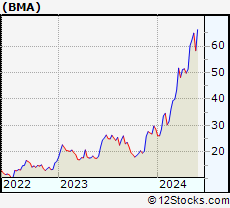 | BMA Banco Macro S.A. |
| Sector: Financials | |
| SubSector: Foreign Regional Banks | |
| MarketCap: 1769.99 Millions | |
| Recent Price: 63.00 Market Intelligence Score: 78 | |
| Day Percent Change: 5.56% Day Change: 3.32 | |
| Week Change: 10.39% Year-to-date Change: 119.5% | |
| BMA Links: Profile News Message Board | |
| Charts:- Daily , Weekly | |
| Add BMA to Watchlist: View: Get Complete BMA Trend Analysis ➞ | |
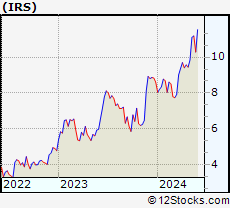 | IRS IRSA Inversiones y Representaciones Sociedad Anonima |
| Sector: Financials | |
| SubSector: Real Estate Development | |
| MarketCap: 257.519 Millions | |
| Recent Price: 10.02 Market Intelligence Score: 58 | |
| Day Percent Change: 5.25% Day Change: 0.50 | |
| Week Change: 6.14% Year-to-date Change: 16.5% | |
| IRS Links: Profile News Message Board | |
| Charts:- Daily , Weekly | |
| Add IRS to Watchlist: View: Get Complete IRS Trend Analysis ➞ | |
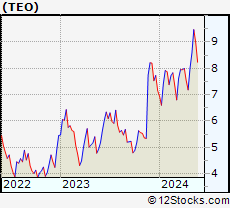 | TEO Telecom Argentina S.A. |
| Sector: Technology | |
| SubSector: Diversified Communication Services | |
| MarketCap: 1508.64 Millions | |
| Recent Price: 7.42 Market Intelligence Score: 32 | |
| Day Percent Change: 5.10% Day Change: 0.36 | |
| Week Change: 3.49% Year-to-date Change: 3.8% | |
| TEO Links: Profile News Message Board | |
| Charts:- Daily , Weekly | |
| Add TEO to Watchlist: View: Get Complete TEO Trend Analysis ➞ | |
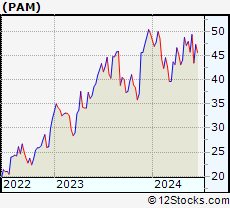 | PAM Pampa Energia S.A. |
| Sector: Utilities | |
| SubSector: Electric Utilities | |
| MarketCap: 1004.14 Millions | |
| Recent Price: 47.11 Market Intelligence Score: 83 | |
| Day Percent Change: 4.20% Day Change: 1.90 | |
| Week Change: 8.42% Year-to-date Change: -4.9% | |
| PAM Links: Profile News Message Board | |
| Charts:- Daily , Weekly | |
| Add PAM to Watchlist: View: Get Complete PAM Trend Analysis ➞ | |
 | BAK Braskem S.A. |
| Sector: Materials | |
| SubSector: Chemicals - Major Diversified | |
| MarketCap: 2715.86 Millions | |
| Recent Price: 6.86 Market Intelligence Score: 22 | |
| Day Percent Change: 3.94% Day Change: 0.26 | |
| Week Change: 3.63% Year-to-date Change: -22.2% | |
| BAK Links: Profile News Message Board | |
| Charts:- Daily , Weekly | |
| Add BAK to Watchlist: View: Get Complete BAK Trend Analysis ➞ | |
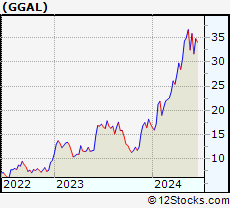 | GGAL Grupo Financiero Galicia S.A. |
| Sector: Financials | |
| SubSector: Foreign Regional Banks | |
| MarketCap: 1274.69 Millions | |
| Recent Price: 35.20 Market Intelligence Score: 78 | |
| Day Percent Change: 3.71% Day Change: 1.26 | |
| Week Change: 11.15% Year-to-date Change: 103.9% | |
| GGAL Links: Profile News Message Board | |
| Charts:- Daily , Weekly | |
| Add GGAL to Watchlist: View: Get Complete GGAL Trend Analysis ➞ | |
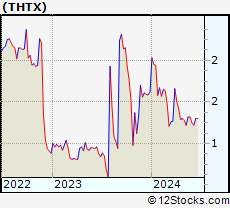 | THTX Theratechnologies Inc. |
| Sector: Health Care | |
| SubSector: Drugs - Generic | |
| MarketCap: 123.185 Millions | |
| Recent Price: 1.27 Market Intelligence Score: 42 | |
| Day Percent Change: 3.25% Day Change: 0.04 | |
| Week Change: 4.1% Year-to-date Change: -21.6% | |
| THTX Links: Profile News Message Board | |
| Charts:- Daily , Weekly | |
| Add THTX to Watchlist: View: Get Complete THTX Trend Analysis ➞ | |
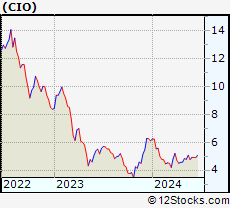 | CIO City Office REIT, Inc. |
| Sector: Financials | |
| SubSector: REIT - Office | |
| MarketCap: 478.566 Millions | |
| Recent Price: 4.85 Market Intelligence Score: 42 | |
| Day Percent Change: 3.19% Day Change: 0.15 | |
| Week Change: -1.22% Year-to-date Change: -20.6% | |
| CIO Links: Profile News Message Board | |
| Charts:- Daily , Weekly | |
| Add CIO to Watchlist: View: Get Complete CIO Trend Analysis ➞ | |
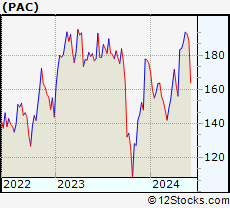 | PAC Grupo Aeroportuario del Pacifico, S.A.B. de C.V. |
| Sector: Transports | |
| SubSector: Air Services, Other | |
| MarketCap: 3204.18 Millions | |
| Recent Price: 165.69 Market Intelligence Score: 51 | |
| Day Percent Change: 3.12% Day Change: 5.02 | |
| Week Change: 2.52% Year-to-date Change: -5.4% | |
| PAC Links: Profile News Message Board | |
| Charts:- Daily , Weekly | |
| Add PAC to Watchlist: View: Get Complete PAC Trend Analysis ➞ | |
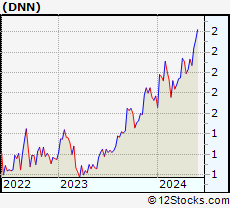 | DNN Denison Mines Corp. |
| Sector: Materials | |
| SubSector: Industrial Metals & Minerals | |
| MarketCap: 154.11 Millions | |
| Recent Price: 2.14 Market Intelligence Score: 58 | |
| Day Percent Change: 2.88% Day Change: 0.06 | |
| Week Change: 1.9% Year-to-date Change: 20.9% | |
| DNN Links: Profile News Message Board | |
| Charts:- Daily , Weekly | |
| Add DNN to Watchlist: View: Get Complete DNN Trend Analysis ➞ | |
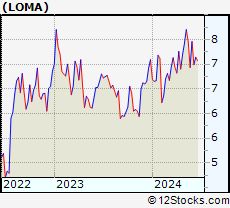 | LOMA Loma Negra Compania Industrial Argentina Sociedad Anonima |
| Sector: Industrials | |
| SubSector: General Building Materials | |
| MarketCap: 408.853 Millions | |
| Recent Price: 7.17 Market Intelligence Score: 71 | |
| Day Percent Change: 2.43% Day Change: 0.17 | |
| Week Change: 2.58% Year-to-date Change: 1.1% | |
| LOMA Links: Profile News Message Board | |
| Charts:- Daily , Weekly | |
| Add LOMA to Watchlist: View: Get Complete LOMA Trend Analysis ➞ | |
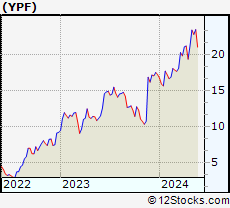 | YPF YPF Sociedad Anonima |
| Sector: Energy | |
| SubSector: Major Integrated Oil & Gas | |
| MarketCap: 2272.35 Millions | |
| Recent Price: 21.17 Market Intelligence Score: 73 | |
| Day Percent Change: 2.42% Day Change: 0.50 | |
| Week Change: 5.74% Year-to-date Change: 23.2% | |
| YPF Links: Profile News Message Board | |
| Charts:- Daily , Weekly | |
| Add YPF to Watchlist: View: Get Complete YPF Trend Analysis ➞ | |
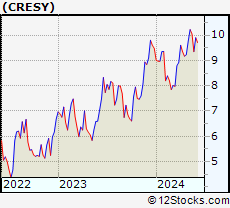 | CRESY Cresud Sociedad Anonima Comercial, Inmobiliaria, Financiera y Agropecuaria |
| Sector: Consumer Staples | |
| SubSector: Farm Products | |
| MarketCap: 224.187 Millions | |
| Recent Price: 8.49 Market Intelligence Score: 32 | |
| Day Percent Change: 2.41% Day Change: 0.20 | |
| Week Change: 1.56% Year-to-date Change: -10.4% | |
| CRESY Links: Profile News Message Board | |
| Charts:- Daily , Weekly | |
| Add CRESY to Watchlist: View: Get Complete CRESY Trend Analysis ➞ | |
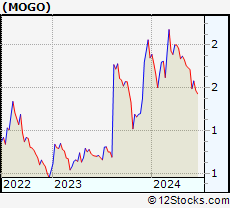 | MOGO Mogo Inc. |
| Sector: Financials | |
| SubSector: Credit Services | |
| MarketCap: 21.9208 Millions | |
| Recent Price: 1.56 Market Intelligence Score: 27 | |
| Day Percent Change: 2.29% Day Change: 0.03 | |
| Week Change: -0.95% Year-to-date Change: -15.4% | |
| MOGO Links: Profile News Message Board | |
| Charts:- Daily , Weekly | |
| Add MOGO to Watchlist: View: Get Complete MOGO Trend Analysis ➞ | |
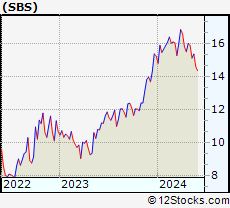 | SBS Companhia de Saneamento Basico do Estado de Sao Paulo - SABESP |
| Sector: Utilities | |
| SubSector: Water Utilities | |
| MarketCap: 5498.72 Millions | |
| Recent Price: 13.86 Market Intelligence Score: 20 | |
| Day Percent Change: 2.21% Day Change: 0.30 | |
| Week Change: -0.14% Year-to-date Change: -9.0% | |
| SBS Links: Profile News Message Board | |
| Charts:- Daily , Weekly | |
| Add SBS to Watchlist: View: Get Complete SBS Trend Analysis ➞ | |
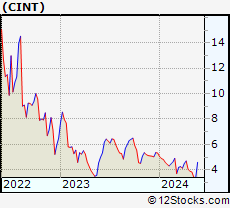 | CINT CI&T Inc |
| Sector: Technology | |
| SubSector: Software - Infrastructure | |
| MarketCap: 806 Millions | |
| Recent Price: 4.76 Market Intelligence Score: 76 | |
| Day Percent Change: 1.93% Day Change: 0.09 | |
| Week Change: -2.06% Year-to-date Change: -10.6% | |
| CINT Links: Profile News Message Board | |
| Charts:- Daily , Weekly | |
| Add CINT to Watchlist: View: Get Complete CINT Trend Analysis ➞ | |
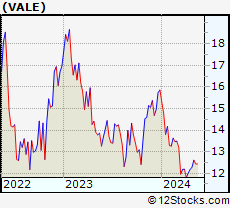 | VALE Vale S.A. |
| Sector: Materials | |
| SubSector: Industrial Metals & Minerals | |
| MarketCap: 43601 Millions | |
| Recent Price: 11.32 Market Intelligence Score: 10 | |
| Day Percent Change: 1.80% Day Change: 0.20 | |
| Week Change: -0.26% Year-to-date Change: -28.6% | |
| VALE Links: Profile News Message Board | |
| Charts:- Daily , Weekly | |
| Add VALE to Watchlist: View: Get Complete VALE Trend Analysis ➞ | |
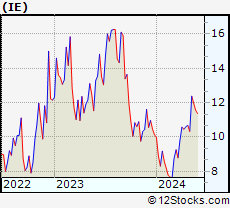 | IE Ivanhoe Electric Inc. |
| Sector: Materials | |
| SubSector: Copper | |
| MarketCap: 1200 Millions | |
| Recent Price: 10.79 Market Intelligence Score: 54 | |
| Day Percent Change: 1.79% Day Change: 0.19 | |
| Week Change: 18.57% Year-to-date Change: 6.5% | |
| IE Links: Profile News Message Board | |
| Charts:- Daily , Weekly | |
| Add IE to Watchlist: View: Get Complete IE Trend Analysis ➞ | |
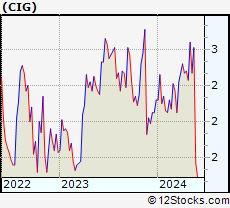 | CIG Companhia Energetica de Minas Gerais |
| Sector: Utilities | |
| SubSector: Electric Utilities | |
| MarketCap: 3203.54 Millions | |
| Recent Price: 1.85 Market Intelligence Score: 10 | |
| Day Percent Change: 1.65% Day Change: 0.03 | |
| Week Change: -1.6% Year-to-date Change: -20.3% | |
| CIG Links: Profile News Message Board | |
| Charts:- Daily , Weekly | |
| Add CIG to Watchlist: View: Get Complete CIG Trend Analysis ➞ | |
| To view more stocks, click on Next / Previous arrows or select different range: 0 - 25 , 25 - 50 , 50 - 75 , 75 - 100 , 100 - 125 , 125 - 150 , 150 - 175 , 175 - 200 , 200 - 225 | ||
| Click To Change The Sort Order: By Market Cap or Company Size Performance: Year-to-date, Week and Day | |
| Select Chart Type: | ||
 Best Stocks Today 12Stocks.com |
© 2024 12Stocks.com Terms & Conditions Privacy Contact Us
All Information Provided Only For Education And Not To Be Used For Investing or Trading. See Terms & Conditions


One More Thing ... Get Best Stocks Delivered Daily!
Never Ever Miss A Move With Our Top Ten Stocks Lists
Find Best Stocks In Any Market - Bull or Bear Market
Take A Peek At Our Top Ten Stocks Lists: Daily, Weekly, Year-to-Date & Top Trends
Find Best Stocks In Any Market - Bull or Bear Market
Take A Peek At Our Top Ten Stocks Lists: Daily, Weekly, Year-to-Date & Top Trends
Latin America Stocks With Best Up Trends [0-bearish to 100-bullish]: Ritchie Bros.[100], Grupo Supervielle[90], Embraer S.A[90], Li-Cycle [88], Transportadora de[88], Central Puerto[83], Pampa Energia[83], GFL Environmental[83], Vox Royalty[83], Banco BBVA[78], Banco Macro[78]
Best Latin America Stocks Year-to-Date:
Aurora Cannabis[1140.03%], Li-Cycle [475.47%], Banco Macro[119.51%], Grupo Financiero[103.88%], Banco BBVA[96.69%], Endeavour Silver[78.68%], Grupo Supervielle[77.59%], Hudbay Minerals[59.6%], Embraer S.A[59.46%], Despegar.com [51.8%], Canopy Growth[45.99%] Best Latin America Stocks This Week:
Li-Cycle [26.5%], Ivanhoe Electric[18.57%], Grupo Supervielle[16.29%], Transportadora de[11.98%], Grupo Financiero[11.15%], Banco Macro[10.39%], Central Puerto[9.97%], Ritchie Bros.[9.88%], Banco BBVA[9.41%], Pampa Energia[8.42%], IRSA Inversiones[6.14%] Best Latin America Stocks Daily:
Grupo Supervielle[9.91%], Li-Cycle [9.15%], Banco BBVA[7.32%], Central Puerto[7.02%], Transportadora de[6.81%], Banco Macro[5.56%], IRSA Inversiones[5.25%], Telecom Argentina[5.10%], Pampa Energia[4.20%], Braskem S.A[3.94%], Grupo Financiero[3.71%]