
 Login Sign Up


| |||||
 |  | ||||

| 12Stocks.com Market Intelligence |
Best Latin America Stocks
|
|
| Quick Read: Top Latin America Stocks By Performances & Trends: Daily, Weekly, Year-to-Date, Market Cap (Size) & Technical Trends | |||
| Best Latin America Views: Quick Browse View, Summary & Slide Show | |||
| 12Stocks.com Latin America Stocks Performances & Trends Daily | |||||||||
|
|  The overall market intelligence score is 10 (0-bearish to 100-bullish) which puts Latin America index in short term bearish trend. The market intelligence score from previous trading session is 17 and hence a deterioration of trend.
| ||||||||
| Here are the market intelligence trend scores of the most requested Latin America stocks at 12Stocks.com (click stock name for detailed review): | |
| Scroll down this page for most comprehensive review of Latin America stocks by performance, trends, technical analysis, charts, fund plays & more | |


| 12Stocks.com: Top Performing Latin America Index Stocks | ||||||||||||||||||||||||||||||||||||||||||||||||
 The top performing Latin America Index stocks year to date are
Now, more recently, over last week, the top performing Latin America Index stocks on the move are


|
||||||||||||||||||||||||||||||||||||||||||||||||
| 12Stocks.com: Investing in Latin America Index with Stocks | |
|
The following table helps investors and traders sort through current performance and trends (as measured by market intelligence score) of various
stocks in the Latin America Index. Quick View: Move mouse or cursor over stock symbol (ticker) to view short-term technical chart and over stock name to view long term chart. Click on  to add stock symbol to your watchlist and to add stock symbol to your watchlist and  to view watchlist. Click on any ticker or stock name for detailed market intelligence report for that stock. to view watchlist. Click on any ticker or stock name for detailed market intelligence report for that stock. |
12Stocks.com Performance of Stocks in Latin America Index
| Ticker | Stock Name | Watchlist | Category | Recent Price | Market Intelligence Score | Change % | YTD Change% |
| GROY | Gold Royalty |   | Materials | 1.63 | 37 | 12.41 | 12.80% |
| STKL | SunOpta | | Consumer Staples | 6.01 | 49 | 7.32 | 9.87% |
| VTRU | Vitru | | Consumer Staples | 9.20 | 25 | 4.66 | -41.85% |
| AMBI | Ambipar Emergency | | Industrials | 3.55 | 44 | 4.41 | -54.84% |
| BHC | Bausch Health | | Health Care | 6.56 | 32 | 4.29 | -18.20% |
| BIOX | Bioceres Crop | | Industrials | 11.78 | 39 | 4.06 | -14.20% |
| VERO | Venus Concept | | Health Care | 0.53 | 20 | 3.92 | -55.08% |
| RPTX | Repare | | Health Care | 3.48 | 42 | 3.88 | -52.33% |
| CRON | Cronos | | Health Care | 2.59 | 41 | 3.60 | 23.92% |
| OMAB | Grupo Aeroportuario | | Transports | 81.81 | 68 | 3.47 | -3.33% |
| LULU | Lululemon Athletica | | Consumer Staples | 311.99 | 42 | 3.00 | -38.98% |
| CINT | CI&T | | Technology | 4.52 | 69 | 2.96 | -15.12% |
| QSR | Restaurant Brands | | Services & Goods | 68.58 | 32 | 2.70 | -12.22% |
| CNI | Canadian National | | Transports | 127.33 | 67 | 2.63 | 1.35% |
| PDS | Precision Drilling | | Energy | 74.56 | 90 | 2.59 | 37.34% |
| GIL | Gildan Activewear | | Consumer Staples | 38.27 | 100 | 2.55 | 15.76% |
| PBA | Pembina Pipeline | | Energy | 37.13 | 95 | 2.46 | 7.87% |
| FSV | FirstService | | Financials | 147.12 | 42 | 2.43 | -9.24% |
| FTS | Fortis | | Utilities | 39.99 | 68 | 2.43 | -2.77% |
| SU | Suncor Energy | | Energy | 40.82 | 76 | 2.38 | 27.40% |
| STN | Stantec | | Services & Goods | 80.68 | 35 | 2.36 | 0.61% |
| RC | Ready Capital | | Financials | 8.30 | 27 | 2.34 | -19.02% |
| CP | Canadian Pacific | | Transports | 79.36 | 32 | 2.31 | 0.38% |
| ENB | Enbridge | | Energy | 36.58 | 68 | 2.29 | 1.55% |
| NTR | Nutrien | | Materials | 58.61 | 78 | 2.27 | 4.05% |
| To view more stocks, click on Next / Previous arrows or select different range: 0 - 25 , 25 - 50 , 50 - 75 , 75 - 100 , 100 - 125 , 125 - 150 , 150 - 175 , 175 - 200 , 200 - 225 | ||
 | Click To Change The Sort Order: By Market Cap or Company Size Performance: Year-to-date, Week and Day |  |
| Detailed Overview Of Latin America Stocks |
| Latin America Technical Overview, Leaders & Laggards, Top Latin America ETF Funds & Detailed Latin America Stocks List, Charts, Trends & More |
| Latin America: Technical Analysis, Trends & YTD Performance | |
 ILF Weekly Chart |
|
| Long Term Trend: Not Good | |
| Medium Term Trend: Not Good | |
 ILF Daily Chart |
|
| Short Term Trend: Not Good | |
| Overall Trend Score: 10 | |
| YTD Performance: -6.88% | |
| **Trend Scores & Views Are Only For Educational Purposes And Not For Investing | |
| 12Stocks.com: Investing in Latin America Index using Exchange Traded Funds | |
|
The following table shows list of key exchange traded funds (ETF) that
help investors play Latin America stock market. For detailed view, check out our ETF Funds section of our website. Quick View: Move mouse or cursor over ETF symbol (ticker) to view short-term technical chart and over ETF name to view long term chart. Click on ticker or stock name for detailed view. Click on to add stock symbol to your watchlist and to view watchlist. |
12Stocks.com List of ETFs that track Latin America Index
| Ticker | ETF Name | Watchlist | Recent Price | Market Intelligence Score | Change % | Week % | Year-to-date % |
| ILF | Latin America 40 | | 27.06 | 10 | -0.44 | -1.56 | -6.88% |
| EWC | Canada | | 38.26 | 76 | 1.49 | 0.08 | 4.31% |
| FLN | Latin America AlphaDEX | | 19.50 | 17 | 0.33 | -1.01 | -6.18% |
| EWZ | Brazil | | 29.60 | 0 | -1.43 | -2.73 | -15.33% |
| EWW | Mexico | | 64.90 | 31 | 0.20 | -1.55 | -4.35% |
| ARGT | Argentina | | 62.28 | 68 | -0.96 | 4.72 | 21.32% |
| EWZS | Brazil Small-Cap | | 12.97 | 0 | -1.18 | -2.85 | -13.88% |
| BRF | Brazil Small-Cap | | 14.69 | 17 | 0.15 | -2.31 | -16.46% |
| BZQ | Short Brazil | | 13.82 | 100 | 4.62 | 6.35 | 37.79% |
| BRZU | Brazil Bull 3X | | 70.46 | 0 | -2.92 | -5.51 | -31.51% |
| FBZ | Brazil AlphaDEX | | 11.24 | 17 | 0.72 | -1.71 | -8.03% |
| 12Stocks.com: Charts, Trends, Fundamental Data and Performances of Latin America Stocks | |
|
We now take in-depth look at all Latin America stocks including charts, multi-period performances and overall trends (as measured by market intelligence score). One can sort Latin America stocks (click link to choose) by Daily, Weekly and by Year-to-Date performances. Also, one can sort by size of the company or by market capitalization. |
| Select Your Default Chart Type: | |||||
| |||||
| Click on stock symbol or name for detailed view. Click on to add stock symbol to your watchlist and to view watchlist. Quick View: Move mouse or cursor over "Daily" to quickly view daily technical stock chart and over "Weekly" to view weekly technical stock chart. | |||||

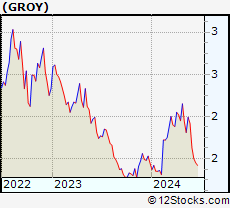 | GROY Gold Royalty Corp. |
| Sector: Materials | |
| SubSector: Other Precious Metals & Mining | |
| MarketCap: 254 Millions | |
| Recent Price: 1.63 Market Intelligence Score: 37 | |
| Day Percent Change: 12.41% Day Change: 0.18 | |
| Week Change: -15.1% Year-to-date Change: 12.8% | |
| GROY Links: Profile News Message Board | |
| Charts:- Daily , Weekly | |
| Add GROY to Watchlist: View: Get Complete GROY Trend Analysis ➞ | |
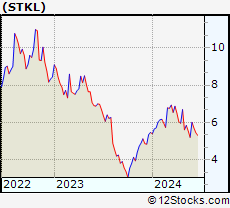 | STKL SunOpta Inc. |
| Sector: Consumer Staples | |
| SubSector: Processed & Packaged Goods | |
| MarketCap: 174.548 Millions | |
| Recent Price: 6.01 Market Intelligence Score: 49 | |
| Day Percent Change: 7.32% Day Change: 0.41 | |
| Week Change: 15.58% Year-to-date Change: 9.9% | |
| STKL Links: Profile News Message Board | |
| Charts:- Daily , Weekly | |
| Add STKL to Watchlist: View: Get Complete STKL Trend Analysis ➞ | |
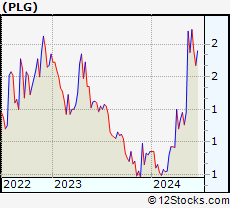 | PLG Platinum Group Metals Ltd. |
| Sector: Materials | |
| SubSector: Industrial Metals & Minerals | |
| MarketCap: 77.591 Millions | |
| Recent Price: 1.89 Market Intelligence Score: 75 | |
| Day Percent Change: 5.59% Day Change: 0.10 | |
| Week Change: 8% Year-to-date Change: 65.8% | |
| PLG Links: Profile News Message Board | |
| Charts:- Daily , Weekly | |
| Add PLG to Watchlist: View: Get Complete PLG Trend Analysis ➞ | |
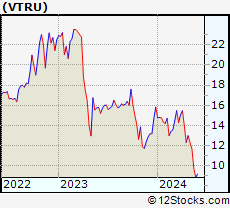 | VTRU Vitru Limited |
| Sector: Consumer Staples | |
| SubSector: Education & Training Services | |
| MarketCap: 33347 Millions | |
| Recent Price: 9.20 Market Intelligence Score: 25 | |
| Day Percent Change: 4.66% Day Change: 0.41 | |
| Week Change: 4.07% Year-to-date Change: -41.9% | |
| VTRU Links: Profile News Message Board | |
| Charts:- Daily , Weekly | |
| Add VTRU to Watchlist: View: Get Complete VTRU Trend Analysis ➞ | |
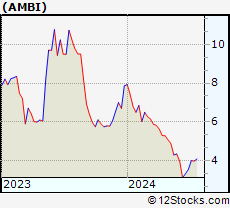 | AMBI Ambipar Emergency Response |
| Sector: Industrials | |
| SubSector: Waste Management | |
| MarketCap: 462 Millions | |
| Recent Price: 3.55 Market Intelligence Score: 44 | |
| Day Percent Change: 4.41% Day Change: 0.15 | |
| Week Change: 6.6% Year-to-date Change: -54.8% | |
| AMBI Links: Profile News Message Board | |
| Charts:- Daily , Weekly | |
| Add AMBI to Watchlist: View: Get Complete AMBI Trend Analysis ➞ | |
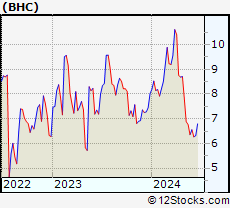 | BHC Bausch Health Companies Inc. |
| Sector: Health Care | |
| SubSector: Drug Delivery | |
| MarketCap: 5485.3 Millions | |
| Recent Price: 6.56 Market Intelligence Score: 32 | |
| Day Percent Change: 4.29% Day Change: 0.27 | |
| Week Change: 3.14% Year-to-date Change: -18.2% | |
| BHC Links: Profile News Message Board | |
| Charts:- Daily , Weekly | |
| Add BHC to Watchlist: View: Get Complete BHC Trend Analysis ➞ | |
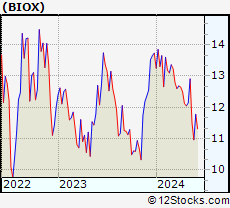 | BIOX Bioceres Crop Solutions Corp. |
| Sector: Industrials | |
| SubSector: Conglomerates | |
| MarketCap: 198.348 Millions | |
| Recent Price: 11.78 Market Intelligence Score: 39 | |
| Day Percent Change: 4.06% Day Change: 0.46 | |
| Week Change: 7.43% Year-to-date Change: -14.2% | |
| BIOX Links: Profile News Message Board | |
| Charts:- Daily , Weekly | |
| Add BIOX to Watchlist: View: Get Complete BIOX Trend Analysis ➞ | |
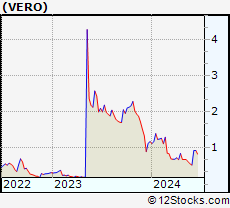 | VERO Venus Concept Inc. |
| Sector: Health Care | |
| SubSector: Medical Appliances & Equipment | |
| MarketCap: 101.08 Millions | |
| Recent Price: 0.53 Market Intelligence Score: 20 | |
| Day Percent Change: 3.92% Day Change: 0.02 | |
| Week Change: -6.18% Year-to-date Change: -55.1% | |
| VERO Links: Profile News Message Board | |
| Charts:- Daily , Weekly | |
| Add VERO to Watchlist: View: Get Complete VERO Trend Analysis ➞ | |
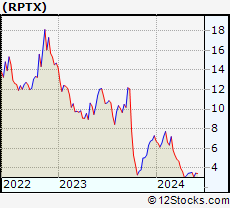 | RPTX Repare Therapeutics Inc. |
| Sector: Health Care | |
| SubSector: Biotechnology | |
| MarketCap: 13687 Millions | |
| Recent Price: 3.48 Market Intelligence Score: 42 | |
| Day Percent Change: 3.88% Day Change: 0.13 | |
| Week Change: 12.62% Year-to-date Change: -52.3% | |
| RPTX Links: Profile News Message Board | |
| Charts:- Daily , Weekly | |
| Add RPTX to Watchlist: View: Get Complete RPTX Trend Analysis ➞ | |
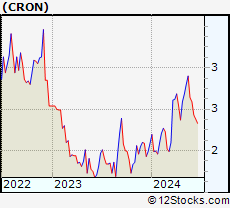 | CRON Cronos Group Inc. |
| Sector: Health Care | |
| SubSector: Biotechnology | |
| MarketCap: 1935.95 Millions | |
| Recent Price: 2.59 Market Intelligence Score: 41 | |
| Day Percent Change: 3.60% Day Change: 0.09 | |
| Week Change: -1.89% Year-to-date Change: 23.9% | |
| CRON Links: Profile News Message Board | |
| Charts:- Daily , Weekly | |
| Add CRON to Watchlist: View: Get Complete CRON Trend Analysis ➞ | |
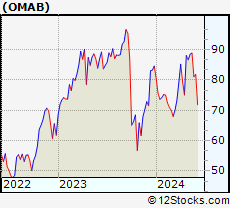 | OMAB Grupo Aeroportuario del Centro Norte, S.A.B. de C.V. |
| Sector: Transports | |
| SubSector: Air Services, Other | |
| MarketCap: 1196.38 Millions | |
| Recent Price: 81.81 Market Intelligence Score: 68 | |
| Day Percent Change: 3.47% Day Change: 2.74 | |
| Week Change: 0.84% Year-to-date Change: -3.3% | |
| OMAB Links: Profile News Message Board | |
| Charts:- Daily , Weekly | |
| Add OMAB to Watchlist: View: Get Complete OMAB Trend Analysis ➞ | |
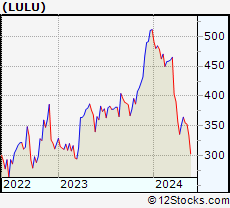 | LULU Lululemon Athletica Inc. |
| Sector: Consumer Staples | |
| SubSector: Textile - Apparel Clothing | |
| MarketCap: 24627.8 Millions | |
| Recent Price: 311.99 Market Intelligence Score: 42 | |
| Day Percent Change: 3.00% Day Change: 9.09 | |
| Week Change: 2.97% Year-to-date Change: -39.0% | |
| LULU Links: Profile News Message Board | |
| Charts:- Daily , Weekly | |
| Add LULU to Watchlist: View: Get Complete LULU Trend Analysis ➞ | |
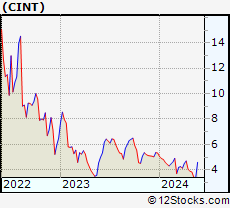 | CINT CI&T Inc |
| Sector: Technology | |
| SubSector: Software - Infrastructure | |
| MarketCap: 806 Millions | |
| Recent Price: 4.52 Market Intelligence Score: 69 | |
| Day Percent Change: 2.96% Day Change: 0.13 | |
| Week Change: -1.74% Year-to-date Change: -15.1% | |
| CINT Links: Profile News Message Board | |
| Charts:- Daily , Weekly | |
| Add CINT to Watchlist: View: Get Complete CINT Trend Analysis ➞ | |
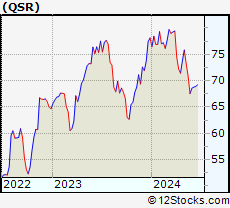 | QSR Restaurant Brands International Inc. |
| Sector: Services & Goods | |
| SubSector: Restaurants | |
| MarketCap: 9551 Millions | |
| Recent Price: 68.58 Market Intelligence Score: 32 | |
| Day Percent Change: 2.70% Day Change: 1.80 | |
| Week Change: 1.55% Year-to-date Change: -12.2% | |
| QSR Links: Profile News Message Board | |
| Charts:- Daily , Weekly | |
| Add QSR to Watchlist: View: Get Complete QSR Trend Analysis ➞ | |
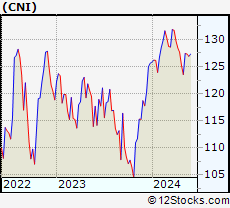 | CNI Canadian National Railway Company |
| Sector: Transports | |
| SubSector: Railroads | |
| MarketCap: 54114.1 Millions | |
| Recent Price: 127.33 Market Intelligence Score: 67 | |
| Day Percent Change: 2.63% Day Change: 3.26 | |
| Week Change: 0.33% Year-to-date Change: 1.4% | |
| CNI Links: Profile News Message Board | |
| Charts:- Daily , Weekly | |
| Add CNI to Watchlist: View: Get Complete CNI Trend Analysis ➞ | |
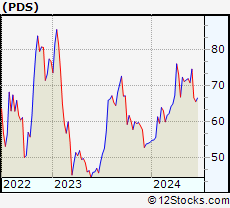 | PDS Precision Drilling Corporation |
| Sector: Energy | |
| SubSector: Oil & Gas Equipment & Services | |
| MarketCap: 103.461 Millions | |
| Recent Price: 74.56 Market Intelligence Score: 90 | |
| Day Percent Change: 2.59% Day Change: 1.88 | |
| Week Change: 5.33% Year-to-date Change: 37.3% | |
| PDS Links: Profile News Message Board | |
| Charts:- Daily , Weekly | |
| Add PDS to Watchlist: View: Get Complete PDS Trend Analysis ➞ | |
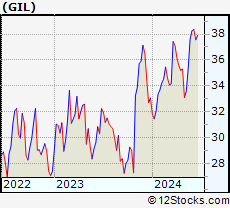 | GIL Gildan Activewear Inc. |
| Sector: Consumer Staples | |
| SubSector: Textile - Apparel Clothing | |
| MarketCap: 2411.65 Millions | |
| Recent Price: 38.27 Market Intelligence Score: 100 | |
| Day Percent Change: 2.55% Day Change: 0.95 | |
| Week Change: 1.73% Year-to-date Change: 15.8% | |
| GIL Links: Profile News Message Board | |
| Charts:- Daily , Weekly | |
| Add GIL to Watchlist: View: Get Complete GIL Trend Analysis ➞ | |
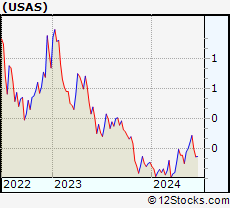 | USAS Americas Silver Corporation |
| Sector: Materials | |
| SubSector: Silver | |
| MarketCap: 67.8456 Millions | |
| Recent Price: 0.34 Market Intelligence Score: 88 | |
| Day Percent Change: 2.54% Day Change: 0.01 | |
| Week Change: 7.34% Year-to-date Change: 35.2% | |
| USAS Links: Profile News Message Board | |
| Charts:- Daily , Weekly | |
| Add USAS to Watchlist: View: Get Complete USAS Trend Analysis ➞ | |
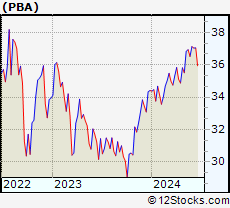 | PBA Pembina Pipeline Corporation |
| Sector: Energy | |
| SubSector: Oil & Gas Pipelines | |
| MarketCap: 8813.35 Millions | |
| Recent Price: 37.13 Market Intelligence Score: 95 | |
| Day Percent Change: 2.46% Day Change: 0.89 | |
| Week Change: 1.67% Year-to-date Change: 7.9% | |
| PBA Links: Profile News Message Board | |
| Charts:- Daily , Weekly | |
| Add PBA to Watchlist: View: Get Complete PBA Trend Analysis ➞ | |
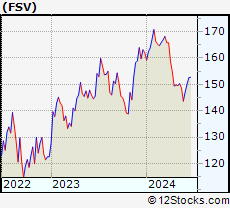 | FSV FirstService Corporation |
| Sector: Financials | |
| SubSector: Property Management | |
| MarketCap: 2793.92 Millions | |
| Recent Price: 147.12 Market Intelligence Score: 42 | |
| Day Percent Change: 2.43% Day Change: 3.49 | |
| Week Change: 2.42% Year-to-date Change: -9.2% | |
| FSV Links: Profile News Message Board | |
| Charts:- Daily , Weekly | |
| Add FSV to Watchlist: View: Get Complete FSV Trend Analysis ➞ | |
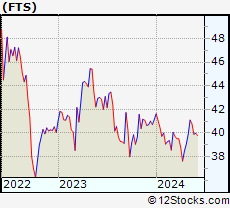 | FTS Fortis Inc. |
| Sector: Utilities | |
| SubSector: Electric Utilities | |
| MarketCap: 14741.8 Millions | |
| Recent Price: 39.99 Market Intelligence Score: 68 | |
| Day Percent Change: 2.43% Day Change: 0.95 | |
| Week Change: 0.23% Year-to-date Change: -2.8% | |
| FTS Links: Profile News Message Board | |
| Charts:- Daily , Weekly | |
| Add FTS to Watchlist: View: Get Complete FTS Trend Analysis ➞ | |
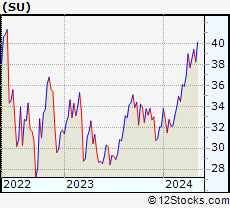 | SU Suncor Energy Inc. |
| Sector: Energy | |
| SubSector: Independent Oil & Gas | |
| MarketCap: 21550.6 Millions | |
| Recent Price: 40.82 Market Intelligence Score: 76 | |
| Day Percent Change: 2.38% Day Change: 0.95 | |
| Week Change: 1.29% Year-to-date Change: 27.4% | |
| SU Links: Profile News Message Board | |
| Charts:- Daily , Weekly | |
| Add SU to Watchlist: View: Get Complete SU Trend Analysis ➞ | |
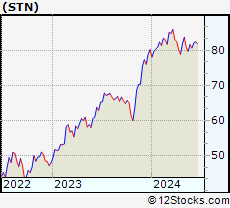 | STN Stantec Inc. |
| Sector: Services & Goods | |
| SubSector: Business Services | |
| MarketCap: 2855.92 Millions | |
| Recent Price: 80.68 Market Intelligence Score: 35 | |
| Day Percent Change: 2.36% Day Change: 1.86 | |
| Week Change: -1.19% Year-to-date Change: 0.6% | |
| STN Links: Profile News Message Board | |
| Charts:- Daily , Weekly | |
| Add STN to Watchlist: View: Get Complete STN Trend Analysis ➞ | |
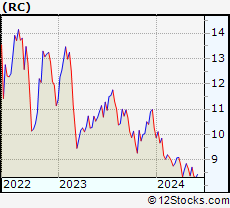 | RC Ready Capital Corporation |
| Sector: Financials | |
| SubSector: Mortgage Investment | |
| MarketCap: 358.039 Millions | |
| Recent Price: 8.30 Market Intelligence Score: 27 | |
| Day Percent Change: 2.34% Day Change: 0.19 | |
| Week Change: -0.6% Year-to-date Change: -19.0% | |
| RC Links: Profile News Message Board | |
| Charts:- Daily , Weekly | |
| Add RC to Watchlist: View: Get Complete RC Trend Analysis ➞ | |
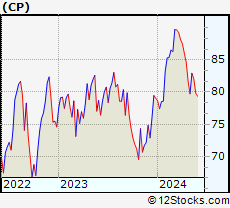 | CP Canadian Pacific Railway Limited |
| Sector: Transports | |
| SubSector: Railroads | |
| MarketCap: 25428.5 Millions | |
| Recent Price: 79.36 Market Intelligence Score: 32 | |
| Day Percent Change: 2.31% Day Change: 1.79 | |
| Week Change: -0.59% Year-to-date Change: 0.4% | |
| CP Links: Profile News Message Board | |
| Charts:- Daily , Weekly | |
| Add CP to Watchlist: View: Get Complete CP Trend Analysis ➞ | |
| To view more stocks, click on Next / Previous arrows or select different range: 0 - 25 , 25 - 50 , 50 - 75 , 75 - 100 , 100 - 125 , 125 - 150 , 150 - 175 , 175 - 200 , 200 - 225 | ||
| Click To Change The Sort Order: By Market Cap or Company Size Performance: Year-to-date, Week and Day | |
| Select Chart Type: | ||
 Best Stocks Today 12Stocks.com |
© 2024 12Stocks.com Terms & Conditions Privacy Contact Us
All Information Provided Only For Education And Not To Be Used For Investing or Trading. See Terms & Conditions


One More Thing ... Get Best Stocks Delivered Daily!
Never Ever Miss A Move With Our Top Ten Stocks Lists
Find Best Stocks In Any Market - Bull or Bear Market
Take A Peek At Our Top Ten Stocks Lists: Daily, Weekly, Year-to-Date & Top Trends
Find Best Stocks In Any Market - Bull or Bear Market
Take A Peek At Our Top Ten Stocks Lists: Daily, Weekly, Year-to-Date & Top Trends
Latin America Stocks With Best Up Trends [0-bearish to 100-bullish]: Gildan Activewear[100], Cameco [100], Methanex [100], Royal Bank[100], TransAlta [100], Tucows [100], Pembina Pipeline[95], Denison Mines[95], City Office[93], MercadoLibre [93], Canada Goose[90]
Best Latin America Stocks Year-to-Date:
Aurora Cannabis[1199.87%], Banco Macro[130.98%], Fusion [124.17%], Grupo Financiero[107.65%], Banco BBVA[107.54%], Endeavour Silver[101.52%], Grupo Supervielle[78.33%], Hudbay Minerals[76.81%], Canopy Growth[66.93%], McEwen Mining[65.19%], Fortuna Silver[61.66%] Best Latin America Stocks This Week:
SunOpta [15.58%], D-Wave Quantum[15.38%], Banco BBVA[14.74%], Banco Macro[13.7%], Tucows [13.61%], Repare [12.62%], IRSA Inversiones[12.15%], Grupo Supervielle[11.73%], New Gold[11.17%], YPF Sociedad[10.47%], Grupo Financiero[10.41%] Best Latin America Stocks Daily:
Gold Royalty[12.41%], SunOpta [7.32%], Vitru [4.66%], Ambipar Emergency[4.41%], Bausch Health[4.29%], Bioceres Crop[4.06%], Repare [3.88%], Cronos [3.60%], Grupo Aeroportuario[3.47%], Lululemon Athletica[3.00%], CI&T [2.96%]