 |
watchlist2 ytdchange none
-
Plain Simple: MAIN Core8 VALLT Core16 Sectors Shorts Dow S&P 100 Ex QQQ S&P 500 Midcap 400 ARKK Smallcap Cloud
Sectors: TechAll TechLarge EnergyAll EnergyLarge FinAll FinLarge RetailAll RetailLarge IndustrialAll IndustrialLarge MaterialsAll MaterialsLarge StaplesAll StaplesLarge UtilitiesAll UtilitiesLarge
Chart Type : BigDaily BigWeekly BigMonthly Daily Weekly Monthly None
150 220 250 300 400 500 680
Order By : Order MarketCap Dchange PChange PChangeDn WeekChange WeekChangeDn YTDChange Score ScoreDn NO Filter
Filters: NO Filter WeeklyorDaily + Weekly + Monthly + Daily + Weekly - Monthly - Daily - Week DMA Day DMA Weekly DMA Minus Day DMAminus
Screens: Full Half Third
| Partial Buys and Sells - start with call & put 2$ then partials and hedges | |||||||
| SPY 10 |  | SDS 100 |  | ||||
here
| SNOW |
| ||||||||||||||||||||||||||||||||||||||||||||||||||||||
| ILF |
| ||||||||||||||||||||||||||||||||||||||||||||||||||||||
| WYNN |
| ||||||||||||||||||||||||||||||||||||||||||||||||||||||
| IBM |
| ||||||||||||||||||||||||||||||||||||||||||||||||||||||
| NVDA |
| ||||||||||||||||||||||||||||||||||||||||||||||||||||||
| UPRO |
| ||||||||||||||||||||||||||||||||||||||||||||||||||||||
| RIVN |
| ||||||||||||||||||||||||||||||||||||||||||||||||||||||
| TNA |
| ||||||||||||||||||||||||||||||||||||||||||||||||||||||
| BMY |
| ||||||||||||||||||||||||||||||||||||||||||||||||||||||
| UNH |
| ||||||||||||||||||||||||||||||||||||||||||||||||||||||
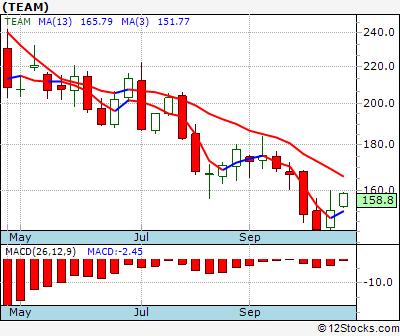
| TEAM |
| ||||||||||||||||||||||||||||||||||||||||||||||||||||||
Totalrec =10
 | Click on following links to sort by: Market Cap or Company Size performance: Year-to-date, Week and Day | Click on following links to filter by: None performance: MoMo, MoMoDay, Dynaboth, Dyna, , Dynawk |  |
0 - 100 ,
Plain Simple: MAIN Core8 VALLT Core16 Sectors Shorts Dow S&P 100 Ex QQQ S&P 500 Midcap 400 ARKK Smallcap Cloud
Daily- : Core8 VALLT Sectors Sectors2 Dow OEFX S&P 500 Nasdaq Midcap Smallcap
Weekly- : Core8 VALLT Sectors Sectors2 Dow OEFX S&P 500 Nasdaq Midcap Smallcap
Monthly- : Core8 VALLT Sectors Sectors2 Dow OEFX S&P 500 Nasdaq Midcap Smallcap
Daily+ : Core8 VALLT Sectors Sectors2 Dow OEFX S&P 500 Nasdaq Midcap Smallcap
Weekly+ : Core8 VALLT Sectors Sectors2 Dow OEFX S&P 500 Nasdaq Midcap Smallcap
Monthly+ : Core8 VALLT Sectors Sectors2 Dow OEFX S&P 500 Nasdaq Midcap Smallcap
Buy puts and calls ($2) 3 weeks ahead
2. Buy puts and calls on stocks IN Motion
3. Both fall on volatility - buy partials
4. But multiple stocks in different sector
5. No panic - buy in partials/no emotional - stocks emotional
6. Follow the Fucking Charts you Asshole
1. Look at blue red line
2. Look MACD - up, down, overbought, oversold, how long the trend has been
3. Lookif broken previous pivots or supports
4. You will be wrong - money management over time, small singles
5. Stick to index - tqqq, sqqq to have small positions . COMPARE UPRO vs SPXU, SPY vs SH - let it decide!!
6. See the latest candles - flat or up or down or consolidating or stuck - don't force inertia!
7. STOP - DONT DIG BIGGER HOLE. Markets will ramp - wait like tiger. Be smart money not dumb. Small positions wait longer