
 Login Sign Up


| |||||
 |  | ||||

| 12Stocks.com Market Intelligence |
Best Utilities Stocks
| In a hurry? Utilities Stocks Lists: Performance Trends Table, Stock Charts
Sort Utilities stocks: Daily, Weekly, Year-to-Date, Market Cap & Trends. Filter Utilities stocks list by size: All Utilities Large Mid-Range Small |
| 12Stocks.com Utilities Stocks Performances & Trends Daily | |||||||||
|
|  The overall Smart Investing & Trading Score is 61 (0-bearish to 100-bullish) which puts Utilities sector in short term neutral to bullish trend. The Smart Investing & Trading Score from previous trading session is 36 and an improvement of trend continues.
| ||||||||
Here are the Smart Investing & Trading Scores of the most requested Utilities stocks at 12Stocks.com (click stock name for detailed review):
|


| Consider signing up for our daily 12Stocks.com "Best Stocks Newsletter". You will never ever miss a big stock move again! |
| 12Stocks.com: Investing in Utilities sector with Stocks | |
|
The following table helps investors and traders sort through current performance and trends (as measured by Smart Investing & Trading Score) of various
stocks in the Utilities sector. Quick View: Move mouse or cursor over stock symbol (ticker) to view short-term Technical chart and over stock name to view long term chart. Click on  to add stock symbol to your watchlist and to add stock symbol to your watchlist and  to view watchlist. Click on any ticker or stock name for detailed market intelligence report for that stock. to view watchlist. Click on any ticker or stock name for detailed market intelligence report for that stock. |
12Stocks.com Performance of Stocks in Utilities Sector
| Ticker | Stock Name | Watchlist | Category | Recent Price | Smart Investing & Trading Score | Change % | YTD Change% |
| PNM | PNM Resources |   | Utilities | 36.01 | 48 | 0.33 | -13.44% |
| FTS | Fortis | | Electric | 37.74 | 25 | 0.28 | -8.23% |
| SBS | Companhia de | | Water | 15.58 | 25 | 0.26 | 2.30% |
| AEP | American Electric | | Electric | 81.44 | 61 | 0.25 | 0.27% |
| XEL | Xcel Energy | | Electric | 53.27 | 40 | 0.15 | -13.96% |
| PCG | PG&E | | Electric | 16.47 | 42 | 0.15 | -8.68% |
| D | Dominion Energy | | Electric | 48.36 | 68 | 0.08 | 2.89% |
| OKE | ONEOK | | Gas Utilities | 77.73 | 61 | 0.06 | 10.69% |
| NEE | NextEra Energy | | Electric | 63.83 | 81 | 0.05 | 5.08% |
| PEG | Public Service | | Utilities | 65.05 | 61 | 0.03 | 6.38% |
| ELP | Companhia Paranaense | | Electric | 7.07 | 17 | 0.00 | -16.63% |
| ELLO | Ellomay Capital | | Electric | 14.92 | 0 | 0.00 | -0.20% |
| MNTK | Montauk Renewables | | Utilities - | 3.50 | 10 | 0.00 | -60.89% |
| RNW | ReNew Energy | | Utilities - Renewable | 5.43 | 25 | 0.00 | -29.30% |
| EXC | Exelon | | Utilities | 36.41 | 61 | -0.01 | 1.43% |
| DTE | DTE Energy | | Electric | 105.26 | 48 | -0.01 | -4.53% |
| CNP | CenterPoint Energy | | Gas Utilities | 27.70 | 42 | -0.02 | -3.06% |
| PPL | PPL | | Electric | 26.41 | 61 | -0.04 | -2.55% |
| BIPC | Brookfield Infrastructure | | Utilities Regulated Gas | 29.65 | 42 | -0.05 | -15.97% |
| UGI | UGI | | Utilities | 23.68 | 61 | -0.06 | -3.72% |
| DUK | Duke Energy | | Electric | 94.41 | 35 | -0.10 | -2.72% |
| SRE | Sempra Energy | | Utilities | 67.85 | 35 | -0.13 | -9.21% |
| EIX | Edison | | Electric | 67.95 | 48 | -0.13 | -4.95% |
| OGE | OGE Energy | | Electric | 32.90 | 35 | -0.14 | -5.83% |
| ES | Eversource Energy | | Utilities | 58.41 | 61 | -0.17 | -5.36% |
| For chart view version of above stock list: Chart View ➞ 0 - 25 , 25 - 50 , 50 - 75 , 75 - 100 | ||
 | Click To Change The Sort Order: By Market Cap or Company Size Performance: Year-to-date, Week and Day |  |
|
Get the most comprehensive stock market coverage daily at 12Stocks.com ➞ Best Stocks Today ➞ Best Stocks Weekly ➞ Best Stocks Year-to-Date ➞ Best Stocks Trends ➞  Best Stocks Today 12Stocks.com Best Nasdaq Stocks ➞ Best S&P 500 Stocks ➞ Best Tech Stocks ➞ Best Biotech Stocks ➞ |
| Detailed Overview of Utilities Stocks |
| Utilities Technical Overview, Leaders & Laggards, Top Utilities ETF Funds & Detailed Utilities Stocks List, Charts, Trends & More |
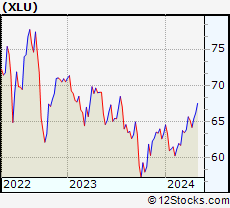
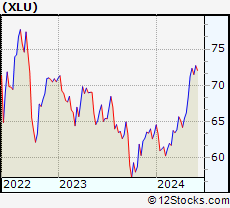
| Utilities Sector: Technical Analysis, Trends & YTD Performance | |
| Utilities sector is composed of stocks
from electric, gas, water, clean
utilities subsectors. Utilities sector, as represented by XLU, an exchange-traded fund [ETF] that holds basket of Utilities stocks (e.g, Duke Energy, Exelon) is up by 1.15% and is currently underperforming the overall market by -3.9% year-to-date. Below is a quick view of Technical charts and trends: |
|
 XLU Weekly Chart |
|
| Long Term Trend: Very Good | |
| Medium Term Trend: Not Good | |
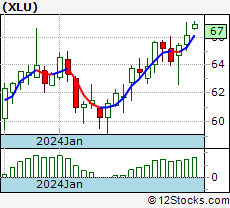
 XLU Daily Chart |
|
| Short Term Trend: Very Good | |
| Overall Trend Score: 61 | |
| YTD Performance: 1.15% | |
| **Trend Scores & Views Are Only For Educational Purposes And Not For Investing | |
| 12Stocks.com: Top Performing Utilities Sector Stocks | ||||||||||||||||||||||||||||||||||||||||||||||||
 The top performing Utilities sector stocks year to date are
Now, more recently, over last week, the top performing Utilities sector stocks on the move are


|
||||||||||||||||||||||||||||||||||||||||||||||||
| 12Stocks.com: Investing in Utilities Sector using Exchange Traded Funds | |
|
The following table shows list of key exchange traded funds (ETF) that
help investors track Utilities Index. For detailed view, check out our ETF Funds section of our website. Quick View: Move mouse or cursor over ETF symbol (ticker) to view short-term Technical chart and over ETF name to view long term chart. Click on ticker or stock name for detailed view. Click on to add stock symbol to your watchlist and to view watchlist. |
12Stocks.com List of ETFs that track Utilities Index
| Ticker | ETF Name | Watchlist | Recent Price | Smart Investing & Trading Score | Change % | Week % | Year-to-date % |
| XLU | Utilities | | 64.06 | 61 | -0.03 | -0.22 | 1.15% |
| JXI | Global Utilities | | 57.44 | 68 | 0.41 | -0.21 | -1.72% |
| IDU | Utilities | | 82.09 | 61 | -0.33 | -0.59 | 2.71% |
| VPU | Utilities | | 138.45 | 61 | -0.28 | -0.55 | 1.01% |
| UPW | Utilities | | 53.25 | 68 | 2.42 | -0.48 | 0.47% |
| SDP | Short Utilities | | 12.14 | 40 | -0.16 | 0.57 | -2.79% |
| FXU | Utilities AlphaDEX | | 31.52 | 61 | 0.51 | -0.1 | -0.51% |
| 12Stocks.com: Charts, Trends, Fundamental Data and Performances of Utilities Stocks | |
|
We now take in-depth look at all Utilities stocks including charts, multi-period performances and overall trends (as measured by Smart Investing & Trading Score). One can sort Utilities stocks (click link to choose) by Daily, Weekly and by Year-to-Date performances. Also, one can sort by size of the company or by market capitalization. |
| Select Your Default Chart Type: | |||||
| |||||
| Click on stock symbol or name for detailed view. Click on to add stock symbol to your watchlist and to view watchlist. Quick View: Move mouse or cursor over "Daily" to quickly view daily Technical stock chart and over "Weekly" to view weekly Technical stock chart. | |||||
 | PNM PNM Resources, Inc. |
| Sector: Utilities | |
| SubSector: Diversified Utilities | |
| MarketCap: 2755.3 Millions | |
| Recent Price: 36.01 Smart Investing & Trading Score: 48 | |
| Day Percent Change: 0.33% Day Change: 0.12 | |
| Week Change: -0.61% Year-to-date Change: -13.4% | |
| PNM Links: Profile News Message Board | |
| Charts:- Daily , Weekly | |
| Add PNM to Watchlist: View: Get Complete PNM Trend Analysis ➞ | |
 | FTS Fortis Inc. |
| Sector: Utilities | |
| SubSector: Electric Utilities | |
| MarketCap: 14741.8 Millions | |
| Recent Price: 37.74 Smart Investing & Trading Score: 25 | |
| Day Percent Change: 0.28% Day Change: 0.10 | |
| Week Change: 0.33% Year-to-date Change: -8.2% | |
| FTS Links: Profile News Message Board | |
| Charts:- Daily , Weekly | |
| Add FTS to Watchlist: View: Get Complete FTS Trend Analysis ➞ | |
 | SBS Companhia de Saneamento Basico do Estado de Sao Paulo - SABESP |
| Sector: Utilities | |
| SubSector: Water Utilities | |
| MarketCap: 5498.72 Millions | |
| Recent Price: 15.58 Smart Investing & Trading Score: 25 | |
| Day Percent Change: 0.26% Day Change: 0.04 | |
| Week Change: -1.33% Year-to-date Change: 2.3% | |
| SBS Links: Profile News Message Board | |
| Charts:- Daily , Weekly | |
| Add SBS to Watchlist: View: Get Complete SBS Trend Analysis ➞ | |
 | AEP American Electric Power Company, Inc. |
| Sector: Utilities | |
| SubSector: Electric Utilities | |
| MarketCap: 38380 Millions | |
| Recent Price: 81.44 Smart Investing & Trading Score: 61 | |
| Day Percent Change: 0.25% Day Change: 0.20 | |
| Week Change: -0.8% Year-to-date Change: 0.3% | |
| AEP Links: Profile News Message Board | |
| Charts:- Daily , Weekly | |
| Add AEP to Watchlist: View: Get Complete AEP Trend Analysis ➞ | |
 | XEL Xcel Energy Inc. |
| Sector: Utilities | |
| SubSector: Electric Utilities | |
| MarketCap: 28960.8 Millions | |
| Recent Price: 53.27 Smart Investing & Trading Score: 40 | |
| Day Percent Change: 0.15% Day Change: 0.08 | |
| Week Change: 0.19% Year-to-date Change: -14.0% | |
| XEL Links: Profile News Message Board | |
| Charts:- Daily , Weekly | |
| Add XEL to Watchlist: View: Get Complete XEL Trend Analysis ➞ | |
 | PCG PG&E Corporation |
| Sector: Utilities | |
| SubSector: Electric Utilities | |
| MarketCap: 5078.04 Millions | |
| Recent Price: 16.47 Smart Investing & Trading Score: 42 | |
| Day Percent Change: 0.15% Day Change: 0.02 | |
| Week Change: -0.81% Year-to-date Change: -8.7% | |
| PCG Links: Profile News Message Board | |
| Charts:- Daily , Weekly | |
| Add PCG to Watchlist: View: Get Complete PCG Trend Analysis ➞ | |
 | D Dominion Energy, Inc. |
| Sector: Utilities | |
| SubSector: Electric Utilities | |
| MarketCap: 62365.3 Millions | |
| Recent Price: 48.36 Smart Investing & Trading Score: 68 | |
| Day Percent Change: 0.08% Day Change: 0.04 | |
| Week Change: -1.12% Year-to-date Change: 2.9% | |
| D Links: Profile News Message Board | |
| Charts:- Daily , Weekly | |
| Add D to Watchlist: View: Get Complete D Trend Analysis ➞ | |
 | OKE ONEOK, Inc. |
| Sector: Utilities | |
| SubSector: Gas Utilities | |
| MarketCap: 10788.7 Millions | |
| Recent Price: 77.73 Smart Investing & Trading Score: 61 | |
| Day Percent Change: 0.06% Day Change: 0.05 | |
| Week Change: -1.23% Year-to-date Change: 10.7% | |
| OKE Links: Profile News Message Board | |
| Charts:- Daily , Weekly | |
| Add OKE to Watchlist: View: Get Complete OKE Trend Analysis ➞ | |
 | NEE NextEra Energy, Inc. |
| Sector: Utilities | |
| SubSector: Electric Utilities | |
| MarketCap: 108288 Millions | |
| Recent Price: 63.83 Smart Investing & Trading Score: 81 | |
| Day Percent Change: 0.05% Day Change: 0.04 | |
| Week Change: 1.18% Year-to-date Change: 5.1% | |
| NEE Links: Profile News Message Board | |
| Charts:- Daily , Weekly | |
| Add NEE to Watchlist: View: Get Complete NEE Trend Analysis ➞ | |
 | PEG Public Service Enterprise Group Incorporated |
| Sector: Utilities | |
| SubSector: Diversified Utilities | |
| MarketCap: 20886 Millions | |
| Recent Price: 65.05 Smart Investing & Trading Score: 61 | |
| Day Percent Change: 0.03% Day Change: 0.02 | |
| Week Change: -1.24% Year-to-date Change: 6.4% | |
| PEG Links: Profile News Message Board | |
| Charts:- Daily , Weekly | |
| Add PEG to Watchlist: View: Get Complete PEG Trend Analysis ➞ | |
 | ELP Companhia Paranaense de Energia - COPEL |
| Sector: Utilities | |
| SubSector: Electric Utilities | |
| MarketCap: 3352.84 Millions | |
| Recent Price: 7.07 Smart Investing & Trading Score: 17 | |
| Day Percent Change: 0.00% Day Change: 0.00 | |
| Week Change: -2.35% Year-to-date Change: -16.6% | |
| ELP Links: Profile News Message Board | |
| Charts:- Daily , Weekly | |
| Add ELP to Watchlist: View: Get Complete ELP Trend Analysis ➞ | |
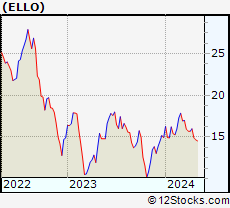 | ELLO Ellomay Capital Ltd. |
| Sector: Utilities | |
| SubSector: Electric Utilities | |
| MarketCap: 116.014 Millions | |
| Recent Price: 14.92 Smart Investing & Trading Score: 0 | |
| Day Percent Change: 0.00% Day Change: 0.00 | |
| Week Change: -6.75% Year-to-date Change: -0.2% | |
| ELLO Links: Profile News Message Board | |
| Charts:- Daily , Weekly | |
| Add ELLO to Watchlist: View: Get Complete ELLO Trend Analysis ➞ | |
 | MNTK Montauk Renewables, Inc. |
| Sector: Utilities | |
| SubSector: Utilities - Diversified | |
| MarketCap: 1020 Millions | |
| Recent Price: 3.50 Smart Investing & Trading Score: 10 | |
| Day Percent Change: 0.00% Day Change: 0.00 | |
| Week Change: -14.22% Year-to-date Change: -60.9% | |
| MNTK Links: Profile News Message Board | |
| Charts:- Daily , Weekly | |
| Add MNTK to Watchlist: View: Get Complete MNTK Trend Analysis ➞ | |
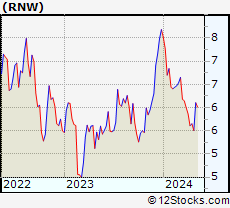 | RNW ReNew Energy Global Plc |
| Sector: Utilities | |
| SubSector: Utilities - Renewable | |
| MarketCap: 1500 Millions | |
| Recent Price: 5.43 Smart Investing & Trading Score: 25 | |
| Day Percent Change: 0.00% Day Change: 0.00 | |
| Week Change: -3.21% Year-to-date Change: -29.3% | |
| RNW Links: Profile News Message Board | |
| Charts:- Daily , Weekly | |
| Add RNW to Watchlist: View: Get Complete RNW Trend Analysis ➞ | |
 | EXC Exelon Corporation |
| Sector: Utilities | |
| SubSector: Diversified Utilities | |
| MarketCap: 34091.9 Millions | |
| Recent Price: 36.41 Smart Investing & Trading Score: 61 | |
| Day Percent Change: -0.01% Day Change: -0.01 | |
| Week Change: -1.05% Year-to-date Change: 1.4% | |
| EXC Links: Profile News Message Board | |
| Charts:- Daily , Weekly | |
| Add EXC to Watchlist: View: Get Complete EXC Trend Analysis ➞ | |
 | DTE DTE Energy Company |
| Sector: Utilities | |
| SubSector: Electric Utilities | |
| MarketCap: 18218.1 Millions | |
| Recent Price: 105.26 Smart Investing & Trading Score: 48 | |
| Day Percent Change: -0.01% Day Change: -0.01 | |
| Week Change: -0.93% Year-to-date Change: -4.5% | |
| DTE Links: Profile News Message Board | |
| Charts:- Daily , Weekly | |
| Add DTE to Watchlist: View: Get Complete DTE Trend Analysis ➞ | |
 | CNP CenterPoint Energy, Inc. |
| Sector: Utilities | |
| SubSector: Gas Utilities | |
| MarketCap: 7444.07 Millions | |
| Recent Price: 27.70 Smart Investing & Trading Score: 42 | |
| Day Percent Change: -0.02% Day Change: 0.00 | |
| Week Change: 0.86% Year-to-date Change: -3.1% | |
| CNP Links: Profile News Message Board | |
| Charts:- Daily , Weekly | |
| Add CNP to Watchlist: View: Get Complete CNP Trend Analysis ➞ | |
 | PPL PPL Corporation |
| Sector: Utilities | |
| SubSector: Electric Utilities | |
| MarketCap: 16588.8 Millions | |
| Recent Price: 26.41 Smart Investing & Trading Score: 61 | |
| Day Percent Change: -0.04% Day Change: -0.01 | |
| Week Change: -0.83% Year-to-date Change: -2.6% | |
| PPL Links: Profile News Message Board | |
| Charts:- Daily , Weekly | |
| Add PPL to Watchlist: View: Get Complete PPL Trend Analysis ➞ | |
 | BIPC Brookfield Infrastructure Corporation |
| Sector: Utilities | |
| SubSector: Utilities Regulated Gas | |
| MarketCap: 31197 Millions | |
| Recent Price: 29.65 Smart Investing & Trading Score: 42 | |
| Day Percent Change: -0.05% Day Change: -0.02 | |
| Week Change: -1.38% Year-to-date Change: -16.0% | |
| BIPC Links: Profile News Message Board | |
| Charts:- Daily , Weekly | |
| Add BIPC to Watchlist: View: Get Complete BIPC Trend Analysis ➞ | |
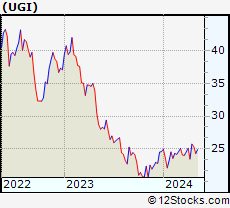 | UGI UGI Corporation |
| Sector: Utilities | |
| SubSector: Diversified Utilities | |
| MarketCap: 5872.8 Millions | |
| Recent Price: 23.68 Smart Investing & Trading Score: 61 | |
| Day Percent Change: -0.06% Day Change: -0.02 | |
| Week Change: 0.96% Year-to-date Change: -3.7% | |
| UGI Links: Profile News Message Board | |
| Charts:- Daily , Weekly | |
| Add UGI to Watchlist: View: Get Complete UGI Trend Analysis ➞ | |
 | DUK Duke Energy Corporation |
| Sector: Utilities | |
| SubSector: Electric Utilities | |
| MarketCap: 56678.2 Millions | |
| Recent Price: 94.41 Smart Investing & Trading Score: 35 | |
| Day Percent Change: -0.10% Day Change: -0.09 | |
| Week Change: -0.52% Year-to-date Change: -2.7% | |
| DUK Links: Profile News Message Board | |
| Charts:- Daily , Weekly | |
| Add DUK to Watchlist: View: Get Complete DUK Trend Analysis ➞ | |
 | SRE Sempra Energy |
| Sector: Utilities | |
| SubSector: Diversified Utilities | |
| MarketCap: 34339.9 Millions | |
| Recent Price: 67.85 Smart Investing & Trading Score: 35 | |
| Day Percent Change: -0.13% Day Change: -0.09 | |
| Week Change: -1.22% Year-to-date Change: -9.2% | |
| SRE Links: Profile News Message Board | |
| Charts:- Daily , Weekly | |
| Add SRE to Watchlist: View: Get Complete SRE Trend Analysis ➞ | |
 | EIX Edison International |
| Sector: Utilities | |
| SubSector: Electric Utilities | |
| MarketCap: 19358.1 Millions | |
| Recent Price: 67.95 Smart Investing & Trading Score: 48 | |
| Day Percent Change: -0.13% Day Change: -0.09 | |
| Week Change: -0.99% Year-to-date Change: -5.0% | |
| EIX Links: Profile News Message Board | |
| Charts:- Daily , Weekly | |
| Add EIX to Watchlist: View: Get Complete EIX Trend Analysis ➞ | |
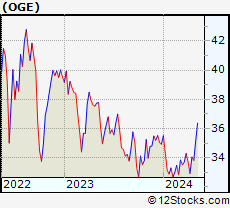 | OGE OGE Energy Corp. |
| Sector: Utilities | |
| SubSector: Electric Utilities | |
| MarketCap: 5454.34 Millions | |
| Recent Price: 32.90 Smart Investing & Trading Score: 35 | |
| Day Percent Change: -0.14% Day Change: -0.04 | |
| Week Change: -0.08% Year-to-date Change: -5.8% | |
| OGE Links: Profile News Message Board | |
| Charts:- Daily , Weekly | |
| Add OGE to Watchlist: View: Get Complete OGE Trend Analysis ➞ | |
 | ES Eversource Energy |
| Sector: Utilities | |
| SubSector: Diversified Utilities | |
| MarketCap: 23963.4 Millions | |
| Recent Price: 58.41 Smart Investing & Trading Score: 61 | |
| Day Percent Change: -0.17% Day Change: -0.10 | |
| Week Change: -0.65% Year-to-date Change: -5.4% | |
| ES Links: Profile News Message Board | |
| Charts:- Daily , Weekly | |
| Add ES to Watchlist: View: Get Complete ES Trend Analysis ➞ | |
| For tabular summary view of above stock list: Summary View ➞ 0 - 25 , 25 - 50 , 50 - 75 , 75 - 100 | ||
| Click To Change The Sort Order: By Market Cap or Company Size Performance: Year-to-date, Week and Day | |
| Select Chart Type: | ||
|
Best Stocks Today 12Stocks.com |
© 2024 12Stocks.com Terms & Conditions Privacy Contact Us
All Information Provided Only For Education And Not To Be Used For Investing or Trading. See Terms & Conditions


One More Thing ... Get Best Stocks Delivered Daily!
Never Ever Miss A Move With Our Top Ten Stocks Lists
Find Best Stocks In Any Market - Bull or Bear Market
Take A Peek At Our Top Ten Stocks Lists: Daily, Weekly, Year-to-Date & Top Trends
Find Best Stocks In Any Market - Bull or Bear Market
Take A Peek At Our Top Ten Stocks Lists: Daily, Weekly, Year-to-Date & Top Trends
Utilities Stocks With Best Up Trends [0-bearish to 100-bullish]: Verde Clean[95], Constellation Energy[83], Avangrid [83], NextEra Energy[81], Transportadora de[73], Southwest Gas[68], Excelerate Energy[68], MGE Energy[68], Dominion Energy[68], NiSource [68], NRG Energy[66]
Best Utilities Stocks Year-to-Date:
Verde Clean[112.02%], Aris Water[61.5%], Constellation Energy[59.78%], NRG Energy[40.48%], Southwest Gas[18.22%], Avangrid [11.72%], ONEOK [10.69%], Suburban Propane[6.59%], Public Service[6.38%], Companhia Energetica[5.17%], NextEra Energy[5.08%] Best Utilities Stocks This Week:
Kenon [7.03%], Verde Clean[6.01%], TransAlta [5.2%], Southwest Gas[2.79%], Artesian Resources[1.7%], Excelerate Energy[1.57%], Portland General[1.5%], Korea Electric[1.37%], Consolidated Edison[1.3%], Avangrid [1.29%], Southern [1.27%] Best Utilities Stocks Daily:
Korea Electric[3.20%], TransAlta [2.49%], Verde Clean[2.49%], Hawaiian Electric[2.41%], Altus Power[2.34%], Enlight Renewable[1.92%], Southwest Gas[1.79%], Kenon [1.78%], Pampa Energia[1.73%], Brookfield Renewable[1.70%], Brookfield Renewable[1.70%]