
![]()
Stocks with best trends & most momentum Starts at $49.99/Mo Subscribe ➞
| Terms & Conditions | Follow @DozenStocks | 12Stocks.com - Best Performing Stocks |
|
 Login Sign Up


| |||||
 |  | ||||
| 12Stocks.com Market Intelligence |
Best United Kingdom Stocks
 | "Discover best U.K stocks with 12Stocks.com" |
| - Subu Vdaygiri, Founder, 12Stocks.com |
|
|
| Quick Read: Top United Kingdom Stocks By Performances & Trends: Daily, Weekly, Year-to-Date, Market Cap (Size) & Technical Trends | |||
| Best United Kingdom Views: Quick Browse View, Summary & Slide Show | |||
| 12Stocks.com United Kingdom Stocks Performances & Trends Daily | |||||||||
|
|  The overall market intelligence score is 53 (0-bearish to 100-bullish) which puts United Kingdom index in short term neutral trend. The market intelligence score from previous trading session is 43 and hence an improvement of trend.
| ||||||||
Here are the market intelligence trend scores of the most requested United Kingdom stocks at 12Stocks.com (click stock name for detailed review):
| ||||||||||||||||||
| Scroll down this page for most comprehensive review of United Kingdom stocks by performance, trends, technical analysis, charts, fund plays & more | ||||||||||||||||||


| 12Stocks.com: Top Performing United Kingdom Index Stocks | ||||||||||||||||||||||||||||||||||||||||||||||||
 The top performing United Kingdom Index stocks year to date are
Now, more recently, over last week, the top performing United Kingdom Index stocks on the move are


|
||||||||||||||||||||||||||||||||||||||||||||||||
| 12Stocks.com: Investing in United Kingdom Index with Stocks | |
|
The following table helps investors and traders sort through current performance and trends (as measured by market intelligence score) of various
stocks in the United Kingdom Index. Quick View: Move mouse or cursor over stock symbol (ticker) to view short-term technical chart and over stock name to view long term chart. Click on  to add stock symbol to your watchlist and to add stock symbol to your watchlist and  to view watchlist. Click on any ticker or stock name for detailed market intelligence report for that stock. to view watchlist. Click on any ticker or stock name for detailed market intelligence report for that stock. |
12Stocks.com Performance of Stocks in United Kingdom Index
| Ticker | Stock Name | Watchlist | Category | Recent Price | Market Intelligence Score | Change % | YTD Change% |
| EVTL | Vertical Aerospace |   | Industrials | 0.75 | 61 | -1.19% | 10.19% |
| ADAP | Adaptimmune | | Health Care | 0.90 | 0 | -8.98% | 13.29% |
| GAMB | Gambling.com | | Services & Goods | 8.59 | 50 | 0.12% | -11.99% |
| KNOP | KNOT Offshore | | Transports | 5.02 | 10 | 0.80% | -12.85% |
| AUTL | Autolus | | Health Care | 4.80 | 10 | -0.83% | -25.47% |
| AFRI | Forafric Global | | Consumer Staples | 10.34 | 43 | -0.10% | -2.36% |
| NVGS | Navigator | | Transports | 14.83 | 0 | -1.79% | 1.92% |
| AEF | Aberdeen Emerging | | Financials | 4.91 | 43 | 0.41% | -3.91% |
| BCYC | Bicycle | | Health Care | 24.51 | 75 | 12.33% | 35.56% |
| SLN | Silence | | Health Care | 21.98 | 52 | 1.88% | 25.21% |
| NCNA | NuCana | | Health Care | 4.05 | 93 | 2.02% | NA |
| ARQQ | Arqit Quantum | | Technology | 0.51 | 61 | 2.22% | 10.94% |
| SMMT | Summit | | Health Care | 3.51 | 7 | -1.68% | 34.48% |
| ACP | Aberdeen ome | | Financials | 6.72 | 42 | 0.75% | -1.18% |
| GSL | Global Ship | | Transports | 21.20 | 42 | -0.14% | 6.96% |
| TLSA | Tiziana Life | | Health Care | 0.62 | 100 | 20.84% | 8.75% |
| VRNA | Verona Pharma | | Health Care | 16.10 | 32 | -1.83% | -18.93% |
| AKTX | Akari | | Health Care | 1.21 | 20 | 7.94% | -61.22% |
| MREO | Mereo BioPharma | | Health Care | 2.66 | 10 | 3.10% | 15.15% |
| VVPR | VivoPower | | Technology | 3.60 | 56 | -8.16% | 88.48% |
| XBIO | Xenetic Biosciences | | Health Care | 4.14 | 58 | 7.25% | 20.00% |
| To view more stocks, click on Next / Previous arrows or select different range: 0 - 25 , 25 - 50 , 50 - 75 | ||
 | Click To Change The Sort Order: By Market Cap or Company Size Performance: Year-to-date, Week and Day |  |
| Detailed Overview Of United Kingdom Stocks |
| United Kingdom Technical Overview, Leaders & Laggards, Top United Kingdom ETF Funds & Detailed United Kingdom Stocks List, Charts, Trends & More |
| United Kingdom: Technical Analysis, Trends & YTD Performance | |
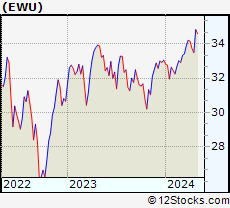
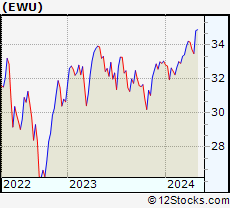
 EWU Weekly Chart |
|
| Long Term Trend: Very Good | |
| Medium Term Trend: Not Good | |
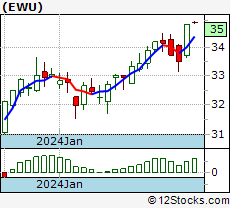
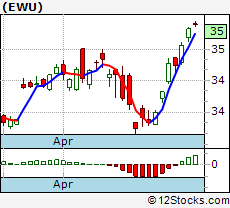 EWU Daily Chart |
|
| Short Term Trend: Not Good | |
| Overall Trend Score: 53 | |
| YTD Performance: 0.85% | |
| **Trend Scores & Views Are Only For Educational Purposes And Not For Investing | |
| 12Stocks.com: Investing in United Kingdom Index using Exchange Traded Funds | |
|
The following table shows list of key exchange traded funds (ETF) that
help investors play United Kingdom stock market. For detailed view, check out our ETF Funds section of our website. Quick View: Move mouse or cursor over ETF symbol (ticker) to view short-term technical chart and over ETF name to view long term chart. Click on ticker or stock name for detailed view. Click on to add stock symbol to your watchlist and to view watchlist. |
12Stocks.com List of ETFs that track United Kingdom Index
| Ticker | ETF Name | Watchlist | Recent Price | Market Intelligence Score | Change % | Week % | Year-to-date % |
| EWU | United Kingdom | | 33.33 | 53 | -0.24 | -1.16 | 0.85% |
| EWUS | United Kingdom Small-Cap | | 33.52 | 35 | -0.24 | -3.24 | -3.44% |
| FKU | United Kingdom AlphaDEX | | 36.10 | 43 | 0.61 | -2.22 | -1.53% |
| FXB | British Pound Ster | | 119.66 | 25 | -0.13 | -0.03 | -2.55% |
| IEV | Europe | | 53.39 | 51 | -0.28 | -0.73 | 1% |
| EURL | Europe Bull 3X | | 22.81 | 36 | -1.04 | -3.35 | -3.8% |
| EPV | Short Europe | | 8.52 | 62 | 0.47 | 1.73 | -0.87% |
| 12Stocks.com: Charts, Trends, Fundamental Data and Performances of United Kingdom Stocks | |
|
We now take in-depth look at all United Kingdom stocks including charts, multi-period performances and overall trends (as measured by market intelligence score). One can sort United Kingdom stocks (click link to choose) by Daily, Weekly and by Year-to-Date performances. Also, one can sort by size of the company or by market capitalization. |
| Select Your Default Chart Type: | |||||
| |||||
| Click on stock symbol or name for detailed view. Click on to add stock symbol to your watchlist and to view watchlist. Quick View: Move mouse or cursor over "Daily" to quickly view daily technical stock chart and over "Weekly" to view weekly technical stock chart. | |||||
 | EVTL Vertical Aerospace Ltd. |
| Sector: Industrials | |
| SubSector: Aerospace & Defense | |
| MarketCap: 403 Millions | |
| Recent Price: 0.75 Market Intelligence Score: 61 | |
| Day Percent Change: -1.19% Day Change: -0.01 | |
| Week Change: -7.94% Year-to-date Change: 10.2% | |
| EVTL Links: Profile News Message Board | |
| Charts:- Daily , Weekly | |
| Add EVTL to Watchlist: View: Get Complete EVTL Trend Analysis ➞ | |
 | ADAP Adaptimmune Therapeutics plc |
| Sector: Health Care | |
| SubSector: Biotechnology | |
| MarketCap: 380.985 Millions | |
| Recent Price: 0.90 Market Intelligence Score: 0 | |
| Day Percent Change: -8.98% Day Change: -0.09 | |
| Week Change: -22.55% Year-to-date Change: 13.3% | |
| ADAP Links: Profile News Message Board | |
| Charts:- Daily , Weekly | |
| Add ADAP to Watchlist: View: Get Complete ADAP Trend Analysis ➞ | |
 | GAMB Gambling.com Group Limited |
| Sector: Services & Goods | |
| SubSector: Gambling | |
| MarketCap: 376 Millions | |
| Recent Price: 8.59 Market Intelligence Score: 50 | |
| Day Percent Change: 0.12% Day Change: 0.01 | |
| Week Change: -5.6% Year-to-date Change: -12.0% | |
| GAMB Links: Profile News Message Board | |
| Charts:- Daily , Weekly | |
| Add GAMB to Watchlist: View: Get Complete GAMB Trend Analysis ➞ | |
 | KNOP KNOT Offshore Partners LP |
| Sector: Transports | |
| SubSector: Shipping | |
| MarketCap: 349.214 Millions | |
| Recent Price: 5.02 Market Intelligence Score: 10 | |
| Day Percent Change: 0.80% Day Change: 0.04 | |
| Week Change: -3.28% Year-to-date Change: -12.9% | |
| KNOP Links: Profile News Message Board | |
| Charts:- Daily , Weekly | |
| Add KNOP to Watchlist: View: Get Complete KNOP Trend Analysis ➞ | |
 | AUTL Autolus Therapeutics plc |
| Sector: Health Care | |
| SubSector: Biotechnology | |
| MarketCap: 296.285 Millions | |
| Recent Price: 4.80 Market Intelligence Score: 10 | |
| Day Percent Change: -0.83% Day Change: -0.04 | |
| Week Change: -4.38% Year-to-date Change: -25.5% | |
| AUTL Links: Profile News Message Board | |
| Charts:- Daily , Weekly | |
| Add AUTL to Watchlist: View: Get Complete AUTL Trend Analysis ➞ | |
 | AFRI Forafric Global PLC |
| Sector: Consumer Staples | |
| SubSector: Farm Products | |
| MarketCap: 295 Millions | |
| Recent Price: 10.34 Market Intelligence Score: 43 | |
| Day Percent Change: -0.10% Day Change: -0.01 | |
| Week Change: 0.49% Year-to-date Change: -2.4% | |
| AFRI Links: Profile News Message Board | |
| Charts:- Daily , Weekly | |
| Add AFRI to Watchlist: View: Get Complete AFRI Trend Analysis ➞ | |
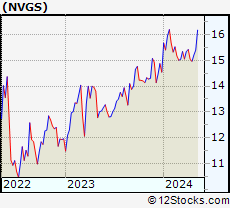 | NVGS Navigator Holdings Ltd. |
| Sector: Transports | |
| SubSector: Shipping | |
| MarketCap: 280.914 Millions | |
| Recent Price: 14.83 Market Intelligence Score: 0 | |
| Day Percent Change: -1.79% Day Change: -0.27 | |
| Week Change: -1.46% Year-to-date Change: 1.9% | |
| NVGS Links: Profile News Message Board | |
| Charts:- Daily , Weekly | |
| Add NVGS to Watchlist: View: Get Complete NVGS Trend Analysis ➞ | |
 | AEF Aberdeen Emerging Markets Equity Income Fund, Inc. |
| Sector: Financials | |
| SubSector: Asset Management | |
| MarketCap: 245.803 Millions | |
| Recent Price: 4.91 Market Intelligence Score: 43 | |
| Day Percent Change: 0.41% Day Change: 0.02 | |
| Week Change: -1.11% Year-to-date Change: -3.9% | |
| AEF Links: Profile News Message Board | |
| Charts:- Daily , Weekly | |
| Add AEF to Watchlist: View: Get Complete AEF Trend Analysis ➞ | |
 | BCYC Bicycle Therapeutics plc |
| Sector: Health Care | |
| SubSector: Biotechnology | |
| MarketCap: 214.485 Millions | |
| Recent Price: 24.51 Market Intelligence Score: 75 | |
| Day Percent Change: 12.33% Day Change: 2.69 | |
| Week Change: 9.91% Year-to-date Change: 35.6% | |
| BCYC Links: Profile News Message Board | |
| Charts:- Daily , Weekly | |
| Add BCYC to Watchlist: View: Get Complete BCYC Trend Analysis ➞ | |
 | SLN Silence Therapeutics plc |
| Sector: Health Care | |
| SubSector: Biotechnology | |
| MarketCap: 198 Millions | |
| Recent Price: 21.98 Market Intelligence Score: 52 | |
| Day Percent Change: 1.88% Day Change: 0.41 | |
| Week Change: -0.86% Year-to-date Change: 25.2% | |
| SLN Links: Profile News Message Board | |
| Charts:- Daily , Weekly | |
| Add SLN to Watchlist: View: Get Complete SLN Trend Analysis ➞ | |
 | NCNA NuCana plc |
| Sector: Health Care | |
| SubSector: Biotechnology | |
| MarketCap: 185.785 Millions | |
| Recent Price: 4.05 Market Intelligence Score: 93 | |
| Day Percent Change: 2.02% Day Change: 0.08 | |
| Week Change: 1708.84% Year-to-date Change: 1,269.2% | |
| NCNA Links: Profile News Message Board | |
| Charts:- Daily , Weekly | |
| Add NCNA to Watchlist: View: Get Complete NCNA Trend Analysis ➞ | |
 | ARQQ Arqit Quantum Inc. |
| Sector: Technology | |
| SubSector: Software - Infrastructure | |
| MarketCap: 165 Millions | |
| Recent Price: 0.51 Market Intelligence Score: 61 | |
| Day Percent Change: 2.22% Day Change: 0.01 | |
| Week Change: 2.07% Year-to-date Change: 10.9% | |
| ARQQ Links: Profile News Message Board | |
| Charts:- Daily , Weekly | |
| Add ARQQ to Watchlist: View: Get Complete ARQQ Trend Analysis ➞ | |
 | SMMT Summit Therapeutics plc |
| Sector: Health Care | |
| SubSector: Biotechnology | |
| MarketCap: 156.985 Millions | |
| Recent Price: 3.51 Market Intelligence Score: 7 | |
| Day Percent Change: -1.68% Day Change: -0.06 | |
| Week Change: -4.23% Year-to-date Change: 34.5% | |
| SMMT Links: Profile News Message Board | |
| Charts:- Daily , Weekly | |
| Add SMMT to Watchlist: View: Get Complete SMMT Trend Analysis ➞ | |
 | ACP Aberdeen Income Credit Strategies Fund |
| Sector: Financials | |
| SubSector: Closed-End Fund - Debt | |
| MarketCap: 119.207 Millions | |
| Recent Price: 6.72 Market Intelligence Score: 42 | |
| Day Percent Change: 0.75% Day Change: 0.05 | |
| Week Change: 1.51% Year-to-date Change: -1.2% | |
| ACP Links: Profile News Message Board | |
| Charts:- Daily , Weekly | |
| Add ACP to Watchlist: View: Get Complete ACP Trend Analysis ➞ | |
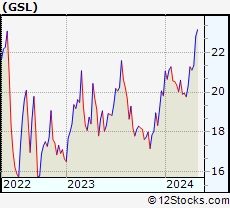 | GSL Global Ship Lease, Inc. |
| Sector: Transports | |
| SubSector: Shipping | |
| MarketCap: 63.3114 Millions | |
| Recent Price: 21.20 Market Intelligence Score: 42 | |
| Day Percent Change: -0.14% Day Change: -0.03 | |
| Week Change: 0.43% Year-to-date Change: 7.0% | |
| GSL Links: Profile News Message Board | |
| Charts:- Daily , Weekly | |
| Add GSL to Watchlist: View: Get Complete GSL Trend Analysis ➞ | |
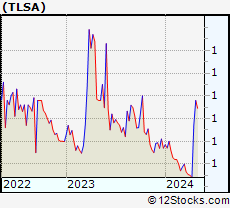 | TLSA Tiziana Life Sciences PLC |
| Sector: Health Care | |
| SubSector: Biotechnology | |
| MarketCap: 48.6785 Millions | |
| Recent Price: 0.62 Market Intelligence Score: 100 | |
| Day Percent Change: 20.84% Day Change: 0.11 | |
| Week Change: 40.89% Year-to-date Change: 8.8% | |
| TLSA Links: Profile News Message Board | |
| Charts:- Daily , Weekly | |
| Add TLSA to Watchlist: View: Get Complete TLSA Trend Analysis ➞ | |
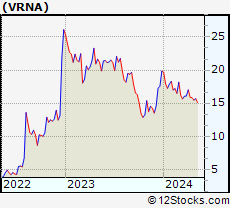 | VRNA Verona Pharma plc |
| Sector: Health Care | |
| SubSector: Biotechnology | |
| MarketCap: 44.2785 Millions | |
| Recent Price: 16.10 Market Intelligence Score: 32 | |
| Day Percent Change: -1.83% Day Change: -0.30 | |
| Week Change: 1.19% Year-to-date Change: -18.9% | |
| VRNA Links: Profile News Message Board | |
| Charts:- Daily , Weekly | |
| Add VRNA to Watchlist: View: Get Complete VRNA Trend Analysis ➞ | |
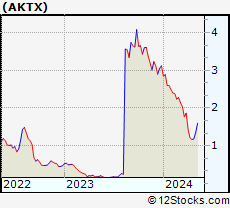 | AKTX Akari Therapeutics, Plc |
| Sector: Health Care | |
| SubSector: Biotechnology | |
| MarketCap: 38.8785 Millions | |
| Recent Price: 1.21 Market Intelligence Score: 20 | |
| Day Percent Change: 7.94% Day Change: 0.09 | |
| Week Change: 0% Year-to-date Change: -61.2% | |
| AKTX Links: Profile News Message Board | |
| Charts:- Daily , Weekly | |
| Add AKTX to Watchlist: View: Get Complete AKTX Trend Analysis ➞ | |
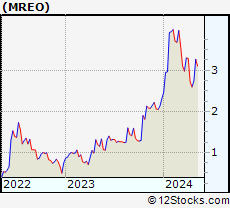 | MREO Mereo BioPharma Group plc |
| Sector: Health Care | |
| SubSector: Biotechnology | |
| MarketCap: 22.4785 Millions | |
| Recent Price: 2.66 Market Intelligence Score: 10 | |
| Day Percent Change: 3.10% Day Change: 0.08 | |
| Week Change: -2.21% Year-to-date Change: 15.2% | |
| MREO Links: Profile News Message Board | |
| Charts:- Daily , Weekly | |
| Add MREO to Watchlist: View: Get Complete MREO Trend Analysis ➞ | |
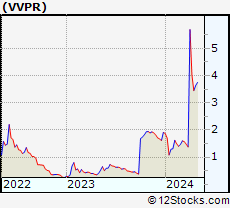 | VVPR VivoPower International PLC |
| Sector: Technology | |
| SubSector: Semiconductor - Specialized | |
| MarketCap: 9.6066 Millions | |
| Recent Price: 3.60 Market Intelligence Score: 56 | |
| Day Percent Change: -8.16% Day Change: -0.32 | |
| Week Change: -10.45% Year-to-date Change: 88.5% | |
| VVPR Links: Profile News Message Board | |
| Charts:- Daily , Weekly | |
| Add VVPR to Watchlist: View: Get Complete VVPR Trend Analysis ➞ | |
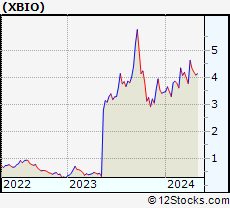 | XBIO Xenetic Biosciences, Inc. |
| Sector: Health Care | |
| SubSector: Biotechnology | |
| MarketCap: 3.42785 Millions | |
| Recent Price: 4.14 Market Intelligence Score: 58 | |
| Day Percent Change: 7.25% Day Change: 0.28 | |
| Week Change: -4.39% Year-to-date Change: 20.0% | |
| XBIO Links: Profile News Message Board | |
| Charts:- Daily , Weekly | |
| Add XBIO to Watchlist: View: Get Complete XBIO Trend Analysis ➞ | |
| To view more stocks, click on Next / Previous arrows or select different range: 0 - 25 , 25 - 50 , 50 - 75 | ||
| Click To Change The Sort Order: By Market Cap or Company Size Performance: Year-to-date, Week and Day | |
| Select Chart Type: | ||
 Best Stocks Today 12Stocks.com |
© 2024 12Stocks.com Terms & Conditions Privacy Contact Us
All Information Provided Only For Education And Not To Be Used For Investing or Trading. See Terms & Conditions


One More Thing ... Get Best Stocks Delivered Daily!
Never Ever Miss A Move With Our Top Ten Stocks Lists
Find Best Stocks In Any Market - Bull or Bear Market
Take A Peek At Our Top Ten Stocks Lists: Daily, Weekly, Year-to-Date & Top Trends
Find Best Stocks In Any Market - Bull or Bear Market
Take A Peek At Our Top Ten Stocks Lists: Daily, Weekly, Year-to-Date & Top Trends
United Kingdom Stocks With Best Up Trends [0-bearish to 100-bullish]: NuCana [93], HSBC [81], WPP [80], Bicycle [75], AstraZeneca [71], Lloyds Banking[68], Arqit Quantum[61], Barclays [61], Vertical Aerospace[61], Aon [58], Nomad Foods[56]
Best United Kingdom Stocks Year-to-Date:
NuCana [1269.17%], Renalytix AI[107.42%], Bicycle [35.56%], Summit [34.48%], Centessa [33.54%], Silence [25.21%], nVent Electric[21.07%], Barclays [17.26%], Metals Acquisition[16.85%], Paysafe [14.69%], Adaptimmune [13.29%] Best United Kingdom Stocks This Week:
NuCana [1708.84%], Bicycle [9.91%], Prudential [3.03%], Diageo [2.77%], Arqit Quantum[2.07%], Lloyds Banking[1.62%], Haleon [1.31%], WPP [1.31%], Manchester United[1.16%], Rio Tinto[1.05%], Smith & Nephew[1.01%] Best United Kingdom Stocks Daily:
Bicycle [12.33%], Exscientia [3.82%], VTEX [3.30%], Atlantica Yield[3.28%], IHS Holding[2.73%], Liberty Global[2.32%], Prudential [2.32%], Liberty Global[2.22%], Arqit Quantum[2.22%], NuCana [2.02%], Paysafe [1.89%]