
 Login Sign Up


| |||||
 |  | ||||

| 12Stocks.com Market Intelligence |
Best Tech Stocks
| In a hurry? Tech Stocks Lists: Performance & Trends, Stock Charts, FANG Stocks
Sort Tech stocks: Daily, Weekly, Year-to-Date, Market Cap & Trends. Filter Tech stocks list by size:All Tech Large Mid-Range Small and MicroCap |
| 12Stocks.com Tech Stocks Performances & Trends Daily | |||||||||
|
|  The overall Smart Investing & Trading Score is 100 (0-bearish to 100-bullish) which puts Technology sector in short term bullish trend. The Smart Investing & Trading Score from previous trading session is 60 and hence an improvement of trend.
| ||||||||
Here are the Smart Investing & Trading Scores of the most requested Technology stocks at 12Stocks.com (click stock name for detailed review):
|


| 12Stocks.com: Investing in Technology sector with Stocks | |
|
The following table helps investors and traders sort through current performance and trends (as measured by Smart Investing & Trading Score) of various
stocks in the Tech sector. Quick View: Move mouse or cursor over stock symbol (ticker) to view short-term technical chart and over stock name to view long term chart. Click on  to add stock symbol to your watchlist and to add stock symbol to your watchlist and  to view watchlist. Click on any ticker or stock name for detailed market intelligence report for that stock. to view watchlist. Click on any ticker or stock name for detailed market intelligence report for that stock. |
12Stocks.com Performance of Stocks in Tech Sector
| Ticker | Stock Name | Watchlist | Category | Recent Price | Smart Investing & Trading Score | Change % | YTD Change% |
| UBNT | Ubiquiti Networks |   | Wireless | 358.84 | 60 | -2.51 | 0.00% |
| RVLT | Revolution Lighting | | Electronics | 2.72 | 10 | -2.51 | 0.00% |
| SYMC | Symantec | | Security Software | 170.75 | 20 | -2.52 | 0.00% |
| PDVW | pdvWireless | | Software | 43.56 | 20 | -2.55 | 0.00% |
| BMI | Badger Meter | | Instruments | 172.67 | 10 | -2.58 | -18.18% |
| SMWB | Similarweb | | Software - | 9.74 | 40 | -2.60 | -30.38% |
| ASGN | ASGN | | IT | 49.51 | 10 | -2.62 | -40.25% |
| IIJI | Internet Initiative | | Communication | 31.11 | 70 | -2.63 | 0.00% |
| CLS | Celestica | | Electronic Components | 247.66 | 70 | -2.65 | 166.10% |
| JKS | JinkoSolar Holding | | Solar | 25.34 | 60 | -2.76 | 3.67% |
| SONO | Sonos | | Consumer Electronics | 15.09 | 50 | -2.80 | 2.37% |
| BELFB | Bel Fuse | | Electronic Components | 144.60 | 60 | -2.81 | 78.91% |
| APPS | Digital Turbine | | Software - | 5.19 | 70 | -2.81 | 194.89% |
| AUR | Aurora Innovation | | IT | 5.89 | 80 | -2.81 | -3.44% |
| NCMI | National Cinemedia | | Advertising Agencies | 4.75 | 30 | -2.86 | -27.33% |
| ZH | Zhihu | | Internet Content & Information | 5.24 | 70 | -2.96 | 48.02% |
| NTES | NetEase | | Electronic Gaming & Multimedia | 154.61 | 60 | -2.97 | 79.26% |
| DOYU | DouYu | | Internet Content & Information | 7.79 | 60 | -2.99 | -30.26% |
| TV | Grupo Televisa | | Telecom | 2.83 | 70 | -3.08 | 69.45% |
| DDI | DoubleDown Interactive | | Electronic Gaming & Multimedia | 9.40 | 20 | -3.09 | -8.11% |
| GCT | GigaCloud | | Software - Infrastructure | 29.71 | 50 | -3.10 | 55.88% |
| VSAT | Viasat | | Communication | 31.35 | 70 | -3.12 | 225.88% |
| GILT | Gilat Satellite | | Communication | 11.14 | 90 | -3.13 | 81.14% |
| JMU | JMU | | Internet | 11.62 | 0 | -3.17 | 0.00% |
| LPL | LG Display | | Consumer Electronics | 4.80 | 100 | -3.23 | 54.84% |
| For chart view version of above stock list: Chart View ➞ 0 - 25 , 25 - 50 , 50 - 75 , 75 - 100 , 100 - 125 , 125 - 150 , 150 - 175 , 175 - 200 , 200 - 225 , 225 - 250 , 250 - 275 , 275 - 300 , 300 - 325 , 325 - 350 , 350 - 375 , 375 - 400 , 400 - 425 , 425 - 450 , 450 - 475 , 475 - 500 , 500 - 525 , 525 - 550 , 550 - 575 , 575 - 600 , 600 - 625 , 625 - 650 , 650 - 675 , 675 - 700 , 700 - 725 , 725 - 750 , 750 - 775 , 775 - 800 , 800 - 825 , 825 - 850 , 850 - 875 , 875 - 900 | ||
 | Click To Change The Sort Order: By Market Cap or Company Size Performance: Year-to-date, Week and Day |  |
|
Get the most comprehensive stock market coverage daily at 12Stocks.com ➞ Best Stocks Today ➞ Best Stocks Weekly ➞ Best Stocks Year-to-Date ➞ Best Stocks Trends ➞  Best Stocks Today 12Stocks.com Best Nasdaq Stocks ➞ Best S&P 500 Stocks ➞ Best Tech Stocks ➞ Best Biotech Stocks ➞ |
| Detailed Overview of Tech Stocks |
| Tech Technical Overview, Leaders & Laggards, Top Tech ETF Funds & Detailed Tech Stocks List, Charts, Trends & More |
| Tech Sector: Technical Analysis, Trends & YTD Performance | |
| Technology sector is composed of stocks
from semiconductors, software, web, social media
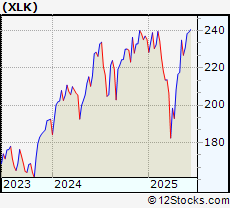
and services subsectors. Technology sector, as represented by XLK, an exchange-traded fund [ETF] that holds basket of tech stocks (e.g, Intel, Google) is up by 18.6997% and is currently outperforming the overall market by 5.111% year-to-date. Below is a quick view of technical charts and trends: |
|
 XLK Weekly Chart |
|
| Long Term Trend: Very Good | |
| Medium Term Trend: Good | |
 XLK Daily Chart |
|
| Short Term Trend: Very Good | |
| Overall Trend Score: 100 | |
| YTD Performance: 18.6997% | |
| **Trend Scores & Views Are Only For Educational Purposes And Not For Investing | |
| 12Stocks.com: Top Performing Technology Sector Stocks | ||||||||||||||||||||||||||||||||||||||||||||||||
 The top performing Technology sector stocks year to date are
Now, more recently, over last week, the top performing Technology sector stocks on the move are


|
||||||||||||||||||||||||||||||||||||||||||||||||
| 12Stocks.com: Investing in Tech Sector using Exchange Traded Funds | |
|
The following table shows list of key exchange traded funds (ETF) that
help investors track Tech Index. For detailed view, check out our ETF Funds section of our website. Quick View: Move mouse or cursor over ETF symbol (ticker) to view short-term technical chart and over ETF name to view long term chart. Click on ticker or stock name for detailed view. Click on to add stock symbol to your watchlist and to view watchlist. |
12Stocks.com List of ETFs that track Tech Index
| Ticker | ETF Name | Watchlist | Recent Price | Smart Investing & Trading Score | Change % | Week % | Year-to-date % |
| IGN | Tech-Multimd Ntwk | | 53.86 | 40 | 0.918119 | -20.6435 | 0% |
| 12Stocks.com: Charts, Trends, Fundamental Data and Performances of Tech Stocks | |
|
We now take in-depth look at all Tech stocks including charts, multi-period performances and overall trends (as measured by Smart Investing & Trading Score). One can sort Tech stocks (click link to choose) by Daily, Weekly and by Year-to-Date performances. Also, one can sort by size of the company or by market capitalization. |
| Select Your Default Chart Type: | |||||
| |||||
| Click on stock symbol or name for detailed view. Click on to add stock symbol to your watchlist and to view watchlist. Quick View: Move mouse or cursor over "Daily" to quickly view daily technical stock chart and over "Weekly" to view weekly technical stock chart. | |||||


 | UBNT Ubiquiti Networks, Inc. |
| Sector: Technology | |
| SubSector: Wireless Communications | |
| MarketCap: 4240.31 Millions | |
| Recent Price: 358.84 Smart Investing & Trading Score: 60 | |
| Day Percent Change: -2.51032% Day Change: -9999 | |
| Week Change: 64.8399% Year-to-date Change: 0.0% | |
| UBNT Links: Profile News Message Board | |
| Charts:- Daily , Weekly | |
| Add UBNT to Watchlist: View: Get Complete UBNT Trend Analysis ➞ | |
 | RVLT Revolution Lighting Technologies, Inc. |
| Sector: Technology | |
| SubSector: Diversified Electronics | |
| MarketCap: 139.05 Millions | |
| Recent Price: 2.72 Smart Investing & Trading Score: 10 | |
| Day Percent Change: -2.50896% Day Change: -9999 | |
| Week Change: -81.9509% Year-to-date Change: 0.0% | |
| RVLT Links: Profile News Message Board | |
| Charts:- Daily , Weekly | |
| Add RVLT to Watchlist: View: Get Complete RVLT Trend Analysis ➞ | |
 | SYMC Symantec Corporation |
| Sector: Technology | |
| SubSector: Security Software & Services | |
| MarketCap: 19046.4 Millions | |
| Recent Price: 170.75 Smart Investing & Trading Score: 20 | |
| Day Percent Change: -2.52326% Day Change: -9999 | |
| Week Change: -7.83721% Year-to-date Change: 0.0% | |
| SYMC Links: Profile News Message Board | |
| Charts:- Daily , Weekly | |
| Add SYMC to Watchlist: View: Get Complete SYMC Trend Analysis ➞ | |
 | PDVW pdvWireless, Inc. |
| Sector: Technology | |
| SubSector: Application Software | |
| MarketCap: 314.28 Millions | |
| Recent Price: 43.56 Smart Investing & Trading Score: 20 | |
| Day Percent Change: -2.55034% Day Change: -9999 | |
| Week Change: 2.88144% Year-to-date Change: 0.0% | |
| PDVW Links: Profile News Message Board | |
| Charts:- Daily , Weekly | |
| Add PDVW to Watchlist: View: Get Complete PDVW Trend Analysis ➞ | |
 | BMI Badger Meter Inc |
| Sector: Technology | |
| SubSector: Scientific & Technical Instruments | |
| MarketCap: 5387.78 Millions | |
| Recent Price: 172.67 Smart Investing & Trading Score: 10 | |
| Day Percent Change: -2.58392% Day Change: -4.15 | |
| Week Change: -3.77285% Year-to-date Change: -18.2% | |
| BMI Links: Profile News Message Board | |
| Charts:- Daily , Weekly | |
| Add BMI to Watchlist: View: Get Complete BMI Trend Analysis ➞ | |
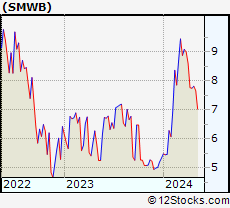 | SMWB Similarweb Ltd |
| Sector: Technology | |
| SubSector: Software - Application | |
| MarketCap: 805.1 Millions | |
| Recent Price: 9.74 Smart Investing & Trading Score: 40 | |
| Day Percent Change: -2.6% Day Change: 0.09 | |
| Week Change: 0.205761% Year-to-date Change: -30.4% | |
| SMWB Links: Profile News Message Board | |
| Charts:- Daily , Weekly | |
| Add SMWB to Watchlist: View: Get Complete SMWB Trend Analysis ➞ | |
 | ASGN ASGN Inc |
| Sector: Technology | |
| SubSector: Information Technology Services | |
| MarketCap: 2324.47 Millions | |
| Recent Price: 49.51 Smart Investing & Trading Score: 10 | |
| Day Percent Change: -2.61605% Day Change: -0.13 | |
| Week Change: -5.46114% Year-to-date Change: -40.2% | |
| ASGN Links: Profile News Message Board | |
| Charts:- Daily , Weekly | |
| Add ASGN to Watchlist: View: Get Complete ASGN Trend Analysis ➞ | |
 | IIJI Internet Initiative Japan Inc. |
| Sector: Technology | |
| SubSector: Communication Equipment | |
| MarketCap: 833.51 Millions | |
| Recent Price: 31.11 Smart Investing & Trading Score: 70 | |
| Day Percent Change: -2.62911% Day Change: -9999 | |
| Week Change: 913.355% Year-to-date Change: 0.0% | |
| IIJI Links: Profile News Message Board | |
| Charts:- Daily , Weekly | |
| Add IIJI to Watchlist: View: Get Complete IIJI Trend Analysis ➞ | |
 | CLS Celestica, Inc |
| Sector: Technology | |
| SubSector: Electronic Components | |
| MarketCap: 27915.5 Millions | |
| Recent Price: 247.66 Smart Investing & Trading Score: 70 | |
| Day Percent Change: -2.64554% Day Change: -1.56 | |
| Week Change: 1.46673% Year-to-date Change: 166.1% | |
| CLS Links: Profile News Message Board | |
| Charts:- Daily , Weekly | |
| Add CLS to Watchlist: View: Get Complete CLS Trend Analysis ➞ | |
 | JKS JinkoSolar Holding Co. Ltd ADR |
| Sector: Technology | |
| SubSector: Solar | |
| MarketCap: 1277.06 Millions | |
| Recent Price: 25.34 Smart Investing & Trading Score: 60 | |
| Day Percent Change: -2.76286% Day Change: -0.97 | |
| Week Change: 3.51307% Year-to-date Change: 3.7% | |
| JKS Links: Profile News Message Board | |
| Charts:- Daily , Weekly | |
| Add JKS to Watchlist: View: Get Complete JKS Trend Analysis ➞ | |
 | SONO Sonos Inc |
| Sector: Technology | |
| SubSector: Consumer Electronics | |
| MarketCap: 1775.73 Millions | |
| Recent Price: 15.09 Smart Investing & Trading Score: 50 | |
| Day Percent Change: -2.80193% Day Change: -0.04 | |
| Week Change: 0.667111% Year-to-date Change: 2.4% | |
| SONO Links: Profile News Message Board | |
| Charts:- Daily , Weekly | |
| Add SONO to Watchlist: View: Get Complete SONO Trend Analysis ➞ | |
 | BELFB Bel Fuse Inc |
| Sector: Technology | |
| SubSector: Electronic Components | |
| MarketCap: 1766.38 Millions | |
| Recent Price: 144.60 Smart Investing & Trading Score: 60 | |
| Day Percent Change: -2.80952% Day Change: 0.5 | |
| Week Change: 1.01292% Year-to-date Change: 78.9% | |
| BELFB Links: Profile News Message Board | |
| Charts:- Daily , Weekly | |
| Add BELFB to Watchlist: View: Get Complete BELFB Trend Analysis ➞ | |
 | APPS Digital Turbine Inc |
| Sector: Technology | |
| SubSector: Software - Application | |
| MarketCap: 483.35 Millions | |
| Recent Price: 5.19 Smart Investing & Trading Score: 70 | |
| Day Percent Change: -2.80899% Day Change: -0.03 | |
| Week Change: 13.5667% Year-to-date Change: 194.9% | |
| APPS Links: Profile News Message Board | |
| Charts:- Daily , Weekly | |
| Add APPS to Watchlist: View: Get Complete APPS Trend Analysis ➞ | |
 | AUR Aurora Innovation Inc |
| Sector: Technology | |
| SubSector: Information Technology Services | |
| MarketCap: 10573.8 Millions | |
| Recent Price: 5.89 Smart Investing & Trading Score: 80 | |
| Day Percent Change: -2.80528% Day Change: 0.08 | |
| Week Change: 3.33333% Year-to-date Change: -3.4% | |
| AUR Links: Profile News Message Board | |
| Charts:- Daily , Weekly | |
| Add AUR to Watchlist: View: Get Complete AUR Trend Analysis ➞ | |
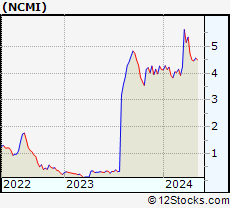 | NCMI National Cinemedia Inc |
| Sector: Technology | |
| SubSector: Advertising Agencies | |
| MarketCap: 411.39 Millions | |
| Recent Price: 4.75 Smart Investing & Trading Score: 30 | |
| Day Percent Change: -2.86299% Day Change: 0.07 | |
| Week Change: 2.15054% Year-to-date Change: -27.3% | |
| NCMI Links: Profile News Message Board | |
| Charts:- Daily , Weekly | |
| Add NCMI to Watchlist: View: Get Complete NCMI Trend Analysis ➞ | |
 | ZH Zhihu Inc ADR |
| Sector: Technology | |
| SubSector: Internet Content & Information | |
| MarketCap: 388.24 Millions | |
| Recent Price: 5.24 Smart Investing & Trading Score: 70 | |
| Day Percent Change: -2.96296% Day Change: 0.07 | |
| Week Change: 7.59754% Year-to-date Change: 48.0% | |
| ZH Links: Profile News Message Board | |
| Charts:- Daily , Weekly | |
| Add ZH to Watchlist: View: Get Complete ZH Trend Analysis ➞ | |
 | NTES NetEase Inc ADR |
| Sector: Technology | |
| SubSector: Electronic Gaming & Multimedia | |
| MarketCap: 85372.9 Millions | |
| Recent Price: 154.61 Smart Investing & Trading Score: 60 | |
| Day Percent Change: -2.9685% Day Change: -4.73 | |
| Week Change: 6.0789% Year-to-date Change: 79.3% | |
| NTES Links: Profile News Message Board | |
| Charts:- Daily , Weekly | |
| Add NTES to Watchlist: View: Get Complete NTES Trend Analysis ➞ | |
 | DOYU DouYu International Holdings Ltd ADR |
| Sector: Technology | |
| SubSector: Internet Content & Information | |
| MarketCap: 233.9 Millions | |
| Recent Price: 7.79 Smart Investing & Trading Score: 60 | |
| Day Percent Change: -2.98879% Day Change: -0.13 | |
| Week Change: -0.890585% Year-to-date Change: -30.3% | |
| DOYU Links: Profile News Message Board | |
| Charts:- Daily , Weekly | |
| Add DOYU to Watchlist: View: Get Complete DOYU Trend Analysis ➞ | |
 | TV Grupo Televisa SAB ADR |
| Sector: Technology | |
| SubSector: Telecom Services | |
| MarketCap: 1281.93 Millions | |
| Recent Price: 2.83 Smart Investing & Trading Score: 70 | |
| Day Percent Change: -3.08219% Day Change: -0.01 | |
| Week Change: 1.07143% Year-to-date Change: 69.5% | |
| TV Links: Profile News Message Board | |
| Charts:- Daily , Weekly | |
| Add TV to Watchlist: View: Get Complete TV Trend Analysis ➞ | |
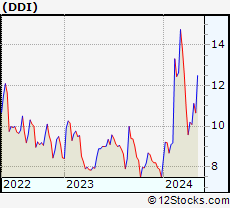 | DDI DoubleDown Interactive Co Ltd ADR |
| Sector: Technology | |
| SubSector: Electronic Gaming & Multimedia | |
| MarketCap: 473.2 Millions | |
| Recent Price: 9.40 Smart Investing & Trading Score: 20 | |
| Day Percent Change: -3.09278% Day Change: 0.01 | |
| Week Change: -0.318134% Year-to-date Change: -8.1% | |
| DDI Links: Profile News Message Board | |
| Charts:- Daily , Weekly | |
| Add DDI to Watchlist: View: Get Complete DDI Trend Analysis ➞ | |
 | GCT GigaCloud Technology Inc |
| Sector: Technology | |
| SubSector: Software - Infrastructure | |
| MarketCap: 1008.23 Millions | |
| Recent Price: 29.71 Smart Investing & Trading Score: 50 | |
| Day Percent Change: -3.0985% Day Change: -1.65 | |
| Week Change: -0.502344% Year-to-date Change: 55.9% | |
| GCT Links: Profile News Message Board | |
| Charts:- Daily , Weekly | |
| Add GCT to Watchlist: View: Get Complete GCT Trend Analysis ➞ | |
 | VSAT Viasat, Inc |
| Sector: Technology | |
| SubSector: Communication Equipment | |
| MarketCap: 3980.89 Millions | |
| Recent Price: 31.35 Smart Investing & Trading Score: 70 | |
| Day Percent Change: -3.12% Day Change: -1.01 | |
| Week Change: 2.62% Year-to-date Change: 225.9% | |
| VSAT Links: Profile News Message Board | |
| Charts:- Daily , Weekly | |
| Add VSAT to Watchlist: View: Get Complete VSAT Trend Analysis ➞ | |
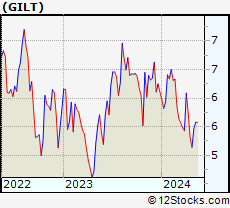 | GILT Gilat Satellite Networks |
| Sector: Technology | |
| SubSector: Communication Equipment | |
| MarketCap: 568.95 Millions | |
| Recent Price: 11.14 Smart Investing & Trading Score: 90 | |
| Day Percent Change: -3.13043% Day Change: 0.61 | |
| Week Change: 12.639% Year-to-date Change: 81.1% | |
| GILT Links: Profile News Message Board | |
| Charts:- Daily , Weekly | |
| Add GILT to Watchlist: View: Get Complete GILT Trend Analysis ➞ | |
 | JMU JMU Limited |
| Sector: Technology | |
| SubSector: Internet Information Providers | |
| MarketCap: 243.51 Millions | |
| Recent Price: 11.62 Smart Investing & Trading Score: 0 | |
| Day Percent Change: -3.16667% Day Change: -9999 | |
| Week Change: -83.3142% Year-to-date Change: 0.0% | |
| JMU Links: Profile News Message Board | |
| Charts:- Daily , Weekly | |
| Add JMU to Watchlist: View: Get Complete JMU Trend Analysis ➞ | |
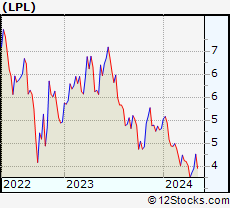 | LPL LG Display Co Ltd. ADR |
| Sector: Technology | |
| SubSector: Consumer Electronics | |
| MarketCap: 4460 Millions | |
| Recent Price: 4.80 Smart Investing & Trading Score: 100 | |
| Day Percent Change: -3.22581% Day Change: -0.01 | |
| Week Change: 9.33941% Year-to-date Change: 54.8% | |
| LPL Links: Profile News Message Board | |
| Charts:- Daily , Weekly | |
| Add LPL to Watchlist: View: Get Complete LPL Trend Analysis ➞ | |
| For tabular summary view of above stock list: Summary View ➞ 0 - 25 , 25 - 50 , 50 - 75 , 75 - 100 , 100 - 125 , 125 - 150 , 150 - 175 , 175 - 200 , 200 - 225 , 225 - 250 , 250 - 275 , 275 - 300 , 300 - 325 , 325 - 350 , 350 - 375 , 375 - 400 , 400 - 425 , 425 - 450 , 450 - 475 , 475 - 500 , 500 - 525 , 525 - 550 , 550 - 575 , 575 - 600 , 600 - 625 , 625 - 650 , 650 - 675 , 675 - 700 , 700 - 725 , 725 - 750 , 750 - 775 , 775 - 800 , 800 - 825 , 825 - 850 , 850 - 875 , 875 - 900 | ||
| Click To Change The Sort Order: By Market Cap or Company Size Performance: Year-to-date, Week and Day | |
| Select Chart Type: | ||
|
Best Stocks Today 12Stocks.com |
© 2025 12Stocks.com Terms & Conditions Privacy Contact Us
All Information Provided Only For Education And Not To Be Used For Investing or Trading. See Terms & Conditions


One More Thing ... Get Best Stocks Delivered Daily!
Never Ever Miss A Move With Our Top Ten Stocks Lists
Find Best Stocks In Any Market - Bull or Bear Market
Take A Peek At Our Top Ten Stocks Lists: Daily, Weekly, Year-to-Date & Top Trends
Find Best Stocks In Any Market - Bull or Bear Market
Take A Peek At Our Top Ten Stocks Lists: Daily, Weekly, Year-to-Date & Top Trends
Technology Stocks With Best Up Trends [0-bearish to 100-bullish]: Sony [100], Intel Corp[100], D-Wave Quantum[100], Lyft [100], Xunlei [100], Bandwidth [100], Rigetti Computing[100], Veritone [100], Parsons Corp[100], Lightpath [100], ACM Research[100]
Best Technology Stocks Year-to-Date:
Pagaya [335.618%], Sify [306.863%], Xunlei [288.571%], Viasat [225.88%], CommScope Holding[215.891%], EchoStar Corp[215.648%], CuriosityStream [208.675%], Digital Turbine[194.886%], Oneconnect Financial[194.239%], nLIGHT [183.846%], Celestica [166.101%] Best Technology Stocks This Week:
GTT [443626%], Barracuda Networks[71050%], Mobile TeleSystems[10483.5%], Nam Tai[5033.33%], Ebix [4200.85%], Fang [4150%], NantHealth [3114.02%], Hemisphere Media[2981.82%], Yandex N.V[2935.27%], Castlight Health[1751.96%], Benefitfocus [1254.48%] Best Technology Stocks Daily:
Sony [194.565%], Intel Corp[24.7791%], D-Wave Quantum[18.7566%], Latch [16.6667%], Oclaro [14.734%], Lyft [13.0693%], Xunlei [11.6279%], Bandwidth [10.7143%], Crowdstrike [10.321%], Rigetti Computing[9.95%], Veritone [9.91957%]