
 Login Sign Up


| |||||
 |  | ||||

| 12Stocks.com Market Intelligence |
Best Tech Stocks
| In a hurry? Tech Stocks Lists: Performance & Trends, Stock Charts, FANG Stocks
Sort Tech stocks: Daily, Weekly, Year-to-Date, Market Cap & Trends. Filter Tech stocks list by size:All Tech Large Mid-Range Small and MicroCap |
| 12Stocks.com Tech Stocks Performances & Trends Daily | |||||||||
|
|  The overall Smart Investing & Trading Score is 100 (0-bearish to 100-bullish) which puts Technology sector in short term bullish trend. The Smart Investing & Trading Score from previous trading session is 60 and hence an improvement of trend.
| ||||||||
Here are the Smart Investing & Trading Scores of the most requested Technology stocks at 12Stocks.com (click stock name for detailed review):
|


| 12Stocks.com: Investing in Technology sector with Stocks | |
|
The following table helps investors and traders sort through current performance and trends (as measured by Smart Investing & Trading Score) of various
stocks in the Tech sector. Quick View: Move mouse or cursor over stock symbol (ticker) to view short-term technical chart and over stock name to view long term chart. Click on  to add stock symbol to your watchlist and to add stock symbol to your watchlist and  to view watchlist. Click on any ticker or stock name for detailed market intelligence report for that stock. to view watchlist. Click on any ticker or stock name for detailed market intelligence report for that stock. |
12Stocks.com Performance of Stocks in Tech Sector
| Ticker | Stock Name | Watchlist | Category | Recent Price | Smart Investing & Trading Score | Change % | YTD Change% |
| MDRX | Allscripts Healthcare |   | Software | 4.75 | 80 | -2.06 | -47.80% |
| LXFT | Luxoft Holding | | Software | 36.56 | 0 | -2.06 | 0.00% |
| ENPH | Enphase Energy | | Solar | 37.92 | 50 | -2.07 | -46.86% |
| SSTK | Shutterstock | | Internet Content & Information | 21.54 | 60 | -2.09 | -23.59% |
| CMCSA | Comcast Corp | | Telecom | 31.75 | 0 | -2.10 | -12.87% |
| GUID | Guidance Software | | Software | 4.66 | 20 | -2.10 | 0.00% |
| SGH | SMART Global | | Semiconductor- | 20.41 | 20 | -2.11 | 0.00% |
| BDC | Belden | | Communication | 126.70 | 20 | -2.12 | 12.03% |
| XRX | Xerox | | IT | 3.67 | 30 | -2.13 | -54.24% |
| GIMO | Gigamon | | Networking | 1.80 | 0 | -2.17 | 0.00% |
| ARRS | ARRIS | | Communication | 8.97 | 80 | -2.18 | 0.00% |
| TRUE | Truecar | | Internet Content & Information | 2.23 | 50 | -2.19 | -36.29% |
| ORCL | Oracle Corp | | Software - Infrastructure | 294.66 | 60 | -2.24 | 78.95% |
| RELL | Richardson Electronics | | Electronic Components | 9.99 | 90 | -2.25 | -28.14% |
| ZIXI | Zix | | Software | 33.40 | 70 | -2.25 | 0.00% |
| SSTI | SoundThinking | | Software - | 12.03 | 10 | -2.27 | -5.72% |
| SAIL | Sailpoint | | Software - Infrastructure | 21.11 | 50 | -2.31 | -4.05% |
| YY | JOYY | | Internet | 47.85 | 70 | -2.39 | 20.29% |
| EVC | Entravision | | Advertising Agencies | 2.43 | 30 | -2.41 | 10.11% |
| OPRA | Opera | | Internet Content & Information | 19.41 | 60 | -2.46 | 5.48% |
| YOU | Clear Secure | | Software - | 36.87 | 50 | -2.46 | 37.68% |
| TTMI | TTM | | Electronic Components | 49.03 | 90 | -2.47 | 99.47% |
| ASUR | Asure Software | | Software - | 7.84 | 40 | -2.49 | -17.21% |
| GCI | Gannett Co | | Publishing | 4.27 | 80 | -2.51 | -15.78% |
| SCSC | Scansource | | Electronics & Computer Distribution | 43.94 | 40 | -2.51 | -6.57% |
| For chart view version of above stock list: Chart View ➞ 0 - 25 , 25 - 50 , 50 - 75 , 75 - 100 , 100 - 125 , 125 - 150 , 150 - 175 , 175 - 200 , 200 - 225 , 225 - 250 , 250 - 275 , 275 - 300 , 300 - 325 , 325 - 350 , 350 - 375 , 375 - 400 , 400 - 425 , 425 - 450 , 450 - 475 , 475 - 500 , 500 - 525 , 525 - 550 , 550 - 575 , 575 - 600 , 600 - 625 , 625 - 650 , 650 - 675 , 675 - 700 , 700 - 725 , 725 - 750 , 750 - 775 , 775 - 800 , 800 - 825 , 825 - 850 , 850 - 875 , 875 - 900 | ||
 | Click To Change The Sort Order: By Market Cap or Company Size Performance: Year-to-date, Week and Day |  |
|
Get the most comprehensive stock market coverage daily at 12Stocks.com ➞ Best Stocks Today ➞ Best Stocks Weekly ➞ Best Stocks Year-to-Date ➞ Best Stocks Trends ➞  Best Stocks Today 12Stocks.com Best Nasdaq Stocks ➞ Best S&P 500 Stocks ➞ Best Tech Stocks ➞ Best Biotech Stocks ➞ |
| Detailed Overview of Tech Stocks |
| Tech Technical Overview, Leaders & Laggards, Top Tech ETF Funds & Detailed Tech Stocks List, Charts, Trends & More |
| Tech Sector: Technical Analysis, Trends & YTD Performance | |
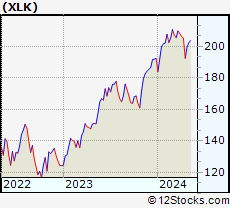
| Technology sector is composed of stocks
from semiconductors, software, web, social media
and services subsectors. Technology sector, as represented by XLK, an exchange-traded fund [ETF] that holds basket of tech stocks (e.g, Intel, Google) is up by 18.6997% and is currently outperforming the overall market by 5.111% year-to-date. Below is a quick view of technical charts and trends: |
|
 XLK Weekly Chart |
|
| Long Term Trend: Very Good | |
| Medium Term Trend: Good | |
 XLK Daily Chart |
|
| Short Term Trend: Very Good | |
| Overall Trend Score: 100 | |
| YTD Performance: 18.6997% | |
| **Trend Scores & Views Are Only For Educational Purposes And Not For Investing | |
| 12Stocks.com: Top Performing Technology Sector Stocks | ||||||||||||||||||||||||||||||||||||||||||||||||
 The top performing Technology sector stocks year to date are
Now, more recently, over last week, the top performing Technology sector stocks on the move are


|
||||||||||||||||||||||||||||||||||||||||||||||||
| 12Stocks.com: Investing in Tech Sector using Exchange Traded Funds | |
|
The following table shows list of key exchange traded funds (ETF) that
help investors track Tech Index. For detailed view, check out our ETF Funds section of our website. Quick View: Move mouse or cursor over ETF symbol (ticker) to view short-term technical chart and over ETF name to view long term chart. Click on ticker or stock name for detailed view. Click on to add stock symbol to your watchlist and to view watchlist. |
12Stocks.com List of ETFs that track Tech Index
| Ticker | ETF Name | Watchlist | Recent Price | Smart Investing & Trading Score | Change % | Week % | Year-to-date % |
| IGN | Tech-Multimd Ntwk | | 53.86 | 40 | 0.918119 | -20.6435 | 0% |
| 12Stocks.com: Charts, Trends, Fundamental Data and Performances of Tech Stocks | |
|
We now take in-depth look at all Tech stocks including charts, multi-period performances and overall trends (as measured by Smart Investing & Trading Score). One can sort Tech stocks (click link to choose) by Daily, Weekly and by Year-to-Date performances. Also, one can sort by size of the company or by market capitalization. |
| Select Your Default Chart Type: | |||||
| |||||
| Click on stock symbol or name for detailed view. Click on to add stock symbol to your watchlist and to view watchlist. Quick View: Move mouse or cursor over "Daily" to quickly view daily technical stock chart and over "Weekly" to view weekly technical stock chart. | |||||


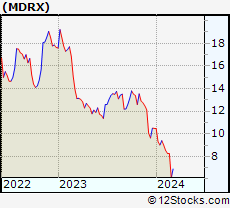 | MDRX Allscripts Healthcare Solutions, Inc. |
| Sector: Technology | |
| SubSector: Application Software | |
| MarketCap: 1026.62 Millions | |
| Recent Price: 4.75 Smart Investing & Trading Score: 80 | |
| Day Percent Change: -2.06186% Day Change: -0.05 | |
| Week Change: -2.06186% Year-to-date Change: -47.8% | |
| MDRX Links: Profile News Message Board | |
| Charts:- Daily , Weekly | |
| Add MDRX to Watchlist: View: Get Complete MDRX Trend Analysis ➞ | |
 | LXFT Luxoft Holding, Inc. |
| Sector: Technology | |
| SubSector: Application Software | |
| MarketCap: 1958.23 Millions | |
| Recent Price: 36.56 Smart Investing & Trading Score: 0 | |
| Day Percent Change: -2.06268% Day Change: -9999 | |
| Week Change: -23.5946% Year-to-date Change: 0.0% | |
| LXFT Links: Profile News Message Board | |
| Charts:- Daily , Weekly | |
| Add LXFT to Watchlist: View: Get Complete LXFT Trend Analysis ➞ | |
 | ENPH Enphase Energy Inc |
| Sector: Technology | |
| SubSector: Solar | |
| MarketCap: 5184.27 Millions | |
| Recent Price: 37.92 Smart Investing & Trading Score: 50 | |
| Day Percent Change: -2.06612% Day Change: -0.8 | |
| Week Change: 2.15517% Year-to-date Change: -46.9% | |
| ENPH Links: Profile News Message Board | |
| Charts:- Daily , Weekly | |
| Add ENPH to Watchlist: View: Get Complete ENPH Trend Analysis ➞ | |
 | SSTK Shutterstock Inc |
| Sector: Technology | |
| SubSector: Internet Content & Information | |
| MarketCap: 713.38 Millions | |
| Recent Price: 21.54 Smart Investing & Trading Score: 60 | |
| Day Percent Change: -2.09091% Day Change: 0.28 | |
| Week Change: 6.26542% Year-to-date Change: -23.6% | |
| SSTK Links: Profile News Message Board | |
| Charts:- Daily , Weekly | |
| Add SSTK to Watchlist: View: Get Complete SSTK Trend Analysis ➞ | |
 | CMCSA Comcast Corp |
| Sector: Technology | |
| SubSector: Telecom Services | |
| MarketCap: 125203 Millions | |
| Recent Price: 31.75 Smart Investing & Trading Score: 0 | |
| Day Percent Change: -2.09682% Day Change: -0.68 | |
| Week Change: -5.16726% Year-to-date Change: -12.9% | |
| CMCSA Links: Profile News Message Board | |
| Charts:- Daily , Weekly | |
| Add CMCSA to Watchlist: View: Get Complete CMCSA Trend Analysis ➞ | |
 | GUID Guidance Software, Inc. |
| Sector: Technology | |
| SubSector: Application Software | |
| MarketCap: 201.27 Millions | |
| Recent Price: 4.66 Smart Investing & Trading Score: 20 | |
| Day Percent Change: -2.10084% Day Change: -9999 | |
| Week Change: -27.9753% Year-to-date Change: 0.0% | |
| GUID Links: Profile News Message Board | |
| Charts:- Daily , Weekly | |
| Add GUID to Watchlist: View: Get Complete GUID Trend Analysis ➞ | |
 | SGH SMART Global Holdings, Inc. |
| Sector: Technology | |
| SubSector: Semiconductor- Memory Chips | |
| MarketCap: 657.8 Millions | |
| Recent Price: 20.41 Smart Investing & Trading Score: 20 | |
| Day Percent Change: -2.11031% Day Change: -9999 | |
| Week Change: -1.96926% Year-to-date Change: 0.0% | |
| SGH Links: Profile News Message Board | |
| Charts:- Daily , Weekly | |
| Add SGH to Watchlist: View: Get Complete SGH Trend Analysis ➞ | |
 | BDC Belden Inc |
| Sector: Technology | |
| SubSector: Communication Equipment | |
| MarketCap: 5143.84 Millions | |
| Recent Price: 126.70 Smart Investing & Trading Score: 20 | |
| Day Percent Change: -2.12437% Day Change: 0.8 | |
| Week Change: -1.00789% Year-to-date Change: 12.0% | |
| BDC Links: Profile News Message Board | |
| Charts:- Daily , Weekly | |
| Add BDC to Watchlist: View: Get Complete BDC Trend Analysis ➞ | |
 | XRX Xerox Holdings Corp |
| Sector: Technology | |
| SubSector: Information Technology Services | |
| MarketCap: 493.25 Millions | |
| Recent Price: 3.67 Smart Investing & Trading Score: 30 | |
| Day Percent Change: -2.13333% Day Change: -0.13 | |
| Week Change: -1.34409% Year-to-date Change: -54.2% | |
| XRX Links: Profile News Message Board | |
| Charts:- Daily , Weekly | |
| Add XRX to Watchlist: View: Get Complete XRX Trend Analysis ➞ | |
 | GIMO Gigamon Inc. |
| Sector: Technology | |
| SubSector: Networking & Communication Devices | |
| MarketCap: 1265.05 Millions | |
| Recent Price: 1.80 Smart Investing & Trading Score: 0 | |
| Day Percent Change: -2.17391% Day Change: -9999 | |
| Week Change: -85.9594% Year-to-date Change: 0.0% | |
| GIMO Links: Profile News Message Board | |
| Charts:- Daily , Weekly | |
| Add GIMO to Watchlist: View: Get Complete GIMO Trend Analysis ➞ | |
 | ARRS ARRIS International plc |
| Sector: Technology | |
| SubSector: Communication Equipment | |
| MarketCap: 4917.34 Millions | |
| Recent Price: 8.97 Smart Investing & Trading Score: 80 | |
| Day Percent Change: -2.18103% Day Change: -9999 | |
| Week Change: 33.6811% Year-to-date Change: 0.0% | |
| ARRS Links: Profile News Message Board | |
| Charts:- Daily , Weekly | |
| Add ARRS to Watchlist: View: Get Complete ARRS Trend Analysis ➞ | |
 | TRUE Truecar Inc |
| Sector: Technology | |
| SubSector: Internet Content & Information | |
| MarketCap: 191.03 Millions | |
| Recent Price: 2.23 Smart Investing & Trading Score: 50 | |
| Day Percent Change: -2.19298% Day Change: 0.04 | |
| Week Change: 3.72093% Year-to-date Change: -36.3% | |
| TRUE Links: Profile News Message Board | |
| Charts:- Daily , Weekly | |
| Add TRUE to Watchlist: View: Get Complete TRUE Trend Analysis ➞ | |
 | ORCL Oracle Corp |
| Sector: Technology | |
| SubSector: Software - Infrastructure | |
| MarketCap: 653896 Millions | |
| Recent Price: 294.66 Smart Investing & Trading Score: 60 | |
| Day Percent Change: -2.23947% Day Change: -6.75 | |
| Week Change: -10.2549% Year-to-date Change: 79.0% | |
| ORCL Links: Profile News Message Board | |
| Charts:- Daily , Weekly | |
| Add ORCL to Watchlist: View: Get Complete ORCL Trend Analysis ➞ | |
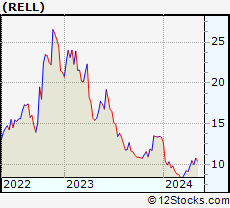 | RELL Richardson Electronics, Ltd |
| Sector: Technology | |
| SubSector: Electronic Components | |
| MarketCap: 139.59 Millions | |
| Recent Price: 9.99 Smart Investing & Trading Score: 90 | |
| Day Percent Change: -2.25049% Day Change: -0.13 | |
| Week Change: 4.93698% Year-to-date Change: -28.1% | |
| RELL Links: Profile News Message Board | |
| Charts:- Daily , Weekly | |
| Add RELL to Watchlist: View: Get Complete RELL Trend Analysis ➞ | |
 | ZIXI Zix Corporation |
| Sector: Technology | |
| SubSector: Application Software | |
| MarketCap: 242.462 Millions | |
| Recent Price: 33.40 Smart Investing & Trading Score: 70 | |
| Day Percent Change: -2.25344% Day Change: -9999 | |
| Week Change: 293.636% Year-to-date Change: 0.0% | |
| ZIXI Links: Profile News Message Board | |
| Charts:- Daily , Weekly | |
| Add ZIXI to Watchlist: View: Get Complete ZIXI Trend Analysis ➞ | |
 | SSTI SoundThinking Inc |
| Sector: Technology | |
| SubSector: Software - Application | |
| MarketCap: 157.33 Millions | |
| Recent Price: 12.03 Smart Investing & Trading Score: 10 | |
| Day Percent Change: -2.27457% Day Change: 0.09 | |
| Week Change: 0.333611% Year-to-date Change: -5.7% | |
| SSTI Links: Profile News Message Board | |
| Charts:- Daily , Weekly | |
| Add SSTI to Watchlist: View: Get Complete SSTI Trend Analysis ➞ | |
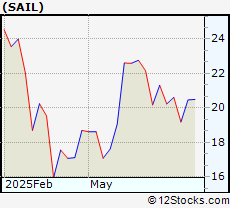 | SAIL Sailpoint Inc |
| Sector: Technology | |
| SubSector: Software - Infrastructure | |
| MarketCap: 12233.8 Millions | |
| Recent Price: 21.11 Smart Investing & Trading Score: 50 | |
| Day Percent Change: -2.31374% Day Change: -0.08 | |
| Week Change: 2.17812% Year-to-date Change: -4.0% | |
| SAIL Links: Profile News Message Board | |
| Charts:- Daily , Weekly | |
| Add SAIL to Watchlist: View: Get Complete SAIL Trend Analysis ➞ | |
 | YY JOYY Inc. |
| Sector: Technology | |
| SubSector: Internet Information Providers | |
| MarketCap: 3527.6 Millions | |
| Recent Price: 47.85 Smart Investing & Trading Score: 70 | |
| Day Percent Change: -2.38678% Day Change: -9999 | |
| Week Change: 10.8922% Year-to-date Change: 20.3% | |
| YY Links: Profile News Message Board | |
| Charts:- Daily , Weekly | |
| Add YY to Watchlist: View: Get Complete YY Trend Analysis ➞ | |
 | EVC Entravision Communications Corp |
| Sector: Technology | |
| SubSector: Advertising Agencies | |
| MarketCap: 225.62 Millions | |
| Recent Price: 2.43 Smart Investing & Trading Score: 30 | |
| Day Percent Change: -2.40964% Day Change: -0.02 | |
| Week Change: -2.01613% Year-to-date Change: 10.1% | |
| EVC Links: Profile News Message Board | |
| Charts:- Daily , Weekly | |
| Add EVC to Watchlist: View: Get Complete EVC Trend Analysis ➞ | |
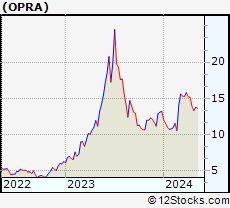 | OPRA Opera Ltd ADR |
| Sector: Technology | |
| SubSector: Internet Content & Information | |
| MarketCap: 1595.07 Millions | |
| Recent Price: 19.41 Smart Investing & Trading Score: 60 | |
| Day Percent Change: -2.46231% Day Change: 0.26 | |
| Week Change: -0.918836% Year-to-date Change: 5.5% | |
| OPRA Links: Profile News Message Board | |
| Charts:- Daily , Weekly | |
| Add OPRA to Watchlist: View: Get Complete OPRA Trend Analysis ➞ | |
 | YOU Clear Secure Inc |
| Sector: Technology | |
| SubSector: Software - Application | |
| MarketCap: 4640.44 Millions | |
| Recent Price: 36.87 Smart Investing & Trading Score: 50 | |
| Day Percent Change: -2.46032% Day Change: 1.14 | |
| Week Change: 0.545405% Year-to-date Change: 37.7% | |
| YOU Links: Profile News Message Board | |
| Charts:- Daily , Weekly | |
| Add YOU to Watchlist: View: Get Complete YOU Trend Analysis ➞ | |
 | TTMI TTM Technologies Inc |
| Sector: Technology | |
| SubSector: Electronic Components | |
| MarketCap: 4928.04 Millions | |
| Recent Price: 49.03 Smart Investing & Trading Score: 90 | |
| Day Percent Change: -2.46668% Day Change: 0.72 | |
| Week Change: 3.0042% Year-to-date Change: 99.5% | |
| TTMI Links: Profile News Message Board | |
| Charts:- Daily , Weekly | |
| Add TTMI to Watchlist: View: Get Complete TTMI Trend Analysis ➞ | |
 | ASUR Asure Software Inc |
| Sector: Technology | |
| SubSector: Software - Application | |
| MarketCap: 220.22 Millions | |
| Recent Price: 7.84 Smart Investing & Trading Score: 40 | |
| Day Percent Change: -2.48756% Day Change: 0.14 | |
| Week Change: -3.32922% Year-to-date Change: -17.2% | |
| ASUR Links: Profile News Message Board | |
| Charts:- Daily , Weekly | |
| Add ASUR to Watchlist: View: Get Complete ASUR Trend Analysis ➞ | |
 | GCI Gannett Co Inc |
| Sector: Technology | |
| SubSector: Publishing | |
| MarketCap: 628.99 Millions | |
| Recent Price: 4.27 Smart Investing & Trading Score: 80 | |
| Day Percent Change: -2.51142% Day Change: 0.11 | |
| Week Change: 4.14634% Year-to-date Change: -15.8% | |
| GCI Links: Profile News Message Board | |
| Charts:- Daily , Weekly | |
| Add GCI to Watchlist: View: Get Complete GCI Trend Analysis ➞ | |
 | SCSC Scansource, Inc |
| Sector: Technology | |
| SubSector: Electronics & Computer Distribution | |
| MarketCap: 983.05 Millions | |
| Recent Price: 43.94 Smart Investing & Trading Score: 40 | |
| Day Percent Change: -2.50721% Day Change: -2.62 | |
| Week Change: 1.6659% Year-to-date Change: -6.6% | |
| SCSC Links: Profile News Message Board | |
| Charts:- Daily , Weekly | |
| Add SCSC to Watchlist: View: Get Complete SCSC Trend Analysis ➞ | |
| For tabular summary view of above stock list: Summary View ➞ 0 - 25 , 25 - 50 , 50 - 75 , 75 - 100 , 100 - 125 , 125 - 150 , 150 - 175 , 175 - 200 , 200 - 225 , 225 - 250 , 250 - 275 , 275 - 300 , 300 - 325 , 325 - 350 , 350 - 375 , 375 - 400 , 400 - 425 , 425 - 450 , 450 - 475 , 475 - 500 , 500 - 525 , 525 - 550 , 550 - 575 , 575 - 600 , 600 - 625 , 625 - 650 , 650 - 675 , 675 - 700 , 700 - 725 , 725 - 750 , 750 - 775 , 775 - 800 , 800 - 825 , 825 - 850 , 850 - 875 , 875 - 900 | ||
| Click To Change The Sort Order: By Market Cap or Company Size Performance: Year-to-date, Week and Day | |
| Select Chart Type: | ||
|
Best Stocks Today 12Stocks.com |
© 2025 12Stocks.com Terms & Conditions Privacy Contact Us
All Information Provided Only For Education And Not To Be Used For Investing or Trading. See Terms & Conditions


One More Thing ... Get Best Stocks Delivered Daily!
Never Ever Miss A Move With Our Top Ten Stocks Lists
Find Best Stocks In Any Market - Bull or Bear Market
Take A Peek At Our Top Ten Stocks Lists: Daily, Weekly, Year-to-Date & Top Trends
Find Best Stocks In Any Market - Bull or Bear Market
Take A Peek At Our Top Ten Stocks Lists: Daily, Weekly, Year-to-Date & Top Trends
Technology Stocks With Best Up Trends [0-bearish to 100-bullish]: Sony [100], Intel Corp[100], D-Wave Quantum[100], Lyft [100], Xunlei [100], Bandwidth [100], Rigetti Computing[100], Veritone [100], Parsons Corp[100], Lightpath [100], ACM Research[100]
Best Technology Stocks Year-to-Date:
Pagaya [335.618%], Sify [306.863%], Xunlei [288.571%], Viasat [225.88%], CommScope Holding[215.891%], EchoStar Corp[215.648%], CuriosityStream [208.675%], Digital Turbine[194.886%], Oneconnect Financial[194.239%], nLIGHT [183.846%], Celestica [166.101%] Best Technology Stocks This Week:
GTT [443626%], Barracuda Networks[71050%], Mobile TeleSystems[10483.5%], Nam Tai[5033.33%], Ebix [4200.85%], Fang [4150%], NantHealth [3114.02%], Hemisphere Media[2981.82%], Yandex N.V[2935.27%], Castlight Health[1751.96%], Benefitfocus [1254.48%] Best Technology Stocks Daily:
Sony [194.565%], Intel Corp[24.7791%], D-Wave Quantum[18.7566%], Latch [16.6667%], Oclaro [14.734%], Lyft [13.0693%], Xunlei [11.6279%], Bandwidth [10.7143%], Crowdstrike [10.321%], Rigetti Computing[9.95%], Veritone [9.91957%]