
 Login Sign Up


| |||||
 |  | ||||

| 12Stocks.com Market Intelligence |
Best SmallCap Stocks
|
| In a hurry? Small Cap Stock Lists: Performance Trends Table, Stock Charts
Sort Small Cap stocks: Daily, Weekly, Year-to-Date, Market Cap & Trends. Filter Small Cap stocks list by sector: Show all, Tech, Finance, Energy, Staples, Retail, Industrial, Materials, Utilities and HealthCare Filter Small Cap stocks list by size: All Large Medium Small and MicroCap |
| 12Stocks.com Small Cap Stocks Performances & Trends Daily | |||||||||
|
|  The overall Smart Investing & Trading Score is 23 (0-bearish to 100-bullish) which puts Small Cap index in short term bearish to neutral trend. The Smart Investing & Trading Score from previous trading session is 13 and hence an improvement of trend.
| ||||||||
Here are the Smart Investing & Trading Scores of the most requested small cap stocks at 12Stocks.com (click stock name for detailed review):
|


| 12Stocks.com: Investing in Smallcap Index with Stocks | |
|
The following table helps investors and traders sort through current performance and trends (as measured by Smart Investing & Trading Score) of various
stocks in the Smallcap Index. Quick View: Move mouse or cursor over stock symbol (ticker) to view short-term technical chart and over stock name to view long term chart. Click on  to add stock symbol to your watchlist and to add stock symbol to your watchlist and  to view watchlist. Click on any ticker or stock name for detailed market intelligence report for that stock. to view watchlist. Click on any ticker or stock name for detailed market intelligence report for that stock. |
12Stocks.com Performance of Stocks in Smallcap Index
| Ticker | Stock Name | Watchlist | Category | Recent Price | Smart Investing & Trading Score | Change % | YTD Change% |
| DOOR | Masonite |   | Industrials | 131.39 | 83 | 0.03% | 55.20% |
| KGS | Kodiak Gas | | Energy | 26.61 | 61 | 1.80% | 33.18% |
| FCPT | Four Corners | | Financials | 22.66 | 17 | 0.40% | -10.43% |
| ICFI | ICF | | Services & Goods | 138.09 | 13 | -1.41% | 2.98% |
| AMRX | Amneal | | Health Care | 5.36 | 10 | -1.83% | -11.70% |
| MTSI | MACOM | | Technology | 95.16 | 34 | -1.28% | 2.38% |
| DRQ | Dril-Quip | | Energy | 19.45 | 0 | -2.06% | -16.42% |
| LILAK | Liberty Latin | | Technology | 7.20 | 68 | 0.00% | -1.91% |
| BECN | Beacon Roofing | | Industrials | 93.42 | 36 | 0.26% | 7.35% |
| SANA | Sana | | Health Care | 7.87 | 31 | -4.78% | 90.33% |
| ABG | Asbury Automotive | | Services & Goods | 211.49 | 26 | -0.18% | -5.99% |
| TCBI | Texas Capital | | Financials | 55.98 | 10 | 0.11% | -13.38% |
| SPWR | SunPower | | Technology | 2.26 | 20 | -2.16% | -53.21% |
| EIG | Employers | | Financials | 43.10 | 58 | 1.46% | 9.39% |
| SMCI | Super Micro | | Technology | 928.48 | 63 | -3.29% | 226.63% |
| IE | Ivanhoe Electric | | Materials | 10.80 | 93 | 3.95% | 6.56% |
| VERV | Verve | | Health Care | 6.78 | 17 | 0.59% | -51.42% |
| EDIT | Editas Medicine | | Health Care | 5.55 | 10 | -1.07% | -45.21% |
| IRBT | iRobot | | Consumer Staples | 7.25 | 10 | 3.13% | -81.27% |
| IIPR | Innovative Industrial | | Financials | 93.88 | 23 | 0.28% | -6.88% |
| WSFS | WSFS Financial | | Financials | 41.85 | 20 | 0.26% | -8.88% |
| NRC | National Research | | Health Care | 32.87 | 10 | -1.35% | -16.91% |
| ONTO | Onto Innovation | | Technology | 177.63 | 26 | -2.37% | 16.17% |
| BANR | Banner | | Financials | 43.73 | 35 | 1.34% | -18.35% |
| WW | WW | | Services & Goods | 1.82 | 35 | 2.25% | -79.20% |


| Too many stocks? View smallcap stocks filtered by marketcap & sector |
| Marketcap: All SmallCap Stocks (default-no microcap), Large, Mid-Range, Small |
| Smallcap Sector: Tech, Finance, Energy, Staples, Retail, Industrial, Materials, & Medical |
|
Get the most comprehensive stock market coverage daily at 12Stocks.com ➞ Best Stocks Today ➞ Best Stocks Weekly ➞ Best Stocks Year-to-Date ➞ Best Stocks Trends ➞  Best Stocks Today 12Stocks.com Best Nasdaq Stocks ➞ Best S&P 500 Stocks ➞ Best Tech Stocks ➞ Best Biotech Stocks ➞ |
| Detailed Overview of SmallCap Stocks |
| SmallCap Technical Overview, Leaders & Laggards, Top SmallCap ETF Funds & Detailed SmallCap Stocks List, Charts, Trends & More |
| Smallcap: Technical Analysis, Trends & YTD Performance | |
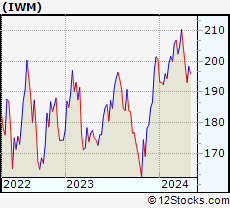
| SmallCap segment as represented by
IWM, an exchange-traded fund [ETF], holds basket of thousands of smallcap stocks from across all major sectors of the US stock market. The smallcap index (contains stocks like Riverbed & Sotheby's) is down by -3.92% and is currently underperforming the overall market by -8.11% year-to-date. Below is a quick view of technical charts and trends: | |
 IWM Weekly Chart |
|
| Long Term Trend: Not Good | |
| Medium Term Trend: Not Good | |
 IWM Daily Chart |
|
| Short Term Trend: Not Good | |
| Overall Trend Score: 23 | |
| YTD Performance: -3.92% | |
| **Trend Scores & Views Are Only For Educational Purposes And Not For Investing | |
| 12Stocks.com: Top Performing Small Cap Index Stocks | ||||||||||||||||||||||||||||||||||||||||||||||||
 The top performing Small Cap Index stocks year to date are
Now, more recently, over last week, the top performing Small Cap Index stocks on the move are


|
||||||||||||||||||||||||||||||||||||||||||||||||
| 12Stocks.com: Investing in Smallcap Index using Exchange Traded Funds | |
|
The following table shows list of key exchange traded funds (ETF) that
help investors track Smallcap index. The following list also includes leveraged ETF funds that track twice or thrice the daily returns of Smallcap indices. Short or inverse ETF funds move in the opposite direction to the index they track and are useful during market pullbacks or during bear markets. Quick View: Move mouse or cursor over ETF symbol (ticker) to view short-term technical chart and over ETF name to view long term chart. Click on ticker or stock name for detailed view. Click on to add stock symbol to your watchlist and to view watchlist. |
12Stocks.com List of ETFs that track Smallcap Index
| Ticker | ETF Name | Watchlist | Recent Price | Smart Investing & Trading Score | Change % | Week % | Year-to-date % |
| IWM | iShares Russell 2000 | | 192.84 | 23 | -0.08 | -2.94 | -3.92% |
| IJR | iShares Core S&P Small-Cap | | 102.34 | 10 | 0.21 | -2.08 | -5.46% |
| VTWO | Vanguard Russell 2000 ETF | | 77.95 | 23 | -0.13 | -2.95 | -3.88% |
| IWN | iShares Russell 2000 Value | | 146.33 | 10 | 0.21 | -2.69 | -5.79% |
| IJS | iShares S&P Small-Cap 600 Value | | 94.51 | 18 | 0.41 | -1.73 | -8.31% |
| IWO | iShares Russell 2000 Growth | | 246.94 | 36 | -0.44 | -3.3 | -2.09% |
| IJT | iShares S&P Small-Cap 600 Growth | | 121.57 | 13 | -0.22 | -2.57 | -2.85% |
| XSLV | PowerShares S&P SmallCap Low Volatil ETF | | 41.65 | 25 | 0.56 | -1.05 | -5.66% |
| SAA | ProShares Ultra SmallCap600 | | 21.62 | 10 | -0.18 | -4.17 | -13.35% |
| SMLV | SPDR SSGA US Small Cap Low Volatil ETF | | 103.83 | 10 | 0.16 | -1.13 | -7.72% |
| SBB | ProShares Short SmallCap600 | | 16.98 | 100 | 0.77 | 2.62 | 6.59% |
| SDD | ProShares UltraShort SmallCap600 | | 20.69 | 95 | 0.44 | 4.33 | 12.28% |
| 12Stocks.com: Charts, Trends, Fundamental Data and Performances of SmallCap Stocks | |
|
We now take in-depth look at all SmallCap stocks including charts, multi-period performances and overall trends (as measured by Smart Investing & Trading Score). One can sort SmallCap stocks (click link to choose) by Daily, Weekly and by Year-to-Date performances. Also, one can sort by size of the company or by market capitalization. |
| Select Your Default Chart Type: | |||||
| |||||
| Click on stock symbol or name for detailed view. Click on to add stock symbol to your watchlist and to view watchlist. Quick View: Move mouse or cursor over "Daily" to quickly view daily technical stock chart and over "Weekly" to view weekly technical stock chart. | |||||

 | DOOR Masonite International Corporation |
| Sector: Industrials | |
| SubSector: General Building Materials | |
| MarketCap: 1220.53 Millions | |
| Recent Price: 131.39 Smart Investing & Trading Score: 83 | |
| Day Percent Change: 0.03% Day Change: 0.04 | |
| Week Change: 0.37% Year-to-date Change: 55.2% | |
| DOOR Links: Profile News Message Board | |
| Charts:- Daily , Weekly | |
| Add DOOR to Watchlist: View: Get Complete DOOR Trend Analysis ➞ | |
 | KGS Kodiak Gas Services, LLC |
| Sector: Energy | |
| SubSector: Oil & Gas Equipment & Services | |
| MarketCap: 1220 Millions | |
| Recent Price: 26.61 Smart Investing & Trading Score: 61 | |
| Day Percent Change: 1.80% Day Change: 0.47 | |
| Week Change: -1.19% Year-to-date Change: 33.2% | |
| KGS Links: Profile News Message Board | |
| Charts:- Daily , Weekly | |
| Add KGS to Watchlist: View: Get Complete KGS Trend Analysis ➞ | |
 | FCPT Four Corners Property Trust, Inc. |
| Sector: Financials | |
| SubSector: REIT - Hotel/Motel | |
| MarketCap: 1218.94 Millions | |
| Recent Price: 22.66 Smart Investing & Trading Score: 17 | |
| Day Percent Change: 0.40% Day Change: 0.09 | |
| Week Change: -2.91% Year-to-date Change: -10.4% | |
| FCPT Links: Profile News Message Board | |
| Charts:- Daily , Weekly | |
| Add FCPT to Watchlist: View: Get Complete FCPT Trend Analysis ➞ | |
 | ICFI ICF International, Inc. |
| Sector: Services & Goods | |
| SubSector: Management Services | |
| MarketCap: 1218.75 Millions | |
| Recent Price: 138.09 Smart Investing & Trading Score: 13 | |
| Day Percent Change: -1.41% Day Change: -1.98 | |
| Week Change: -3.87% Year-to-date Change: 3.0% | |
| ICFI Links: Profile News Message Board | |
| Charts:- Daily , Weekly | |
| Add ICFI to Watchlist: View: Get Complete ICFI Trend Analysis ➞ | |
 | AMRX Amneal Pharmaceuticals, Inc. |
| Sector: Health Care | |
| SubSector: Drug Related Products | |
| MarketCap: 1218.13 Millions | |
| Recent Price: 5.36 Smart Investing & Trading Score: 10 | |
| Day Percent Change: -1.83% Day Change: -0.10 | |
| Week Change: -2.9% Year-to-date Change: -11.7% | |
| AMRX Links: Profile News Message Board | |
| Charts:- Daily , Weekly | |
| Add AMRX to Watchlist: View: Get Complete AMRX Trend Analysis ➞ | |
 | MTSI MACOM Technology Solutions Holdings, Inc. |
| Sector: Technology | |
| SubSector: Semiconductor - Broad Line | |
| MarketCap: 1214.42 Millions | |
| Recent Price: 95.16 Smart Investing & Trading Score: 34 | |
| Day Percent Change: -1.28% Day Change: -1.23 | |
| Week Change: -3.29% Year-to-date Change: 2.4% | |
| MTSI Links: Profile News Message Board | |
| Charts:- Daily , Weekly | |
| Add MTSI to Watchlist: View: Get Complete MTSI Trend Analysis ➞ | |
 | DRQ Dril-Quip, Inc. |
| Sector: Energy | |
| SubSector: Oil & Gas Equipment & Services | |
| MarketCap: 1211.61 Millions | |
| Recent Price: 19.45 Smart Investing & Trading Score: 0 | |
| Day Percent Change: -2.06% Day Change: -0.41 | |
| Week Change: -10.33% Year-to-date Change: -16.4% | |
| DRQ Links: Profile News Message Board | |
| Charts:- Daily , Weekly | |
| Add DRQ to Watchlist: View: Get Complete DRQ Trend Analysis ➞ | |
 | LILAK Liberty Latin America Ltd. |
| Sector: Technology | |
| SubSector: CATV Systems | |
| MarketCap: 1210.32 Millions | |
| Recent Price: 7.20 Smart Investing & Trading Score: 68 | |
| Day Percent Change: 0.00% Day Change: 0.00 | |
| Week Change: -0.55% Year-to-date Change: -1.9% | |
| LILAK Links: Profile News Message Board | |
| Charts:- Daily , Weekly | |
| Add LILAK to Watchlist: View: Get Complete LILAK Trend Analysis ➞ | |
 | BECN Beacon Roofing Supply, Inc. |
| Sector: Industrials | |
| SubSector: General Building Materials | |
| MarketCap: 1210.13 Millions | |
| Recent Price: 93.42 Smart Investing & Trading Score: 36 | |
| Day Percent Change: 0.26% Day Change: 0.24 | |
| Week Change: -3.83% Year-to-date Change: 7.4% | |
| BECN Links: Profile News Message Board | |
| Charts:- Daily , Weekly | |
| Add BECN to Watchlist: View: Get Complete BECN Trend Analysis ➞ | |
 | SANA Sana Biotechnology, Inc. |
| Sector: Health Care | |
| SubSector: Biotechnology | |
| MarketCap: 1210 Millions | |
| Recent Price: 7.87 Smart Investing & Trading Score: 31 | |
| Day Percent Change: -4.78% Day Change: -0.40 | |
| Week Change: -12.17% Year-to-date Change: 90.3% | |
| SANA Links: Profile News Message Board | |
| Charts:- Daily , Weekly | |
| Add SANA to Watchlist: View: Get Complete SANA Trend Analysis ➞ | |
 | ABG Asbury Automotive Group, Inc. |
| Sector: Services & Goods | |
| SubSector: Auto Dealerships | |
| MarketCap: 1203.21 Millions | |
| Recent Price: 211.49 Smart Investing & Trading Score: 26 | |
| Day Percent Change: -0.18% Day Change: -0.38 | |
| Week Change: -2.77% Year-to-date Change: -6.0% | |
| ABG Links: Profile News Message Board | |
| Charts:- Daily , Weekly | |
| Add ABG to Watchlist: View: Get Complete ABG Trend Analysis ➞ | |
 | TCBI Texas Capital Bancshares, Inc. |
| Sector: Financials | |
| SubSector: Regional - Southwest Banks | |
| MarketCap: 1202.75 Millions | |
| Recent Price: 55.98 Smart Investing & Trading Score: 10 | |
| Day Percent Change: 0.11% Day Change: 0.06 | |
| Week Change: -0.96% Year-to-date Change: -13.4% | |
| TCBI Links: Profile News Message Board | |
| Charts:- Daily , Weekly | |
| Add TCBI to Watchlist: View: Get Complete TCBI Trend Analysis ➞ | |
 | SPWR SunPower Corporation |
| Sector: Technology | |
| SubSector: Semiconductor - Specialized | |
| MarketCap: 1202.6 Millions | |
| Recent Price: 2.26 Smart Investing & Trading Score: 20 | |
| Day Percent Change: -2.16% Day Change: -0.05 | |
| Week Change: -8.87% Year-to-date Change: -53.2% | |
| SPWR Links: Profile News Message Board | |
| Charts:- Daily , Weekly | |
| Add SPWR to Watchlist: View: Get Complete SPWR Trend Analysis ➞ | |
 | EIG Employers Holdings, Inc. |
| Sector: Financials | |
| SubSector: Accident & Health Insurance | |
| MarketCap: 1202.6 Millions | |
| Recent Price: 43.10 Smart Investing & Trading Score: 58 | |
| Day Percent Change: 1.46% Day Change: 0.62 | |
| Week Change: 1.15% Year-to-date Change: 9.4% | |
| EIG Links: Profile News Message Board | |
| Charts:- Daily , Weekly | |
| Add EIG to Watchlist: View: Get Complete EIG Trend Analysis ➞ | |
 | SMCI Super Micro Computer, Inc. |
| Sector: Technology | |
| SubSector: Networking & Communication Devices | |
| MarketCap: 1200.02 Millions | |
| Recent Price: 928.48 Smart Investing & Trading Score: 63 | |
| Day Percent Change: -3.29% Day Change: -31.60 | |
| Week Change: 3.34% Year-to-date Change: 226.6% | |
| SMCI Links: Profile News Message Board | |
| Charts:- Daily , Weekly | |
| Add SMCI to Watchlist: View: Get Complete SMCI Trend Analysis ➞ | |
 | IE Ivanhoe Electric Inc. |
| Sector: Materials | |
| SubSector: Copper | |
| MarketCap: 1200 Millions | |
| Recent Price: 10.80 Smart Investing & Trading Score: 93 | |
| Day Percent Change: 3.95% Day Change: 0.41 | |
| Week Change: 3.25% Year-to-date Change: 6.6% | |
| IE Links: Profile News Message Board | |
| Charts:- Daily , Weekly | |
| Add IE to Watchlist: View: Get Complete IE Trend Analysis ➞ | |
 | VERV Verve Therapeutics, Inc. |
| Sector: Health Care | |
| SubSector: Biotechnology | |
| MarketCap: 1200 Millions | |
| Recent Price: 6.78 Smart Investing & Trading Score: 17 | |
| Day Percent Change: 0.59% Day Change: 0.04 | |
| Week Change: -10.79% Year-to-date Change: -51.4% | |
| VERV Links: Profile News Message Board | |
| Charts:- Daily , Weekly | |
| Add VERV to Watchlist: View: Get Complete VERV Trend Analysis ➞ | |
 | EDIT Editas Medicine, Inc. |
| Sector: Health Care | |
| SubSector: Biotechnology | |
| MarketCap: 1194.95 Millions | |
| Recent Price: 5.55 Smart Investing & Trading Score: 10 | |
| Day Percent Change: -1.07% Day Change: -0.06 | |
| Week Change: -10.63% Year-to-date Change: -45.2% | |
| EDIT Links: Profile News Message Board | |
| Charts:- Daily , Weekly | |
| Add EDIT to Watchlist: View: Get Complete EDIT Trend Analysis ➞ | |
 | IRBT iRobot Corporation |
| Sector: Consumer Staples | |
| SubSector: Appliances | |
| MarketCap: 1193.38 Millions | |
| Recent Price: 7.25 Smart Investing & Trading Score: 10 | |
| Day Percent Change: 3.13% Day Change: 0.22 | |
| Week Change: -7.64% Year-to-date Change: -81.3% | |
| IRBT Links: Profile News Message Board | |
| Charts:- Daily , Weekly | |
| Add IRBT to Watchlist: View: Get Complete IRBT Trend Analysis ➞ | |
 | IIPR Innovative Industrial Properties, Inc. |
| Sector: Financials | |
| SubSector: REIT - Industrial | |
| MarketCap: 1193.29 Millions | |
| Recent Price: 93.88 Smart Investing & Trading Score: 23 | |
| Day Percent Change: 0.28% Day Change: 0.26 | |
| Week Change: -4.5% Year-to-date Change: -6.9% | |
| IIPR Links: Profile News Message Board | |
| Charts:- Daily , Weekly | |
| Add IIPR to Watchlist: View: Get Complete IIPR Trend Analysis ➞ | |
 | WSFS WSFS Financial Corporation |
| Sector: Financials | |
| SubSector: Regional - Mid-Atlantic Banks | |
| MarketCap: 1191.29 Millions | |
| Recent Price: 41.85 Smart Investing & Trading Score: 20 | |
| Day Percent Change: 0.26% Day Change: 0.11 | |
| Week Change: -2.11% Year-to-date Change: -8.9% | |
| WSFS Links: Profile News Message Board | |
| Charts:- Daily , Weekly | |
| Add WSFS to Watchlist: View: Get Complete WSFS Trend Analysis ➞ | |
 | NRC National Research Corporation |
| Sector: Health Care | |
| SubSector: Medical Laboratories & Research | |
| MarketCap: 1187.7 Millions | |
| Recent Price: 32.87 Smart Investing & Trading Score: 10 | |
| Day Percent Change: -1.35% Day Change: -0.45 | |
| Week Change: -3.61% Year-to-date Change: -16.9% | |
| NRC Links: Profile News Message Board | |
| Charts:- Daily , Weekly | |
| Add NRC to Watchlist: View: Get Complete NRC Trend Analysis ➞ | |
 | ONTO Onto Innovation Inc. |
| Sector: Technology | |
| SubSector: Semiconductor Equipment & Materials | |
| MarketCap: 1187.18 Millions | |
| Recent Price: 177.63 Smart Investing & Trading Score: 26 | |
| Day Percent Change: -2.37% Day Change: -4.31 | |
| Week Change: -3.52% Year-to-date Change: 16.2% | |
| ONTO Links: Profile News Message Board | |
| Charts:- Daily , Weekly | |
| Add ONTO to Watchlist: View: Get Complete ONTO Trend Analysis ➞ | |
 | BANR Banner Corporation |
| Sector: Financials | |
| SubSector: Regional - Mid-Atlantic Banks | |
| MarketCap: 1187.09 Millions | |
| Recent Price: 43.73 Smart Investing & Trading Score: 35 | |
| Day Percent Change: 1.34% Day Change: 0.58 | |
| Week Change: -0.43% Year-to-date Change: -18.4% | |
| BANR Links: Profile News Message Board | |
| Charts:- Daily , Weekly | |
| Add BANR to Watchlist: View: Get Complete BANR Trend Analysis ➞ | |
 | WW WW International, Inc. |
| Sector: Services & Goods | |
| SubSector: Personal Services | |
| MarketCap: 1186.25 Millions | |
| Recent Price: 1.82 Smart Investing & Trading Score: 35 | |
| Day Percent Change: 2.25% Day Change: 0.04 | |
| Week Change: 1.11% Year-to-date Change: -79.2% | |
| WW Links: Profile News Message Board | |
| Charts:- Daily , Weekly | |
| Add WW to Watchlist: View: Get Complete WW Trend Analysis ➞ | |
| Too many stocks? View smallcap stocks filtered by marketcap & sector |
| Marketcap: All SmallCap Stocks (default-no microcap), Large, Mid-Range, Small & MicroCap |
| Sector: Tech, Finance, Energy, Staples, Retail, Industrial, Materials, Utilities & Medical |
|
Best Stocks Today 12Stocks.com |
© 2024 12Stocks.com Terms & Conditions Privacy Contact Us
All Information Provided Only For Education And Not To Be Used For Investing or Trading. See Terms & Conditions


One More Thing ... Get Best Stocks Delivered Daily!
Never Ever Miss A Move With Our Top Ten Stocks Lists
Find Best Stocks In Any Market - Bull or Bear Market
Take A Peek At Our Top Ten Stocks Lists: Daily, Weekly, Year-to-Date & Top Trends
Find Best Stocks In Any Market - Bull or Bear Market
Take A Peek At Our Top Ten Stocks Lists: Daily, Weekly, Year-to-Date & Top Trends
Smallcap Stocks With Best Up Trends [0-bearish to 100-bullish]: Badger Meter[100], Cullinan Oncology[100], Oscar Health[100], NextNav [100], EchoStar [100], Victory Capital[100], Macatawa Bank[100], IMAX [100], Envestnet [100], ALX Oncology[100], Argan [95]
Best Smallcap Stocks Year-to-Date:
Agenus [500.31%], CareMax [417.53%], Janux [348.12%], Viking [247.5%], Alpine Immune[238.5%], Super Micro[226.63%], Longboard [194.76%], Arcutis Bio[192.57%], Vera [161.3%], Avidity Biosciences[154.87%], Hippo [128.32%] Best Smallcap Stocks This Week:
Macatawa Bank[44.42%], 23andMe Holding[33.3%], ProKidney [32%], Snap One[29.73%], Vertex Energy[25.96%], ALX Oncology[20.64%], Vanda [20.63%], Expensify [18.37%], Badger Meter[16.72%], ContextLogic [15%], Cullinan Oncology[13.89%] Best Smallcap Stocks Daily:
23andMe Holding[65.91%], Vertex Energy[33.78%], Zura Bio[17.20%], Badger Meter[16.65%], ContextLogic [15.81%], Expensify [15.23%], Montrose Environmental[12.84%], Vaxxinity [10.05%], Cipher Mining[8.65%], FiscalNote [8.61%], Vuzix [8.15%]