
 Login Sign Up


| |||||
 |  | ||||

| 12Stocks.com Market Intelligence |
Best SmallCap Stocks
|
| In a hurry? Small Cap Stock Lists: Performance Trends Table, Stock Charts
Sort Small Cap stocks: Daily, Weekly, Year-to-Date, Market Cap & Trends. Filter Small Cap stocks list by sector: Show all, Tech, Finance, Energy, Staples, Retail, Industrial, Materials, Utilities and HealthCare Filter Small Cap stocks list by size: All Large Medium Small and MicroCap |
| 12Stocks.com Small Cap Stocks Performances & Trends Daily | |||||||||
|
|  The overall Smart Investing & Trading Score is 13 (0-bearish to 100-bullish) which puts Small Cap index in short term bearish trend. The Smart Investing & Trading Score from previous trading session is 26 and hence a deterioration of trend.
| ||||||||
Here are the Smart Investing & Trading Scores of the most requested small cap stocks at 12Stocks.com (click stock name for detailed review):
|


| 12Stocks.com: Investing in Smallcap Index with Stocks | |
|
The following table helps investors and traders sort through current performance and trends (as measured by Smart Investing & Trading Score) of various
stocks in the Smallcap Index. Quick View: Move mouse or cursor over stock symbol (ticker) to view short-term technical chart and over stock name to view long term chart. Click on  to add stock symbol to your watchlist and to add stock symbol to your watchlist and  to view watchlist. Click on any ticker or stock name for detailed market intelligence report for that stock. to view watchlist. Click on any ticker or stock name for detailed market intelligence report for that stock. |
12Stocks.com Performance of Stocks in Smallcap Index
| Ticker | Stock Name | Watchlist | Category | Recent Price | Smart Investing & Trading Score | Change % | YTD Change% |
| DHX | DHI Group |   | Services & Goods | 2.30 | 42 | 0.00% | -11.20% |
| LQDT | Liquidity Services | | Services & Goods | 16.90 | 0 | 0.00% | -1.80% |
| CUTR | Cutera | | Health Care | 2.45 | 69 | 2.94% | -30.50% |
| BWFG | Bankwell Financial | | Financials | 23.46 | 17 | 0.00% | -22.27% |
| CHMG | Chemung Financial | | Financials | 39.80 | 35 | 0.00% | -20.08% |
| FSBW | FS Bancorp | | Financials | 30.89 | 0 | 0.00% | -16.42% |
| UEC | Uranium Energy | | Materials | 6.95 | 22 | 1.02% | 8.59% |
| CLFD | Clearfield | | Technology | 28.38 | 36 | 0.46% | -2.41% |
| KALV | KalVista | | Health Care | 11.53 | 17 | -1.03% | -5.88% |
| SM | SM Energy | | Energy | 49.08 | 36 | -0.43% | 26.76% |
| RCKY | Rocky Brands | | Consumer Staples | 26.84 | 45 | 0.86% | -11.07% |
| PTSI | P.A.M. Transportation | | Transports | 14.07 | 10 | -2.02% | -32.29% |
| MG | Mistras Group | | Services & Goods | 9.06 | 58 | -0.44% | 23.77% |
| INFU | InfuSystem | | Health Care | 7.91 | 17 | 0.51% | -24.95% |
| ARL | American Realty | | Financials | 16.00 | 17 | 3.13% | -8.07% |
| PLSE | Pulse Biosciences | | Health Care | 7.37 | 39 | -1.34% | -39.79% |
| SHBI | Shore Bancshares | | Financials | 10.16 | 0 | 0.84% | -28.67% |
| OIS | Oil States | | Energy | 5.49 | 0 | 1.29% | -19.15% |
| GDEN | Golden Entertainment | | Services & Goods | 33.33 | 10 | -0.48% | -16.53% |
| IDT | IDT | | Technology | 35.80 | 26 | 0.08% | 5.02% |
| ITI | Iteris | | Technology | 4.63 | 10 | -0.22% | -10.96% |
| WKHS | Workhorse Group | | Consumer Staples | 0.17 | 10 | -4.23% | -54.06% |
| TLYS | Tilly s | | Services & Goods | 5.41 | 0 | -0.55% | -28.25% |
| NL | NL Industries | | Services & Goods | 7.86 | 51 | 1.55% | 40.11% |
| JYNT | Joint | | Health Care | 11.91 | 53 | -0.87% | 23.99% |
| For chart view version of above stock list: Chart View ➞ 0 - 25 , 25 - 50 , 50 - 75 , 75 - 100 , 100 - 125 , 125 - 150 , 150 - 175 , 175 - 200 , 200 - 225 , 225 - 250 , 250 - 275 , 275 - 300 , 300 - 325 , 325 - 350 , 350 - 375 , 375 - 400 , 400 - 425 , 425 - 450 , 450 - 475 , 475 - 500 , 500 - 525 , 525 - 550 , 550 - 575 , 575 - 600 , 600 - 625 , 625 - 650 , 650 - 675 , 675 - 700 , 700 - 725 , 725 - 750 , 750 - 775 , 775 - 800 , 800 - 825 , 825 - 850 , 850 - 875 , 875 - 900 , 900 - 925 , 925 - 950 , 950 - 975 , 975 - 1000 , 1000 - 1025 , 1025 - 1050 , 1050 - 1075 , 1075 - 1100 , 1100 - 1125 , 1125 - 1150 , 1150 - 1175 , 1175 - 1200 , 1200 - 1225 , 1225 - 1250 , 1250 - 1275 , 1275 - 1300 , 1300 - 1325 , 1325 - 1350 , 1350 - 1375 , 1375 - 1400 , 1400 - 1425 , 1425 - 1450 , 1450 - 1475 | ||
 | Click To Change The Sort Order: By Market Cap or Company Size Performance: Year-to-date, Week and Day |  |
| Too many stocks? View smallcap stocks filtered by marketcap & sector |
| Marketcap: All SmallCap Stocks (default-no microcap), Large, Mid-Range, Small |
| Smallcap Sector: Tech, Finance, Energy, Staples, Retail, Industrial, Materials, & Medical |
|
Get the most comprehensive stock market coverage daily at 12Stocks.com ➞ Best Stocks Today ➞ Best Stocks Weekly ➞ Best Stocks Year-to-Date ➞ Best Stocks Trends ➞  Best Stocks Today 12Stocks.com Best Nasdaq Stocks ➞ Best S&P 500 Stocks ➞ Best Tech Stocks ➞ Best Biotech Stocks ➞ |
| Detailed Overview of SmallCap Stocks |
| SmallCap Technical Overview, Leaders & Laggards, Top SmallCap ETF Funds & Detailed SmallCap Stocks List, Charts, Trends & More |
| Smallcap: Technical Analysis, Trends & YTD Performance | |
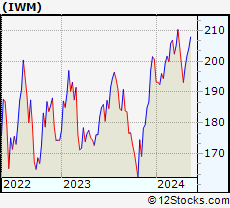
| SmallCap segment as represented by
IWM, an exchange-traded fund [ETF], holds basket of thousands of smallcap stocks from across all major sectors of the US stock market. The smallcap index (contains stocks like Riverbed & Sotheby's) is down by -3.56% and is currently underperforming the overall market by -8.11% year-to-date. Below is a quick view of technical charts and trends: | |
 IWM Weekly Chart |
|
| Long Term Trend: Good | |
| Medium Term Trend: Not Good | |
 IWM Daily Chart |
|
| Short Term Trend: Not Good | |
| Overall Trend Score: 13 | |
| YTD Performance: -3.56% | |
| **Trend Scores & Views Are Only For Educational Purposes And Not For Investing | |
| 12Stocks.com: Top Performing Small Cap Index Stocks | ||||||||||||||||||||||||||||||||||||||||||||||||
 The top performing Small Cap Index stocks year to date are
Now, more recently, over last week, the top performing Small Cap Index stocks on the move are


|
||||||||||||||||||||||||||||||||||||||||||||||||
| 12Stocks.com: Investing in Smallcap Index using Exchange Traded Funds | |
|
The following table shows list of key exchange traded funds (ETF) that
help investors track Smallcap index. The following list also includes leveraged ETF funds that track twice or thrice the daily returns of Smallcap indices. Short or inverse ETF funds move in the opposite direction to the index they track and are useful during market pullbacks or during bear markets. Quick View: Move mouse or cursor over ETF symbol (ticker) to view short-term technical chart and over ETF name to view long term chart. Click on ticker or stock name for detailed view. Click on to add stock symbol to your watchlist and to view watchlist. |
12Stocks.com List of ETFs that track Smallcap Index
| Ticker | ETF Name | Watchlist | Recent Price | Smart Investing & Trading Score | Change % | Week % | Year-to-date % |
| IWM | iShares Russell 2000 | | 193.56 | 13 | 0.29 | -2.58 | -3.56% |
| IJR | iShares Core S&P Small-Cap | | 102.65 | 7 | 0.51 | -1.78 | -5.17% |
| IWN | iShares Russell 2000 Value | | 146.73 | 0 | 0.48 | -2.43 | -5.54% |
| IWO | iShares Russell 2000 Growth | | 248.39 | 26 | 0.15 | -2.73 | -1.52% |
| IJS | iShares S&P Small-Cap 600 Value | | 94.21 | 7 | 0.10 | -2.04 | -8.6% |
| XSLV | PowerShares S&P SmallCap Low Volatil ETF | | 41.58 | 0 | 0.39 | -1.21 | -5.82% |
| 12Stocks.com: Charts, Trends, Fundamental Data and Performances of SmallCap Stocks | |
|
We now take in-depth look at all SmallCap stocks including charts, multi-period performances and overall trends (as measured by Smart Investing & Trading Score). One can sort SmallCap stocks (click link to choose) by Daily, Weekly and by Year-to-Date performances. Also, one can sort by size of the company or by market capitalization. |
| Select Your Default Chart Type: | |||||
| |||||
| Click on stock symbol or name for detailed view. Click on to add stock symbol to your watchlist and to view watchlist. Quick View: Move mouse or cursor over "Daily" to quickly view daily technical stock chart and over "Weekly" to view weekly technical stock chart. | |||||

 | DHX DHI Group, Inc. |
| Sector: Services & Goods | |
| SubSector: Staffing & Outsourcing Services | |
| MarketCap: 144.728 Millions | |
| Recent Price: 2.30 Smart Investing & Trading Score: 42 | |
| Day Percent Change: 0.00% Day Change: 0.00 | |
| Week Change: 1.32% Year-to-date Change: -11.2% | |
| DHX Links: Profile News Message Board | |
| Charts:- Daily , Weekly | |
| Add DHX to Watchlist: View: Get Complete DHX Trend Analysis ➞ | |
 | LQDT Liquidity Services, Inc. |
| Sector: Services & Goods | |
| SubSector: Catalog & Mail Order Houses | |
| MarketCap: 144.492 Millions | |
| Recent Price: 16.90 Smart Investing & Trading Score: 0 | |
| Day Percent Change: 0.00% Day Change: 0.00 | |
| Week Change: -5.64% Year-to-date Change: -1.8% | |
| LQDT Links: Profile News Message Board | |
| Charts:- Daily , Weekly | |
| Add LQDT to Watchlist: View: Get Complete LQDT Trend Analysis ➞ | |
 | CUTR Cutera, Inc. |
| Sector: Health Care | |
| SubSector: Medical Appliances & Equipment | |
| MarketCap: 143.68 Millions | |
| Recent Price: 2.45 Smart Investing & Trading Score: 69 | |
| Day Percent Change: 2.94% Day Change: 0.07 | |
| Week Change: 10.86% Year-to-date Change: -30.5% | |
| CUTR Links: Profile News Message Board | |
| Charts:- Daily , Weekly | |
| Add CUTR to Watchlist: View: Get Complete CUTR Trend Analysis ➞ | |
 | BWFG Bankwell Financial Group, Inc. |
| Sector: Financials | |
| SubSector: Regional - Northeast Banks | |
| MarketCap: 142.899 Millions | |
| Recent Price: 23.46 Smart Investing & Trading Score: 17 | |
| Day Percent Change: 0.00% Day Change: 0.00 | |
| Week Change: -2.64% Year-to-date Change: -22.3% | |
| BWFG Links: Profile News Message Board | |
| Charts:- Daily , Weekly | |
| Add BWFG to Watchlist: View: Get Complete BWFG Trend Analysis ➞ | |
 | CHMG Chemung Financial Corporation |
| Sector: Financials | |
| SubSector: Regional - Pacific Banks | |
| MarketCap: 142.229 Millions | |
| Recent Price: 39.80 Smart Investing & Trading Score: 35 | |
| Day Percent Change: 0.00% Day Change: 0.00 | |
| Week Change: 0.73% Year-to-date Change: -20.1% | |
| CHMG Links: Profile News Message Board | |
| Charts:- Daily , Weekly | |
| Add CHMG to Watchlist: View: Get Complete CHMG Trend Analysis ➞ | |
 | FSBW FS Bancorp, Inc. |
| Sector: Financials | |
| SubSector: Regional - Pacific Banks | |
| MarketCap: 140.429 Millions | |
| Recent Price: 30.89 Smart Investing & Trading Score: 0 | |
| Day Percent Change: 0.00% Day Change: 0.00 | |
| Week Change: -3.26% Year-to-date Change: -16.4% | |
| FSBW Links: Profile News Message Board | |
| Charts:- Daily , Weekly | |
| Add FSBW to Watchlist: View: Get Complete FSBW Trend Analysis ➞ | |
 | UEC Uranium Energy Corp. |
| Sector: Materials | |
| SubSector: Industrial Metals & Minerals | |
| MarketCap: 138.91 Millions | |
| Recent Price: 6.95 Smart Investing & Trading Score: 22 | |
| Day Percent Change: 1.02% Day Change: 0.07 | |
| Week Change: -4.27% Year-to-date Change: 8.6% | |
| UEC Links: Profile News Message Board | |
| Charts:- Daily , Weekly | |
| Add UEC to Watchlist: View: Get Complete UEC Trend Analysis ➞ | |
 | CLFD Clearfield, Inc. |
| Sector: Technology | |
| SubSector: Communication Equipment | |
| MarketCap: 138.439 Millions | |
| Recent Price: 28.38 Smart Investing & Trading Score: 36 | |
| Day Percent Change: 0.46% Day Change: 0.13 | |
| Week Change: -6.06% Year-to-date Change: -2.4% | |
| CLFD Links: Profile News Message Board | |
| Charts:- Daily , Weekly | |
| Add CLFD to Watchlist: View: Get Complete CLFD Trend Analysis ➞ | |
 | KALV KalVista Pharmaceuticals, Inc. |
| Sector: Health Care | |
| SubSector: Biotechnology | |
| MarketCap: 138.385 Millions | |
| Recent Price: 11.53 Smart Investing & Trading Score: 17 | |
| Day Percent Change: -1.03% Day Change: -0.12 | |
| Week Change: -3.03% Year-to-date Change: -5.9% | |
| KALV Links: Profile News Message Board | |
| Charts:- Daily , Weekly | |
| Add KALV to Watchlist: View: Get Complete KALV Trend Analysis ➞ | |
 | SM SM Energy Company |
| Sector: Energy | |
| SubSector: Independent Oil & Gas | |
| MarketCap: 137.593 Millions | |
| Recent Price: 49.08 Smart Investing & Trading Score: 36 | |
| Day Percent Change: -0.43% Day Change: -0.21 | |
| Week Change: -3.25% Year-to-date Change: 26.8% | |
| SM Links: Profile News Message Board | |
| Charts:- Daily , Weekly | |
| Add SM to Watchlist: View: Get Complete SM Trend Analysis ➞ | |
 | RCKY Rocky Brands, Inc. |
| Sector: Consumer Staples | |
| SubSector: Textile - Apparel Footwear & Accessories | |
| MarketCap: 137.47 Millions | |
| Recent Price: 26.84 Smart Investing & Trading Score: 45 | |
| Day Percent Change: 0.86% Day Change: 0.23 | |
| Week Change: 1.24% Year-to-date Change: -11.1% | |
| RCKY Links: Profile News Message Board | |
| Charts:- Daily , Weekly | |
| Add RCKY to Watchlist: View: Get Complete RCKY Trend Analysis ➞ | |
 | PTSI P.A.M. Transportation Services, Inc. |
| Sector: Transports | |
| SubSector: Trucking | |
| MarketCap: 136.915 Millions | |
| Recent Price: 14.07 Smart Investing & Trading Score: 10 | |
| Day Percent Change: -2.02% Day Change: -0.29 | |
| Week Change: -4.67% Year-to-date Change: -32.3% | |
| PTSI Links: Profile News Message Board | |
| Charts:- Daily , Weekly | |
| Add PTSI to Watchlist: View: Get Complete PTSI Trend Analysis ➞ | |
 | MG Mistras Group, Inc. |
| Sector: Services & Goods | |
| SubSector: Security & Protection Services | |
| MarketCap: 136.903 Millions | |
| Recent Price: 9.06 Smart Investing & Trading Score: 58 | |
| Day Percent Change: -0.44% Day Change: -0.04 | |
| Week Change: 0.11% Year-to-date Change: 23.8% | |
| MG Links: Profile News Message Board | |
| Charts:- Daily , Weekly | |
| Add MG to Watchlist: View: Get Complete MG Trend Analysis ➞ | |
 | INFU InfuSystem Holdings Inc. |
| Sector: Health Care | |
| SubSector: Medical Instruments & Supplies | |
| MarketCap: 136.76 Millions | |
| Recent Price: 7.91 Smart Investing & Trading Score: 17 | |
| Day Percent Change: 0.51% Day Change: 0.04 | |
| Week Change: -1.62% Year-to-date Change: -25.0% | |
| INFU Links: Profile News Message Board | |
| Charts:- Daily , Weekly | |
| Add INFU to Watchlist: View: Get Complete INFU Trend Analysis ➞ | |
 | ARL American Realty Investors, Inc. |
| Sector: Financials | |
| SubSector: Property Management | |
| MarketCap: 132.242 Millions | |
| Recent Price: 16.00 Smart Investing & Trading Score: 17 | |
| Day Percent Change: 3.13% Day Change: 0.48 | |
| Week Change: 1.62% Year-to-date Change: -8.1% | |
| ARL Links: Profile News Message Board | |
| Charts:- Daily , Weekly | |
| Add ARL to Watchlist: View: Get Complete ARL Trend Analysis ➞ | |
 | PLSE Pulse Biosciences, Inc. |
| Sector: Health Care | |
| SubSector: Medical Instruments & Supplies | |
| MarketCap: 131.96 Millions | |
| Recent Price: 7.37 Smart Investing & Trading Score: 39 | |
| Day Percent Change: -1.34% Day Change: -0.10 | |
| Week Change: 2.08% Year-to-date Change: -39.8% | |
| PLSE Links: Profile News Message Board | |
| Charts:- Daily , Weekly | |
| Add PLSE to Watchlist: View: Get Complete PLSE Trend Analysis ➞ | |
 | SHBI Shore Bancshares, Inc. |
| Sector: Financials | |
| SubSector: Regional - Mid-Atlantic Banks | |
| MarketCap: 131.359 Millions | |
| Recent Price: 10.16 Smart Investing & Trading Score: 0 | |
| Day Percent Change: 0.84% Day Change: 0.08 | |
| Week Change: -1.88% Year-to-date Change: -28.7% | |
| SHBI Links: Profile News Message Board | |
| Charts:- Daily , Weekly | |
| Add SHBI to Watchlist: View: Get Complete SHBI Trend Analysis ➞ | |
 | OIS Oil States International, Inc. |
| Sector: Energy | |
| SubSector: Oil & Gas Equipment & Services | |
| MarketCap: 131.061 Millions | |
| Recent Price: 5.49 Smart Investing & Trading Score: 0 | |
| Day Percent Change: 1.29% Day Change: 0.07 | |
| Week Change: -6.47% Year-to-date Change: -19.2% | |
| OIS Links: Profile News Message Board | |
| Charts:- Daily , Weekly | |
| Add OIS to Watchlist: View: Get Complete OIS Trend Analysis ➞ | |
 | GDEN Golden Entertainment, Inc. |
| Sector: Services & Goods | |
| SubSector: Resorts & Casinos | |
| MarketCap: 130.794 Millions | |
| Recent Price: 33.33 Smart Investing & Trading Score: 10 | |
| Day Percent Change: -0.48% Day Change: -0.16 | |
| Week Change: -6.53% Year-to-date Change: -16.5% | |
| GDEN Links: Profile News Message Board | |
| Charts:- Daily , Weekly | |
| Add GDEN to Watchlist: View: Get Complete GDEN Trend Analysis ➞ | |
 | IDT IDT Corporation |
| Sector: Technology | |
| SubSector: Diversified Communication Services | |
| MarketCap: 130.064 Millions | |
| Recent Price: 35.80 Smart Investing & Trading Score: 26 | |
| Day Percent Change: 0.08% Day Change: 0.03 | |
| Week Change: -3.09% Year-to-date Change: 5.0% | |
| IDT Links: Profile News Message Board | |
| Charts:- Daily , Weekly | |
| Add IDT to Watchlist: View: Get Complete IDT Trend Analysis ➞ | |
 | ITI Iteris, Inc. |
| Sector: Technology | |
| SubSector: Communication Equipment | |
| MarketCap: 129.939 Millions | |
| Recent Price: 4.63 Smart Investing & Trading Score: 10 | |
| Day Percent Change: -0.22% Day Change: -0.01 | |
| Week Change: -1.28% Year-to-date Change: -11.0% | |
| ITI Links: Profile News Message Board | |
| Charts:- Daily , Weekly | |
| Add ITI to Watchlist: View: Get Complete ITI Trend Analysis ➞ | |
 | WKHS Workhorse Group Inc. |
| Sector: Consumer Staples | |
| SubSector: Auto Parts | |
| MarketCap: 129.839 Millions | |
| Recent Price: 0.17 Smart Investing & Trading Score: 10 | |
| Day Percent Change: -4.23% Day Change: -0.01 | |
| Week Change: -15.14% Year-to-date Change: -54.1% | |
| WKHS Links: Profile News Message Board | |
| Charts:- Daily , Weekly | |
| Add WKHS to Watchlist: View: Get Complete WKHS Trend Analysis ➞ | |
 | TLYS Tilly s, Inc. |
| Sector: Services & Goods | |
| SubSector: Apparel Stores | |
| MarketCap: 127.408 Millions | |
| Recent Price: 5.41 Smart Investing & Trading Score: 0 | |
| Day Percent Change: -0.55% Day Change: -0.03 | |
| Week Change: -7.36% Year-to-date Change: -28.3% | |
| TLYS Links: Profile News Message Board | |
| Charts:- Daily , Weekly | |
| Add TLYS to Watchlist: View: Get Complete TLYS Trend Analysis ➞ | |
 | NL NL Industries, Inc. |
| Sector: Services & Goods | |
| SubSector: Industrial Equipment Wholesale | |
| MarketCap: 126.258 Millions | |
| Recent Price: 7.86 Smart Investing & Trading Score: 51 | |
| Day Percent Change: 1.55% Day Change: 0.12 | |
| Week Change: -0.88% Year-to-date Change: 40.1% | |
| NL Links: Profile News Message Board | |
| Charts:- Daily , Weekly | |
| Add NL to Watchlist: View: Get Complete NL Trend Analysis ➞ | |
 | JYNT The Joint Corp. |
| Sector: Health Care | |
| SubSector: Hospitals | |
| MarketCap: 125.146 Millions | |
| Recent Price: 11.91 Smart Investing & Trading Score: 53 | |
| Day Percent Change: -0.87% Day Change: -0.11 | |
| Week Change: -1.93% Year-to-date Change: 24.0% | |
| JYNT Links: Profile News Message Board | |
| Charts:- Daily , Weekly | |
| Add JYNT to Watchlist: View: Get Complete JYNT Trend Analysis ➞ | |
| For tabular summary view of above stock list: Summary View ➞ 0 - 25 , 25 - 50 , 50 - 75 , 75 - 100 , 100 - 125 , 125 - 150 , 150 - 175 , 175 - 200 , 200 - 225 , 225 - 250 , 250 - 275 , 275 - 300 , 300 - 325 , 325 - 350 , 350 - 375 , 375 - 400 , 400 - 425 , 425 - 450 , 450 - 475 , 475 - 500 , 500 - 525 , 525 - 550 , 550 - 575 , 575 - 600 , 600 - 625 , 625 - 650 , 650 - 675 , 675 - 700 , 700 - 725 , 725 - 750 , 750 - 775 , 775 - 800 , 800 - 825 , 825 - 850 , 850 - 875 , 875 - 900 , 900 - 925 , 925 - 950 , 950 - 975 , 975 - 1000 , 1000 - 1025 , 1025 - 1050 , 1050 - 1075 , 1075 - 1100 , 1100 - 1125 , 1125 - 1150 , 1150 - 1175 , 1175 - 1200 , 1200 - 1225 , 1225 - 1250 , 1250 - 1275 , 1275 - 1300 , 1300 - 1325 , 1325 - 1350 , 1350 - 1375 , 1375 - 1400 , 1400 - 1425 , 1425 - 1450 , 1450 - 1475 | ||
| Click To Change The Sort Order: By Market Cap or Company Size Performance: Year-to-date, Week and Day | |
| Select Chart Type: | ||
| Too many stocks? View smallcap stocks filtered by marketcap & sector |
| Marketcap: All SmallCap Stocks (default-no microcap), Large, Mid-Range, Small & MicroCap |
| Sector: Tech, Finance, Energy, Staples, Retail, Industrial, Materials, Utilities & Medical |
|
Best Stocks Today 12Stocks.com |
© 2024 12Stocks.com Terms & Conditions Privacy Contact Us
All Information Provided Only For Education And Not To Be Used For Investing or Trading. See Terms & Conditions


One More Thing ... Get Best Stocks Delivered Daily!
Never Ever Miss A Move With Our Top Ten Stocks Lists
Find Best Stocks In Any Market - Bull or Bear Market
Take A Peek At Our Top Ten Stocks Lists: Daily, Weekly, Year-to-Date & Top Trends
Find Best Stocks In Any Market - Bull or Bear Market
Take A Peek At Our Top Ten Stocks Lists: Daily, Weekly, Year-to-Date & Top Trends
Smallcap Stocks With Best Up Trends [0-bearish to 100-bullish]: Envestnet [100], IMAX [100], PrimeEnergy Resources[100], ALX Oncology[100], Vanda [100], Intra-Cellular Therapies[100], ProKidney [100], Oscar Health[95], Dorian LPG[95], Macatawa Bank[93], Encore Wire[93]
Best Smallcap Stocks Year-to-Date:
CareMax [417.53%], Janux [344.67%], Viking [250.51%], Alpine Immune[238.58%], Super Micro[232.34%], Longboard [171.69%], Avidity Biosciences[157.3%], Vera [153.59%], Hippo [124.26%], Verde Clean[112.02%], Veritone [111.54%] Best Smallcap Stocks This Week:
Macatawa Bank[42.96%], Snap One[29.73%], ProKidney [26.57%], Vertex Energy[22.6%], Vanda [22.33%], ALX Oncology[20.11%], Cullinan Oncology[13.98%], Expensify [12.93%], Children s[11.86%], Citius [11.75%], Humacyte [11.46%] Best Smallcap Stocks Daily:
23andMe Holding[37.10%], Vertex Energy[30.21%], Zura Bio[12.58%], Badger Meter[10.35%], Expensify [9.93%], Apogee Enterprises[8.74%], Barnes Group[8.15%], Citius [7.87%], Tellurian [7.58%], Duolingo [7.23%], Cullinan Oncology[6.50%]