
 Login Sign Up


| |||||
 |  | ||||

| 12Stocks.com Market Intelligence |
Best SmallCap Stocks
|
| In a hurry? Small Cap Stock Lists: Performance Trends Table, Stock Charts
Sort Small Cap stocks: Daily, Weekly, Year-to-Date, Market Cap & Trends. Filter Small Cap stocks list by sector: Show all, Tech, Finance, Energy, Staples, Retail, Industrial, Materials, Utilities and HealthCare Filter Small Cap stocks list by size: All Large Medium Small and MicroCap |
| 12Stocks.com Small Cap Stocks Performances & Trends Daily | |||||||||
|
|  The overall Smart Investing & Trading Score is 26 (0-bearish to 100-bullish) which puts Small Cap index in short term bearish to neutral trend. The Smart Investing & Trading Score from previous trading session is 31 and hence a deterioration of trend.
| ||||||||
Here are the Smart Investing & Trading Scores of the most requested small cap stocks at 12Stocks.com (click stock name for detailed review):
|


| 12Stocks.com: Investing in Smallcap Index with Stocks | |
|
The following table helps investors and traders sort through current performance and trends (as measured by Smart Investing & Trading Score) of various
stocks in the Smallcap Index. Quick View: Move mouse or cursor over stock symbol (ticker) to view short-term technical chart and over stock name to view long term chart. Click on  to add stock symbol to your watchlist and to add stock symbol to your watchlist and  to view watchlist. Click on any ticker or stock name for detailed market intelligence report for that stock. to view watchlist. Click on any ticker or stock name for detailed market intelligence report for that stock. |
12Stocks.com Performance of Stocks in Smallcap Index
| Ticker | Stock Name | Watchlist | Category | Recent Price | Smart Investing & Trading Score | Change % | YTD Change% |
| AWR | American States |   | Utilities | 67.61 | 10 | -0.25% | -15.93% |
| YOU | Clear Secure | | Technology | 18.61 | 0 | -3.92% | -10.18% |
| FFIN | First Financial | | Financials | 29.31 | 18 | -2.98% | -3.27% |
| QLYS | Qualys | | Technology | 162.05 | 10 | -2.47% | -17.44% |
| ARVN | Arvinas | | Health Care | 34.72 | 10 | -4.33% | -15.65% |
| LFST | LifeStance Health | | Health Care | 5.85 | 0 | -3.31% | -26.09% |
| GBTG | Global Business | | Technology | 5.91 | 46 | 1.37% | -9.49% |
| SWX | Southwest Gas | | Utilities | 72.30 | 36 | -0.77% | 14.13% |
| APPF | AppFolio | | Technology | 215.70 | 0 | -2.59% | 24.51% |
| FLYW | Flywire | | Technology | 20.93 | 0 | -7.88% | -10.67% |
| HQY | HealthEquity | | Technology | 80.23 | 48 | 0.48% | 21.01% |
| BLUE | bluebird bio | | Health Care | 1.03 | 0 | -6.36% | -25.36% |
| TRNO | Terreno Realty | | Financials | 59.51 | 13 | -2.09% | -5.04% |
| BCPC | Balchem | | Materials | 146.76 | 26 | -0.77% | -1.34% |
| NJR | New Jersey | | Utilities | 41.58 | 44 | -0.50% | -6.73% |
| RELY | Remitly Global | | Technology | 18.53 | 71 | -2.93% | -4.58% |
| SDRL | Seadrill | | Energy | 51.32 | 51 | -0.45% | 8.25% |
| HPP | Hudson Pacific | | Financials | 5.80 | 15 | -5.23% | -37.70% |
| NEOG | Neogen | | Health Care | 12.01 | 0 | -2.99% | -40.28% |
| ALLK | Allakos | | Health Care | 1.08 | 15 | -2.70% | -60.44% |
| ARWR | Arrowhead | | Health Care | 24.02 | 0 | -2.83% | -21.50% |
| AUR | Aurora Innovation | | Technology | 3.00 | 56 | -2.28% | -31.90% |
| HELE | Helen of Troy | | Consumer Staples | 97.53 | 0 | -2.32% | -19.27% |
| SATS | EchoStar | | Technology | 14.17 | 93 | -0.21% | -14.48% |
| ALE | ALLETE | | Utilities | 57.78 | 10 | -0.94% | -5.53% |


| Too many stocks? View smallcap stocks filtered by marketcap & sector |
| Marketcap: All SmallCap Stocks (default-no microcap), Large, Mid-Range, Small |
| Smallcap Sector: Tech, Finance, Energy, Staples, Retail, Industrial, Materials, & Medical |
|
Get the most comprehensive stock market coverage daily at 12Stocks.com ➞ Best Stocks Today ➞ Best Stocks Weekly ➞ Best Stocks Year-to-Date ➞ Best Stocks Trends ➞  Best Stocks Today 12Stocks.com Best Nasdaq Stocks ➞ Best S&P 500 Stocks ➞ Best Tech Stocks ➞ Best Biotech Stocks ➞ |
| Detailed Overview of SmallCap Stocks |
| SmallCap Technical Overview, Leaders & Laggards, Top SmallCap ETF Funds & Detailed SmallCap Stocks List, Charts, Trends & More |
| Smallcap: Technical Analysis, Trends & YTD Performance | |
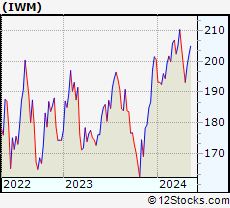
| SmallCap segment as represented by
IWM, an exchange-traded fund [ETF], holds basket of thousands of smallcap stocks from across all major sectors of the US stock market. The smallcap index (contains stocks like Riverbed & Sotheby's) is down by -2.46% and is currently underperforming the overall market by -7.8% year-to-date. Below is a quick view of technical charts and trends: | |
 IWM Weekly Chart |
|
| Long Term Trend: Good | |
| Medium Term Trend: Not Good | |
 IWM Daily Chart |
|
| Short Term Trend: Not Good | |
| Overall Trend Score: 26 | |
| YTD Performance: -2.46% | |
| **Trend Scores & Views Are Only For Educational Purposes And Not For Investing | |
| 12Stocks.com: Top Performing Small Cap Index Stocks | ||||||||||||||||||||||||||||||||||||||||||||||||
 The top performing Small Cap Index stocks year to date are
Now, more recently, over last week, the top performing Small Cap Index stocks on the move are


|
||||||||||||||||||||||||||||||||||||||||||||||||
| 12Stocks.com: Investing in Smallcap Index using Exchange Traded Funds | |
|
The following table shows list of key exchange traded funds (ETF) that
help investors track Smallcap index. The following list also includes leveraged ETF funds that track twice or thrice the daily returns of Smallcap indices. Short or inverse ETF funds move in the opposite direction to the index they track and are useful during market pullbacks or during bear markets. Quick View: Move mouse or cursor over ETF symbol (ticker) to view short-term technical chart and over ETF name to view long term chart. Click on ticker or stock name for detailed view. Click on to add stock symbol to your watchlist and to view watchlist. |
12Stocks.com List of ETFs that track Smallcap Index
| Ticker | ETF Name | Watchlist | Recent Price | Smart Investing & Trading Score | Change % | Week % | Year-to-date % |
| IWM | iShares Russell 2000 | | 195.78 | 26 | -1.46 | -1.46 | -2.46% |
| IJR | iShares Core S&P Small-Cap | | 103.54 | 18 | -0.93 | -0.93 | -4.35% |
| VTWO | Vanguard Russell 2000 ETF | | 79.23 | 31 | -1.36 | -1.36 | -2.31% |
| IWN | iShares Russell 2000 Value | | 148.60 | 31 | -1.18 | -1.18 | -4.33% |
| IWO | iShares Russell 2000 Growth | | 251.04 | 31 | -1.69 | -1.69 | -0.47% |
| IJS | iShares S&P Small-Cap 600 Value | | 95.20 | 0 | -1.01 | -1.01 | -7.64% |
| IJT | iShares S&P Small-Cap 600 Growth | | 123.52 | 39 | -1.01 | -1.01 | -1.29% |
| XSLV | PowerShares S&P SmallCap Low Volatil ETF | | 41.88 | 13 | -0.50 | -0.5 | -5.14% |
| SDD | ProShares UltraShort SmallCap600 | | 20.23 | 74 | 2.01 | 2.01 | 9.79% |
| SAA | ProShares Ultra SmallCap600 | | 22.43 | 0 | -0.58 | -0.58 | -10.1% |
| SBB | ProShares Short SmallCap600 | | 16.41 | 52 | -0.83 | -0.83 | 3.01% |
| SMLV | SPDR SSGA US Small Cap Low Volatil ETF | | 104.73 | 8 | -0.27 | -0.27 | -6.92% |
| 12Stocks.com: Charts, Trends, Fundamental Data and Performances of SmallCap Stocks | |
|
We now take in-depth look at all SmallCap stocks including charts, multi-period performances and overall trends (as measured by Smart Investing & Trading Score). One can sort SmallCap stocks (click link to choose) by Daily, Weekly and by Year-to-Date performances. Also, one can sort by size of the company or by market capitalization. |
| Select Your Default Chart Type: | |||||
| |||||
| Click on stock symbol or name for detailed view. Click on to add stock symbol to your watchlist and to view watchlist. Quick View: Move mouse or cursor over "Daily" to quickly view daily technical stock chart and over "Weekly" to view weekly technical stock chart. | |||||

 | AWR American States Water Company |
| Sector: Utilities | |
| SubSector: Water Utilities | |
| MarketCap: 3519.12 Millions | |
| Recent Price: 67.61 Smart Investing & Trading Score: 10 | |
| Day Percent Change: -0.25% Day Change: -0.17 | |
| Week Change: -0.25% Year-to-date Change: -15.9% | |
| AWR Links: Profile News Message Board | |
| Charts:- Daily , Weekly | |
| Add AWR to Watchlist: View: Get Complete AWR Trend Analysis ➞ | |
 | YOU Clear Secure, Inc. |
| Sector: Technology | |
| SubSector: Software - Application | |
| MarketCap: 3510 Millions | |
| Recent Price: 18.61 Smart Investing & Trading Score: 0 | |
| Day Percent Change: -3.92% Day Change: -0.76 | |
| Week Change: -3.92% Year-to-date Change: -10.2% | |
| YOU Links: Profile News Message Board | |
| Charts:- Daily , Weekly | |
| Add YOU to Watchlist: View: Get Complete YOU Trend Analysis ➞ | |
 | FFIN First Financial Bankshares, Inc. |
| Sector: Financials | |
| SubSector: Regional - Southwest Banks | |
| MarketCap: 3503.75 Millions | |
| Recent Price: 29.31 Smart Investing & Trading Score: 18 | |
| Day Percent Change: -2.98% Day Change: -0.90 | |
| Week Change: -2.98% Year-to-date Change: -3.3% | |
| FFIN Links: Profile News Message Board | |
| Charts:- Daily , Weekly | |
| Add FFIN to Watchlist: View: Get Complete FFIN Trend Analysis ➞ | |
 | QLYS Qualys, Inc. |
| Sector: Technology | |
| SubSector: Application Software | |
| MarketCap: 3475.02 Millions | |
| Recent Price: 162.05 Smart Investing & Trading Score: 10 | |
| Day Percent Change: -2.47% Day Change: -4.10 | |
| Week Change: -2.47% Year-to-date Change: -17.4% | |
| QLYS Links: Profile News Message Board | |
| Charts:- Daily , Weekly | |
| Add QLYS to Watchlist: View: Get Complete QLYS Trend Analysis ➞ | |
 | ARVN Arvinas, Inc. |
| Sector: Health Care | |
| SubSector: Biotechnology | |
| MarketCap: 3469.85 Millions | |
| Recent Price: 34.72 Smart Investing & Trading Score: 10 | |
| Day Percent Change: -4.33% Day Change: -1.57 | |
| Week Change: -4.33% Year-to-date Change: -15.7% | |
| ARVN Links: Profile News Message Board | |
| Charts:- Daily , Weekly | |
| Add ARVN to Watchlist: View: Get Complete ARVN Trend Analysis ➞ | |
 | LFST LifeStance Health Group, Inc. |
| Sector: Health Care | |
| SubSector: Medical Care Facilities | |
| MarketCap: 3460 Millions | |
| Recent Price: 5.85 Smart Investing & Trading Score: 0 | |
| Day Percent Change: -3.31% Day Change: -0.20 | |
| Week Change: -3.31% Year-to-date Change: -26.1% | |
| LFST Links: Profile News Message Board | |
| Charts:- Daily , Weekly | |
| Add LFST to Watchlist: View: Get Complete LFST Trend Analysis ➞ | |
 | GBTG Global Business Travel Group, Inc. |
| Sector: Technology | |
| SubSector: Software - Application | |
| MarketCap: 3440 Millions | |
| Recent Price: 5.91 Smart Investing & Trading Score: 46 | |
| Day Percent Change: 1.37% Day Change: 0.08 | |
| Week Change: 1.37% Year-to-date Change: -9.5% | |
| GBTG Links: Profile News Message Board | |
| Charts:- Daily , Weekly | |
| Add GBTG to Watchlist: View: Get Complete GBTG Trend Analysis ➞ | |
 | SWX Southwest Gas Holdings, Inc. |
| Sector: Utilities | |
| SubSector: Gas Utilities | |
| MarketCap: 3427.87 Millions | |
| Recent Price: 72.30 Smart Investing & Trading Score: 36 | |
| Day Percent Change: -0.77% Day Change: -0.56 | |
| Week Change: -0.77% Year-to-date Change: 14.1% | |
| SWX Links: Profile News Message Board | |
| Charts:- Daily , Weekly | |
| Add SWX to Watchlist: View: Get Complete SWX Trend Analysis ➞ | |
 | APPF AppFolio, Inc. |
| Sector: Technology | |
| SubSector: Application Software | |
| MarketCap: 3412.02 Millions | |
| Recent Price: 215.70 Smart Investing & Trading Score: 0 | |
| Day Percent Change: -2.59% Day Change: -5.73 | |
| Week Change: -2.59% Year-to-date Change: 24.5% | |
| APPF Links: Profile News Message Board | |
| Charts:- Daily , Weekly | |
| Add APPF to Watchlist: View: Get Complete APPF Trend Analysis ➞ | |
 | FLYW Flywire Corporation |
| Sector: Technology | |
| SubSector: Software - Infrastructure | |
| MarketCap: 3390 Millions | |
| Recent Price: 20.93 Smart Investing & Trading Score: 0 | |
| Day Percent Change: -7.88% Day Change: -1.79 | |
| Week Change: -7.88% Year-to-date Change: -10.7% | |
| FLYW Links: Profile News Message Board | |
| Charts:- Daily , Weekly | |
| Add FLYW to Watchlist: View: Get Complete FLYW Trend Analysis ➞ | |
 | HQY HealthEquity, Inc. |
| Sector: Technology | |
| SubSector: Healthcare Information Services | |
| MarketCap: 3369.75 Millions | |
| Recent Price: 80.23 Smart Investing & Trading Score: 48 | |
| Day Percent Change: 0.48% Day Change: 0.38 | |
| Week Change: 0.48% Year-to-date Change: 21.0% | |
| HQY Links: Profile News Message Board | |
| Charts:- Daily , Weekly | |
| Add HQY to Watchlist: View: Get Complete HQY Trend Analysis ➞ | |
 | BLUE bluebird bio, Inc. |
| Sector: Health Care | |
| SubSector: Biotechnology | |
| MarketCap: 3365.05 Millions | |
| Recent Price: 1.03 Smart Investing & Trading Score: 0 | |
| Day Percent Change: -6.36% Day Change: -0.07 | |
| Week Change: -6.36% Year-to-date Change: -25.4% | |
| BLUE Links: Profile News Message Board | |
| Charts:- Daily , Weekly | |
| Add BLUE to Watchlist: View: Get Complete BLUE Trend Analysis ➞ | |
 | TRNO Terreno Realty Corporation |
| Sector: Financials | |
| SubSector: REIT - Industrial | |
| MarketCap: 3359.69 Millions | |
| Recent Price: 59.51 Smart Investing & Trading Score: 13 | |
| Day Percent Change: -2.09% Day Change: -1.27 | |
| Week Change: -2.09% Year-to-date Change: -5.0% | |
| TRNO Links: Profile News Message Board | |
| Charts:- Daily , Weekly | |
| Add TRNO to Watchlist: View: Get Complete TRNO Trend Analysis ➞ | |
 | BCPC Balchem Corporation |
| Sector: Materials | |
| SubSector: Specialty Chemicals | |
| MarketCap: 3330.17 Millions | |
| Recent Price: 146.76 Smart Investing & Trading Score: 26 | |
| Day Percent Change: -0.77% Day Change: -1.14 | |
| Week Change: -0.77% Year-to-date Change: -1.3% | |
| BCPC Links: Profile News Message Board | |
| Charts:- Daily , Weekly | |
| Add BCPC to Watchlist: View: Get Complete BCPC Trend Analysis ➞ | |
 | NJR New Jersey Resources Corporation |
| Sector: Utilities | |
| SubSector: Gas Utilities | |
| MarketCap: 3320.27 Millions | |
| Recent Price: 41.58 Smart Investing & Trading Score: 44 | |
| Day Percent Change: -0.50% Day Change: -0.21 | |
| Week Change: -0.5% Year-to-date Change: -6.7% | |
| NJR Links: Profile News Message Board | |
| Charts:- Daily , Weekly | |
| Add NJR to Watchlist: View: Get Complete NJR Trend Analysis ➞ | |
 | RELY Remitly Global, Inc. |
| Sector: Technology | |
| SubSector: Software - Infrastructure | |
| MarketCap: 3320 Millions | |
| Recent Price: 18.53 Smart Investing & Trading Score: 71 | |
| Day Percent Change: -2.93% Day Change: -0.56 | |
| Week Change: -2.93% Year-to-date Change: -4.6% | |
| RELY Links: Profile News Message Board | |
| Charts:- Daily , Weekly | |
| Add RELY to Watchlist: View: Get Complete RELY Trend Analysis ➞ | |
 | SDRL Seadrill Limited |
| Sector: Energy | |
| SubSector: Oil & Gas Drilling | |
| MarketCap: 3300 Millions | |
| Recent Price: 51.32 Smart Investing & Trading Score: 51 | |
| Day Percent Change: -0.45% Day Change: -0.23 | |
| Week Change: -0.45% Year-to-date Change: 8.3% | |
| SDRL Links: Profile News Message Board | |
| Charts:- Daily , Weekly | |
| Add SDRL to Watchlist: View: Get Complete SDRL Trend Analysis ➞ | |
 | HPP Hudson Pacific Properties, Inc. |
| Sector: Financials | |
| SubSector: REIT - Office | |
| MarketCap: 3267.16 Millions | |
| Recent Price: 5.80 Smart Investing & Trading Score: 15 | |
| Day Percent Change: -5.23% Day Change: -0.32 | |
| Week Change: -5.23% Year-to-date Change: -37.7% | |
| HPP Links: Profile News Message Board | |
| Charts:- Daily , Weekly | |
| Add HPP to Watchlist: View: Get Complete HPP Trend Analysis ➞ | |
 | NEOG Neogen Corporation |
| Sector: Health Care | |
| SubSector: Diagnostic Substances | |
| MarketCap: 3234.71 Millions | |
| Recent Price: 12.01 Smart Investing & Trading Score: 0 | |
| Day Percent Change: -2.99% Day Change: -0.37 | |
| Week Change: -2.99% Year-to-date Change: -40.3% | |
| NEOG Links: Profile News Message Board | |
| Charts:- Daily , Weekly | |
| Add NEOG to Watchlist: View: Get Complete NEOG Trend Analysis ➞ | |
 | ALLK Allakos Inc. |
| Sector: Health Care | |
| SubSector: Biotechnology | |
| MarketCap: 3233.55 Millions | |
| Recent Price: 1.08 Smart Investing & Trading Score: 15 | |
| Day Percent Change: -2.70% Day Change: -0.03 | |
| Week Change: -2.7% Year-to-date Change: -60.4% | |
| ALLK Links: Profile News Message Board | |
| Charts:- Daily , Weekly | |
| Add ALLK to Watchlist: View: Get Complete ALLK Trend Analysis ➞ | |
 | ARWR Arrowhead Pharmaceuticals, Inc. |
| Sector: Health Care | |
| SubSector: Biotechnology | |
| MarketCap: 3226.15 Millions | |
| Recent Price: 24.02 Smart Investing & Trading Score: 0 | |
| Day Percent Change: -2.83% Day Change: -0.70 | |
| Week Change: -2.83% Year-to-date Change: -21.5% | |
| ARWR Links: Profile News Message Board | |
| Charts:- Daily , Weekly | |
| Add ARWR to Watchlist: View: Get Complete ARWR Trend Analysis ➞ | |
 | AUR Aurora Innovation, Inc. |
| Sector: Technology | |
| SubSector: Information Technology Services | |
| MarketCap: 3220 Millions | |
| Recent Price: 3.00 Smart Investing & Trading Score: 56 | |
| Day Percent Change: -2.28% Day Change: -0.07 | |
| Week Change: -2.28% Year-to-date Change: -31.9% | |
| AUR Links: Profile News Message Board | |
| Charts:- Daily , Weekly | |
| Add AUR to Watchlist: View: Get Complete AUR Trend Analysis ➞ | |
 | HELE Helen of Troy Limited |
| Sector: Consumer Staples | |
| SubSector: Housewares & Accessories | |
| MarketCap: 3199.53 Millions | |
| Recent Price: 97.53 Smart Investing & Trading Score: 0 | |
| Day Percent Change: -2.32% Day Change: -2.32 | |
| Week Change: -2.32% Year-to-date Change: -19.3% | |
| HELE Links: Profile News Message Board | |
| Charts:- Daily , Weekly | |
| Add HELE to Watchlist: View: Get Complete HELE Trend Analysis ➞ | |
 | SATS EchoStar Corporation |
| Sector: Technology | |
| SubSector: Communication Equipment | |
| MarketCap: 3175.69 Millions | |
| Recent Price: 14.17 Smart Investing & Trading Score: 93 | |
| Day Percent Change: -0.21% Day Change: -0.03 | |
| Week Change: -0.21% Year-to-date Change: -14.5% | |
| SATS Links: Profile News Message Board | |
| Charts:- Daily , Weekly | |
| Add SATS to Watchlist: View: Get Complete SATS Trend Analysis ➞ | |
 | ALE ALLETE, Inc. |
| Sector: Utilities | |
| SubSector: Diversified Utilities | |
| MarketCap: 3145.4 Millions | |
| Recent Price: 57.78 Smart Investing & Trading Score: 10 | |
| Day Percent Change: -0.94% Day Change: -0.55 | |
| Week Change: -0.94% Year-to-date Change: -5.5% | |
| ALE Links: Profile News Message Board | |
| Charts:- Daily , Weekly | |
| Add ALE to Watchlist: View: Get Complete ALE Trend Analysis ➞ | |
| Too many stocks? View smallcap stocks filtered by marketcap & sector |
| Marketcap: All SmallCap Stocks (default-no microcap), Large, Mid-Range, Small & MicroCap |
| Sector: Tech, Finance, Energy, Staples, Retail, Industrial, Materials, Utilities & Medical |
|
Best Stocks Today 12Stocks.com |
© 2024 12Stocks.com Terms & Conditions Privacy Contact Us
All Information Provided Only For Education And Not To Be Used For Investing or Trading. See Terms & Conditions


One More Thing ... Get Best Stocks Delivered Daily!
Never Ever Miss A Move With Our Top Ten Stocks Lists
Find Best Stocks In Any Market - Bull or Bear Market
Take A Peek At Our Top Ten Stocks Lists: Daily, Weekly, Year-to-Date & Top Trends
Find Best Stocks In Any Market - Bull or Bear Market
Take A Peek At Our Top Ten Stocks Lists: Daily, Weekly, Year-to-Date & Top Trends
Smallcap Stocks With Best Up Trends [0-bearish to 100-bullish]: Snap One[100], ProKidney [100], SES AI[100], Encore Wire[100], Century Aluminum[100], Core Molding[100], Theravance Biopharma[100], Acadia Realty[100], Prelude [100], Alpine Immune[100], Argan [100]
Best Smallcap Stocks Year-to-Date:
CareMax [570.1%], Janux [382.64%], Viking [259.81%], Alpine Immune[238.34%], Arcutis Bio[212.38%], Super Micro[210.54%], Vera [200.58%], Longboard [198.69%], Avidity Biosciences[164.49%], Veritone [151.1%], Stoke [132.13%] Best Smallcap Stocks This Week:
Snap One[29.48%], ProKidney [19.43%], Piedmont Lithium[15.77%], SES AI[15.44%], Eagle [13.29%], Encore Wire[11.59%], ESSA Bancorp[8.88%], Benson Hill[8.4%], Pulse Biosciences[8.31%], Century Aluminum[7.71%], Core Molding[7.45%] Best Smallcap Stocks Daily:
Snap One[29.48%], ProKidney [19.43%], Piedmont Lithium[15.77%], SES AI[15.44%], Eagle [13.29%], Encore Wire[11.59%], ESSA Bancorp[8.88%], Benson Hill[8.40%], Pulse Biosciences[8.31%], Century Aluminum[7.71%], Core Molding[7.45%]