
 Login Sign Up


| |||||
 |  | ||||

| 12Stocks.com Market Intelligence |
Best SmallCap Stocks
|
| In a hurry? Small Cap Stock Lists: Performance Trends Table, Stock Charts
Sort Small Cap stocks: Daily, Weekly, Year-to-Date, Market Cap & Trends. Filter Small Cap stocks list by sector: Show all, Tech, Finance, Energy, Staples, Retail, Industrial, Materials, Utilities and HealthCare Filter Small Cap stocks list by size: All Large Medium Small and MicroCap |
| 12Stocks.com Small Cap Stocks Performances & Trends Daily | |||||||||
|
|  The overall Smart Investing & Trading Score is 63 (0-bearish to 100-bullish) which puts Small Cap index in short term neutral to bullish trend. The Smart Investing & Trading Score from previous trading session is 58 and hence an improvement of trend.
| ||||||||
Here are the Smart Investing & Trading Scores of the most requested small cap stocks at 12Stocks.com (click stock name for detailed review):
|


| 12Stocks.com: Investing in Smallcap Index with Stocks | |
|
The following table helps investors and traders sort through current performance and trends (as measured by Smart Investing & Trading Score) of various
stocks in the Smallcap Index. Quick View: Move mouse or cursor over stock symbol (ticker) to view short-term technical chart and over stock name to view long term chart. Click on  to add stock symbol to your watchlist and to add stock symbol to your watchlist and  to view watchlist. Click on any ticker or stock name for detailed market intelligence report for that stock. to view watchlist. Click on any ticker or stock name for detailed market intelligence report for that stock. |
12Stocks.com Performance of Stocks in Smallcap Index
| Ticker | Stock Name | Watchlist | Category | Recent Price | Smart Investing & Trading Score | Change % | YTD Change% |
| CEVA | CEVA |   | Technology | 19.31 | 55 | 2.12% | -14.97% |
| SLP | Simulations Plus | | Technology | 45.88 | 68 | 1.92% | 2.51% |
| TTGT | TechTarget | | Technology | 27.27 | 35 | 1.11% | -21.77% |
| NTGR | NETGEAR | | Technology | 14.58 | 68 | 1.18% | 0.00% |
| TCX | Tucows | | Technology | 17.60 | 54 | -0.11% | -34.81% |
| SCSC | ScanSource | | Technology | 44.45 | 100 | 7.16% | 12.22% |
| HLIT | Harmonic | | Technology | 9.58 | 17 | -1.24% | -26.53% |
| UCTT | Ultra Clean | | Technology | 39.75 | 48 | 3.49% | 16.43% |
| COHU | Cohu | | Technology | 29.95 | 42 | 3.03% | -15.37% |
| CNDT | Conduent | | Technology | 3.03 | 32 | -0.66% | -16.99% |
| LAW | CS Disco | | Technology | 7.73 | 27 | 0.13% | 1.18% |
| ACLS | Axcelis | | Technology | 97.24 | 27 | 0.29% | -25.02% |
| NOTE | FiscalNote | | Technology | 1.20 | 27 | 2.56% | 2.56% |
| EVH | Evolent Health | | Technology | 30.13 | 65 | 0.90% | -8.78% |
| GSAT | Globalstar | | Technology | 1.30 | 42 | 3.17% | -32.99% |
| VECO | Veeco Instruments | | Technology | 33.73 | 51 | 3.02% | 8.70% |
| IIIV | i3 Verticals | | Technology | 23.47 | 95 | 4.22% | 10.86% |
| LASR | nLIGHT | | Technology | 10.95 | 32 | 1.67% | -18.89% |
| ACMR | ACM Research | | Technology | 27.39 | 56 | 6.37% | 40.17% |
| APPS | Digital Turbine | | Technology | 1.94 | 59 | 4.30% | -71.72% |
| FRGE | Forge Global | | Technology | 1.97 | 73 | 2.60% | -44.82% |
| QNST | QuinStreet | | Technology | 17.34 | 90 | 1.49% | 35.22% |
| ICHR | Ichor | | Technology | 37.54 | 56 | 3.79% | 11.63% |
| VLD | Velo3D | | Technology | 0.24 | 20 | -0.61% | -37.72% |
| SITM | SiTime | | Technology | 74.56 | 45 | 1.15% | -38.93% |
| For chart view version of above stock list: Chart View ➞ 0 - 25 , 25 - 50 , 50 - 75 , 75 - 100 , 100 - 125 , 125 - 150 , 150 - 175 , 175 - 200 , 200 - 225 , 225 - 250 , 250 - 275 | ||
 | Click To Change The Sort Order: By Market Cap or Company Size Performance: Year-to-date, Week and Day |  |
| Too many stocks? View smallcap stocks filtered by marketcap & sector |
| Marketcap: All SmallCap Stocks (default-no microcap), Large, Mid-Range, Small |
| Smallcap Sector: Tech, Finance, Energy, Staples, Retail, Industrial, Materials, & Medical |
|
Get the most comprehensive stock market coverage daily at 12Stocks.com ➞ Best Stocks Today ➞ Best Stocks Weekly ➞ Best Stocks Year-to-Date ➞ Best Stocks Trends ➞  Best Stocks Today 12Stocks.com Best Nasdaq Stocks ➞ Best S&P 500 Stocks ➞ Best Tech Stocks ➞ Best Biotech Stocks ➞ |
| Detailed Overview of SmallCap Stocks |
| SmallCap Technical Overview, Leaders & Laggards, Top SmallCap ETF Funds & Detailed SmallCap Stocks List, Charts, Trends & More |
| Smallcap: Technical Analysis, Trends & YTD Performance | |
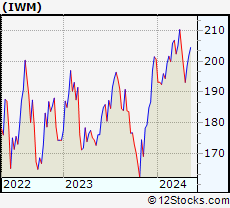
| SmallCap segment as represented by
IWM, an exchange-traded fund [ETF], holds basket of thousands of smallcap stocks from across all major sectors of the US stock market. The smallcap index (contains stocks like Riverbed & Sotheby's) is down by -1.07% and is currently underperforming the overall market by -6.71% year-to-date. Below is a quick view of technical charts and trends: | |
 IWM Weekly Chart |
|
| Long Term Trend: Good | |
| Medium Term Trend: Not Good | |
 IWM Daily Chart |
|
| Short Term Trend: Very Good | |
| Overall Trend Score: 63 | |
| YTD Performance: -1.07% | |
| **Trend Scores & Views Are Only For Educational Purposes And Not For Investing | |
| 12Stocks.com: Top Performing Small Cap Index Stocks | ||||||||||||||||||||||||||||||||||||||||||||||||
 The top performing Small Cap Index stocks year to date are
Now, more recently, over last week, the top performing Small Cap Index stocks on the move are


|
||||||||||||||||||||||||||||||||||||||||||||||||
| 12Stocks.com: Investing in Smallcap Index using Exchange Traded Funds | |
|
The following table shows list of key exchange traded funds (ETF) that
help investors track Smallcap index. The following list also includes leveraged ETF funds that track twice or thrice the daily returns of Smallcap indices. Short or inverse ETF funds move in the opposite direction to the index they track and are useful during market pullbacks or during bear markets. Quick View: Move mouse or cursor over ETF symbol (ticker) to view short-term technical chart and over ETF name to view long term chart. Click on ticker or stock name for detailed view. Click on to add stock symbol to your watchlist and to view watchlist. |
12Stocks.com List of ETFs that track Smallcap Index
| Ticker | ETF Name | Watchlist | Recent Price | Smart Investing & Trading Score | Change % | Week % | Year-to-date % |
| IWM | iShares Russell 2000 | | 198.57 | 63 | 1.67 | 2.81 | -1.07% |
| IJR | iShares Core S&P Small-Cap | | 105.96 | 85 | 2.41 | 2.65 | -2.12% |
| VTWO | Vanguard Russell 2000 ETF | | 80.29 | 70 | 1.74 | 2.83 | -1% |
| IWN | iShares Russell 2000 Value | | 151.74 | 75 | 1.49 | 2.68 | -2.31% |
| IJS | iShares S&P Small-Cap 600 Value | | 98.13 | 67 | 1.76 | 2.64 | -4.79% |
| IWO | iShares Russell 2000 Growth | | 252.37 | 58 | 1.79 | 2.89 | 0.06% |
| IJT | iShares S&P Small-Cap 600 Growth | | 125.72 | 70 | 1.91 | 2.87 | 0.46% |
| XSLV | PowerShares S&P SmallCap Low Volatil ETF | | 43.05 | 80 | 1.44 | 2.06 | -2.49% |
| SMLV | SPDR SSGA US Small Cap Low Volatil ETF | | 108.77 | 93 | 1.20 | 2.52 | -3.34% |
| SAA | ProShares Ultra SmallCap600 | | 23.15 | 80 | 3.49 | 6.19 | -7.21% |
| SBB | ProShares Short SmallCap600 | | 16.37 | 20 | -1.48 | -2.77 | 2.79% |
| SDD | ProShares UltraShort SmallCap600 | | 19.23 | 30 | -2.63 | -5.46 | 4.36% |
| 12Stocks.com: Charts, Trends, Fundamental Data and Performances of SmallCap Stocks | |
|
We now take in-depth look at all SmallCap stocks including charts, multi-period performances and overall trends (as measured by Smart Investing & Trading Score). One can sort SmallCap stocks (click link to choose) by Daily, Weekly and by Year-to-Date performances. Also, one can sort by size of the company or by market capitalization. |
| Select Your Default Chart Type: | |||||
| |||||
| Click on stock symbol or name for detailed view. Click on to add stock symbol to your watchlist and to view watchlist. Quick View: Move mouse or cursor over "Daily" to quickly view daily technical stock chart and over "Weekly" to view weekly technical stock chart. | |||||

 | CEVA CEVA, Inc. |
| Sector: Technology | |
| SubSector: Semiconductor - Specialized | |
| MarketCap: 587.06 Millions | |
| Recent Price: 19.31 Smart Investing & Trading Score: 55 | |
| Day Percent Change: 2.12% Day Change: 0.40 | |
| Week Change: 3.48% Year-to-date Change: -15.0% | |
| CEVA Links: Profile News Message Board | |
| Charts:- Daily , Weekly | |
| Add CEVA to Watchlist: View: Get Complete CEVA Trend Analysis ➞ | |
 | SLP Simulations Plus, Inc. |
| Sector: Technology | |
| SubSector: Business Software & Services | |
| MarketCap: 564.258 Millions | |
| Recent Price: 45.88 Smart Investing & Trading Score: 68 | |
| Day Percent Change: 1.92% Day Change: 0.87 | |
| Week Change: 1.58% Year-to-date Change: 2.5% | |
| SLP Links: Profile News Message Board | |
| Charts:- Daily , Weekly | |
| Add SLP to Watchlist: View: Get Complete SLP Trend Analysis ➞ | |
 | TTGT TechTarget, Inc. |
| Sector: Technology | |
| SubSector: Internet Information Providers | |
| MarketCap: 560.78 Millions | |
| Recent Price: 27.27 Smart Investing & Trading Score: 35 | |
| Day Percent Change: 1.11% Day Change: 0.30 | |
| Week Change: 0.37% Year-to-date Change: -21.8% | |
| TTGT Links: Profile News Message Board | |
| Charts:- Daily , Weekly | |
| Add TTGT to Watchlist: View: Get Complete TTGT Trend Analysis ➞ | |
 | NTGR NETGEAR, Inc. |
| Sector: Technology | |
| SubSector: Communication Equipment | |
| MarketCap: 558.839 Millions | |
| Recent Price: 14.58 Smart Investing & Trading Score: 68 | |
| Day Percent Change: 1.18% Day Change: 0.17 | |
| Week Change: 2.24% Year-to-date Change: 0.0% | |
| NTGR Links: Profile News Message Board | |
| Charts:- Daily , Weekly | |
| Add NTGR to Watchlist: View: Get Complete NTGR Trend Analysis ➞ | |
 | TCX Tucows Inc. |
| Sector: Technology | |
| SubSector: Internet Information Providers | |
| MarketCap: 557.78 Millions | |
| Recent Price: 17.60 Smart Investing & Trading Score: 54 | |
| Day Percent Change: -0.11% Day Change: -0.02 | |
| Week Change: 0.51% Year-to-date Change: -34.8% | |
| TCX Links: Profile News Message Board | |
| Charts:- Daily , Weekly | |
| Add TCX to Watchlist: View: Get Complete TCX Trend Analysis ➞ | |
 | SCSC ScanSource, Inc. |
| Sector: Technology | |
| SubSector: Technical & System Software | |
| MarketCap: 541 Millions | |
| Recent Price: 44.45 Smart Investing & Trading Score: 100 | |
| Day Percent Change: 7.16% Day Change: 2.97 | |
| Week Change: 7.42% Year-to-date Change: 12.2% | |
| SCSC Links: Profile News Message Board | |
| Charts:- Daily , Weekly | |
| Add SCSC to Watchlist: View: Get Complete SCSC Trend Analysis ➞ | |
 | HLIT Harmonic Inc. |
| Sector: Technology | |
| SubSector: Communication Equipment | |
| MarketCap: 533.539 Millions | |
| Recent Price: 9.58 Smart Investing & Trading Score: 17 | |
| Day Percent Change: -1.24% Day Change: -0.12 | |
| Week Change: -1.03% Year-to-date Change: -26.5% | |
| HLIT Links: Profile News Message Board | |
| Charts:- Daily , Weekly | |
| Add HLIT to Watchlist: View: Get Complete HLIT Trend Analysis ➞ | |
 | UCTT Ultra Clean Holdings, Inc. |
| Sector: Technology | |
| SubSector: Semiconductor Equipment & Materials | |
| MarketCap: 528.518 Millions | |
| Recent Price: 39.75 Smart Investing & Trading Score: 48 | |
| Day Percent Change: 3.49% Day Change: 1.34 | |
| Week Change: 1.95% Year-to-date Change: 16.4% | |
| UCTT Links: Profile News Message Board | |
| Charts:- Daily , Weekly | |
| Add UCTT to Watchlist: View: Get Complete UCTT Trend Analysis ➞ | |
 | COHU Cohu, Inc. |
| Sector: Technology | |
| SubSector: Semiconductor Equipment & Materials | |
| MarketCap: 519.518 Millions | |
| Recent Price: 29.95 Smart Investing & Trading Score: 42 | |
| Day Percent Change: 3.03% Day Change: 0.88 | |
| Week Change: 4.07% Year-to-date Change: -15.4% | |
| COHU Links: Profile News Message Board | |
| Charts:- Daily , Weekly | |
| Add COHU to Watchlist: View: Get Complete COHU Trend Analysis ➞ | |
 | CNDT Conduent Incorporated |
| Sector: Technology | |
| SubSector: Information Technology Services | |
| MarketCap: 514.968 Millions | |
| Recent Price: 3.03 Smart Investing & Trading Score: 32 | |
| Day Percent Change: -0.66% Day Change: -0.02 | |
| Week Change: -0.98% Year-to-date Change: -17.0% | |
| CNDT Links: Profile News Message Board | |
| Charts:- Daily , Weekly | |
| Add CNDT to Watchlist: View: Get Complete CNDT Trend Analysis ➞ | |
 | LAW CS Disco, Inc. |
| Sector: Technology | |
| SubSector: Software - Application | |
| MarketCap: 505 Millions | |
| Recent Price: 7.73 Smart Investing & Trading Score: 27 | |
| Day Percent Change: 0.13% Day Change: 0.01 | |
| Week Change: 3.48% Year-to-date Change: 1.2% | |
| LAW Links: Profile News Message Board | |
| Charts:- Daily , Weekly | |
| Add LAW to Watchlist: View: Get Complete LAW Trend Analysis ➞ | |
 | ACLS Axcelis Technologies, Inc. |
| Sector: Technology | |
| SubSector: Semiconductor Equipment & Materials | |
| MarketCap: 498.518 Millions | |
| Recent Price: 97.24 Smart Investing & Trading Score: 27 | |
| Day Percent Change: 0.29% Day Change: 0.28 | |
| Week Change: 2.58% Year-to-date Change: -25.0% | |
| ACLS Links: Profile News Message Board | |
| Charts:- Daily , Weekly | |
| Add ACLS to Watchlist: View: Get Complete ACLS Trend Analysis ➞ | |
 | NOTE FiscalNote Holdings, Inc. |
| Sector: Technology | |
| SubSector: Information Technology Services | |
| MarketCap: 493 Millions | |
| Recent Price: 1.20 Smart Investing & Trading Score: 27 | |
| Day Percent Change: 2.56% Day Change: 0.03 | |
| Week Change: 4.35% Year-to-date Change: 2.6% | |
| NOTE Links: Profile News Message Board | |
| Charts:- Daily , Weekly | |
| Add NOTE to Watchlist: View: Get Complete NOTE Trend Analysis ➞ | |
 | EVH Evolent Health, Inc. |
| Sector: Technology | |
| SubSector: Healthcare Information Services | |
| MarketCap: 486.755 Millions | |
| Recent Price: 30.13 Smart Investing & Trading Score: 65 | |
| Day Percent Change: 0.90% Day Change: 0.27 | |
| Week Change: 2.1% Year-to-date Change: -8.8% | |
| EVH Links: Profile News Message Board | |
| Charts:- Daily , Weekly | |
| Add EVH to Watchlist: View: Get Complete EVH Trend Analysis ➞ | |
 | GSAT Globalstar, Inc. |
| Sector: Technology | |
| SubSector: Wireless Communications | |
| MarketCap: 485.127 Millions | |
| Recent Price: 1.30 Smart Investing & Trading Score: 42 | |
| Day Percent Change: 3.17% Day Change: 0.04 | |
| Week Change: 2.36% Year-to-date Change: -33.0% | |
| GSAT Links: Profile News Message Board | |
| Charts:- Daily , Weekly | |
| Add GSAT to Watchlist: View: Get Complete GSAT Trend Analysis ➞ | |
 | VECO Veeco Instruments Inc. |
| Sector: Technology | |
| SubSector: Semiconductor Equipment & Materials | |
| MarketCap: 450.718 Millions | |
| Recent Price: 33.73 Smart Investing & Trading Score: 51 | |
| Day Percent Change: 3.02% Day Change: 0.99 | |
| Week Change: 3.53% Year-to-date Change: 8.7% | |
| VECO Links: Profile News Message Board | |
| Charts:- Daily , Weekly | |
| Add VECO to Watchlist: View: Get Complete VECO Trend Analysis ➞ | |
 | IIIV i3 Verticals, Inc. |
| Sector: Technology | |
| SubSector: Business Software & Services | |
| MarketCap: 448.458 Millions | |
| Recent Price: 23.47 Smart Investing & Trading Score: 95 | |
| Day Percent Change: 4.22% Day Change: 0.95 | |
| Week Change: 5.15% Year-to-date Change: 10.9% | |
| IIIV Links: Profile News Message Board | |
| Charts:- Daily , Weekly | |
| Add IIIV to Watchlist: View: Get Complete IIIV Trend Analysis ➞ | |
 | LASR nLIGHT, Inc. |
| Sector: Technology | |
| SubSector: Semiconductor - Broad Line | |
| MarketCap: 445.642 Millions | |
| Recent Price: 10.95 Smart Investing & Trading Score: 32 | |
| Day Percent Change: 1.67% Day Change: 0.18 | |
| Week Change: 0.74% Year-to-date Change: -18.9% | |
| LASR Links: Profile News Message Board | |
| Charts:- Daily , Weekly | |
| Add LASR to Watchlist: View: Get Complete LASR Trend Analysis ➞ | |
 | ACMR ACM Research, Inc. |
| Sector: Technology | |
| SubSector: Semiconductor Equipment & Materials | |
| MarketCap: 438.718 Millions | |
| Recent Price: 27.39 Smart Investing & Trading Score: 56 | |
| Day Percent Change: 6.37% Day Change: 1.64 | |
| Week Change: 9.47% Year-to-date Change: 40.2% | |
| ACMR Links: Profile News Message Board | |
| Charts:- Daily , Weekly | |
| Add ACMR to Watchlist: View: Get Complete ACMR Trend Analysis ➞ | |
 | APPS Digital Turbine, Inc. |
| Sector: Technology | |
| SubSector: Application Software | |
| MarketCap: 437.262 Millions | |
| Recent Price: 1.94 Smart Investing & Trading Score: 59 | |
| Day Percent Change: 4.30% Day Change: 0.08 | |
| Week Change: 4.86% Year-to-date Change: -71.7% | |
| APPS Links: Profile News Message Board | |
| Charts:- Daily , Weekly | |
| Add APPS to Watchlist: View: Get Complete APPS Trend Analysis ➞ | |
 | FRGE Forge Global Holdings, Inc. |
| Sector: Technology | |
| SubSector: Software - Application | |
| MarketCap: 426 Millions | |
| Recent Price: 1.97 Smart Investing & Trading Score: 73 | |
| Day Percent Change: 2.60% Day Change: 0.05 | |
| Week Change: 5.91% Year-to-date Change: -44.8% | |
| FRGE Links: Profile News Message Board | |
| Charts:- Daily , Weekly | |
| Add FRGE to Watchlist: View: Get Complete FRGE Trend Analysis ➞ | |
 | QNST QuinStreet, Inc. |
| Sector: Technology | |
| SubSector: Internet Software & Services | |
| MarketCap: 411.791 Millions | |
| Recent Price: 17.34 Smart Investing & Trading Score: 90 | |
| Day Percent Change: 1.49% Day Change: 0.26 | |
| Week Change: 3.18% Year-to-date Change: 35.2% | |
| QNST Links: Profile News Message Board | |
| Charts:- Daily , Weekly | |
| Add QNST to Watchlist: View: Get Complete QNST Trend Analysis ➞ | |
 | ICHR Ichor Holdings, Ltd. |
| Sector: Technology | |
| SubSector: Semiconductor Equipment & Materials | |
| MarketCap: 409.018 Millions | |
| Recent Price: 37.54 Smart Investing & Trading Score: 56 | |
| Day Percent Change: 3.79% Day Change: 1.37 | |
| Week Change: 1.82% Year-to-date Change: 11.6% | |
| ICHR Links: Profile News Message Board | |
| Charts:- Daily , Weekly | |
| Add ICHR to Watchlist: View: Get Complete ICHR Trend Analysis ➞ | |
 | VLD Velo3D, Inc. |
| Sector: Technology | |
| SubSector: Computer Hardware | |
| MarketCap: 404 Millions | |
| Recent Price: 0.24 Smart Investing & Trading Score: 20 | |
| Day Percent Change: -0.61% Day Change: 0.00 | |
| Week Change: -2.2% Year-to-date Change: -37.7% | |
| VLD Links: Profile News Message Board | |
| Charts:- Daily , Weekly | |
| Add VLD to Watchlist: View: Get Complete VLD Trend Analysis ➞ | |
 | SITM SiTime Corporation |
| Sector: Technology | |
| SubSector: Semiconductor - Specialized | |
| MarketCap: 403.76 Millions | |
| Recent Price: 74.56 Smart Investing & Trading Score: 45 | |
| Day Percent Change: 1.15% Day Change: 0.85 | |
| Week Change: 1.55% Year-to-date Change: -38.9% | |
| SITM Links: Profile News Message Board | |
| Charts:- Daily , Weekly | |
| Add SITM to Watchlist: View: Get Complete SITM Trend Analysis ➞ | |
| For tabular summary view of above stock list: Summary View ➞ 0 - 25 , 25 - 50 , 50 - 75 , 75 - 100 , 100 - 125 , 125 - 150 , 150 - 175 , 175 - 200 , 200 - 225 , 225 - 250 , 250 - 275 | ||
| Click To Change The Sort Order: By Market Cap or Company Size Performance: Year-to-date, Week and Day | |
| Select Chart Type: | ||
| Too many stocks? View smallcap stocks filtered by marketcap & sector |
| Marketcap: All SmallCap Stocks (default-no microcap), Large, Mid-Range, Small & MicroCap |
| Sector: Tech, Finance, Energy, Staples, Retail, Industrial, Materials, Utilities & Medical |
|
Best Stocks Today 12Stocks.com |
© 2024 12Stocks.com Terms & Conditions Privacy Contact Us
All Information Provided Only For Education And Not To Be Used For Investing or Trading. See Terms & Conditions


One More Thing ... Get Best Stocks Delivered Daily!
Never Ever Miss A Move With Our Top Ten Stocks Lists
Find Best Stocks In Any Market - Bull or Bear Market
Take A Peek At Our Top Ten Stocks Lists: Daily, Weekly, Year-to-Date & Top Trends
Find Best Stocks In Any Market - Bull or Bear Market
Take A Peek At Our Top Ten Stocks Lists: Daily, Weekly, Year-to-Date & Top Trends
Smallcap Stocks With Best Up Trends [0-bearish to 100-bullish]: Hibbett Sports[100], Braemar Hotels[100], Akoustis [100], FTAI Infrastructure[100], Vertex Energy[100], AZZ [100], Day One[100], Oscar Health[100], Mueller Industries[100], ScanSource [100], Gannett Co[100]
Best Smallcap Stocks Year-to-Date:
Janux [364.03%], Viking [248.9%], Alpine Immune[239.02%], Longboard [231.75%], Avidity Biosciences[178.1%], Arcutis Bio[170.59%], Super Micro[168.02%], Vera [154.91%], Hippo [134.14%], Y-mAbs [124.93%], Stoke [113.88%] Best Smallcap Stocks This Week:
Matterport [164.37%], Seres [35.74%], Riot Blockchain[29.79%], Cipher Mining[25%], ProKidney [24.75%], Braemar Hotels[21.3%], Akoustis [21.29%], Hibbett Sports[21.1%], Assertio [19.28%], BigBear.ai [17.93%], Marathon Patent[17.82%] Best Smallcap Stocks Daily:
Virgin Galactic[22.38%], Seres [21.68%], Marathon Patent[20.04%], Hibbett Sports[18.84%], Generation Bio[16.01%], IGM Biosciences[14.07%], FuelCell Energy[13.07%], Braemar Hotels[12.96%], SES AI[12.17%], NuScale Power[11.16%], Cutera [10.82%]