
 Login Sign Up


| |||||
 |  | ||||

| 12Stocks.com Market Intelligence |
Best SmallCap Stocks
|
| In a hurry? Small Cap Stock Lists: Performance Trends Table, Stock Charts
Sort Small Cap stocks: Daily, Weekly, Year-to-Date, Market Cap & Trends. Filter Small Cap stocks list by sector: Show all, Tech, Finance, Energy, Staples, Retail, Industrial, Materials, Utilities and HealthCare Filter Small Cap stocks list by size: All Large Medium Small and MicroCap |
| 12Stocks.com Small Cap Stocks Performances & Trends Daily | |||||||||
|
|  The overall Smart Investing & Trading Score is 23 (0-bearish to 100-bullish) which puts Small Cap index in short term bearish to neutral trend. The Smart Investing & Trading Score from previous trading session is 13 and hence an improvement of trend.
| ||||||||
Here are the Smart Investing & Trading Scores of the most requested small cap stocks at 12Stocks.com (click stock name for detailed review):
|


| 12Stocks.com: Investing in Smallcap Index with Stocks | |
|
The following table helps investors and traders sort through current performance and trends (as measured by Smart Investing & Trading Score) of various
stocks in the Smallcap Index. Quick View: Move mouse or cursor over stock symbol (ticker) to view short-term technical chart and over stock name to view long term chart. Click on  to add stock symbol to your watchlist and to add stock symbol to your watchlist and  to view watchlist. Click on any ticker or stock name for detailed market intelligence report for that stock. to view watchlist. Click on any ticker or stock name for detailed market intelligence report for that stock. |
12Stocks.com Performance of Stocks in Smallcap Index
| Ticker | Stock Name | Watchlist | Category | Recent Price | Smart Investing & Trading Score | Change % | YTD Change% |
| HEAR | Turtle Beach |   | Technology | 14.88 | 36 | -1.06% | 35.89% |
| CELC | Celcuity | | Health Care | 16.40 | 36 | -3.59% | 11.87% |
| ASRT | Assertio | | Health Care | 0.76 | 10 | -2.95% | -29.91% |
| PRTS | U.S. Auto | | Consumer Staples | 1.29 | 10 | -1.53% | -59.18% |
| HBIO | Harvard Bioscience | | Health Care | 3.97 | 0 | -2.93% | -25.79% |
| ALDX | Aldeyra | | Health Care | 3.98 | 58 | 0.25% | 13.39% |
| BXC | BlueLinx | | Services & Goods | 109.69 | 0 | -0.28% | -3.19% |
| ATOM | Atomera | | Technology | 5.75 | 10 | 1.95% | -17.97% |
| AMRK | A-Mark Precious | | Financials | 36.88 | 61 | -1.94% | 21.92% |
| HOV | Hovnanian Enterprises | | Industrials | 129.03 | 7 | 0.41% | -17.09% |
| EGY | VAALCO Energy | | Energy | 6.64 | 36 | -1.34% | 47.88% |
| TUSK | Mammoth Energy | | Energy | 3.23 | 18 | 2.70% | -27.47% |
| LINC | Loln Educational | | Services & Goods | 9.59 | 36 | -1.03% | -4.48% |
| BW | Babcock & Wilcox Enterprises | | Industrials | 0.97 | 10 | -3.16% | -33.67% |
| PBPB | Potbelly | | Services & Goods | 10.29 | 32 | 1.88% | -1.25% |
| TTI | TETRA | | Energy | 4.34 | 26 | 0.00% | -3.98% |
| CVGI | Commercial Vehicle | | Services & Goods | 6.20 | 10 | -0.88% | -11.63% |
| CLPT | ClearPoint Neuro | | Health Care | 5.39 | 0 | -2.53% | -20.91% |
| EYEN | Eyenovia | | Health Care | 0.54 | 10 | -0.15% | -74.23% |
| VERI | Veritone | | Technology | 3.86 | 46 | 2.12% | 112.09% |
| LXU | LSB Industries | | Materials | 7.96 | 36 | 0.13% | -14.50% |
| REI | Ring Energy | | Energy | 1.97 | 36 | -1.99% | 34.93% |
| TRVI | Trevi | | Health Care | 2.68 | 48 | 3.88% | 100.00% |
| KFS | Kingsway Financial | | Financials | 8.43 | 25 | -0.24% | 0.36% |
| RELL | Richardson Electronics | | Services & Goods | 10.13 | 90 | 2.74% | -24.12% |
| For chart view version of above stock list: Chart View ➞ 0 - 25 , 25 - 50 , 50 - 75 , 75 - 100 , 100 - 125 , 125 - 150 , 150 - 175 , 175 - 200 | ||
 | Click To Change The Sort Order: By Market Cap or Company Size Performance: Year-to-date, Week and Day |  |
| Too many stocks? View smallcap stocks filtered by marketcap & sector |
| Marketcap: All SmallCap Stocks (default-no microcap), Large, Mid-Range, Small |
| Smallcap Sector: Tech, Finance, Energy, Staples, Retail, Industrial, Materials, & Medical |
|
Get the most comprehensive stock market coverage daily at 12Stocks.com ➞ Best Stocks Today ➞ Best Stocks Weekly ➞ Best Stocks Year-to-Date ➞ Best Stocks Trends ➞  Best Stocks Today 12Stocks.com Best Nasdaq Stocks ➞ Best S&P 500 Stocks ➞ Best Tech Stocks ➞ Best Biotech Stocks ➞ |
| Detailed Overview of SmallCap Stocks |
| SmallCap Technical Overview, Leaders & Laggards, Top SmallCap ETF Funds & Detailed SmallCap Stocks List, Charts, Trends & More |
| Smallcap: Technical Analysis, Trends & YTD Performance | |
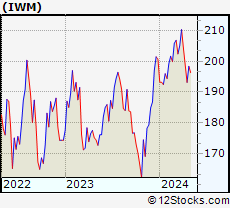
| SmallCap segment as represented by
IWM, an exchange-traded fund [ETF], holds basket of thousands of smallcap stocks from across all major sectors of the US stock market. The smallcap index (contains stocks like Riverbed & Sotheby's) is down by -3.92% and is currently underperforming the overall market by -8.11% year-to-date. Below is a quick view of technical charts and trends: | |
 IWM Weekly Chart |
|
| Long Term Trend: Not Good | |
| Medium Term Trend: Not Good | |
 IWM Daily Chart |
|
| Short Term Trend: Not Good | |
| Overall Trend Score: 23 | |
| YTD Performance: -3.92% | |
| **Trend Scores & Views Are Only For Educational Purposes And Not For Investing | |
| 12Stocks.com: Top Performing Small Cap Index Stocks | ||||||||||||||||||||||||||||||||||||||||||||||||
 The top performing Small Cap Index stocks year to date are
Now, more recently, over last week, the top performing Small Cap Index stocks on the move are


|
||||||||||||||||||||||||||||||||||||||||||||||||
| 12Stocks.com: Investing in Smallcap Index using Exchange Traded Funds | |
|
The following table shows list of key exchange traded funds (ETF) that
help investors track Smallcap index. The following list also includes leveraged ETF funds that track twice or thrice the daily returns of Smallcap indices. Short or inverse ETF funds move in the opposite direction to the index they track and are useful during market pullbacks or during bear markets. Quick View: Move mouse or cursor over ETF symbol (ticker) to view short-term technical chart and over ETF name to view long term chart. Click on ticker or stock name for detailed view. Click on to add stock symbol to your watchlist and to view watchlist. |
12Stocks.com List of ETFs that track Smallcap Index
| Ticker | ETF Name | Watchlist | Recent Price | Smart Investing & Trading Score | Change % | Week % | Year-to-date % |
| IWM | iShares Russell 2000 | | 192.84 | 23 | -0.08 | -2.94 | -3.92% |
| IJR | iShares Core S&P Small-Cap | | 102.34 | 31 | 0.21 | -2.08 | -5.46% |
| VTWO | Vanguard Russell 2000 ETF | | 77.95 | 23 | -0.13 | -2.95 | -3.88% |
| IWN | iShares Russell 2000 Value | | 146.33 | 10 | 0.21 | -2.69 | -5.79% |
| IJS | iShares S&P Small-Cap 600 Value | | 94.51 | 10 | 0.41 | -1.73 | -8.31% |
| IWO | iShares Russell 2000 Growth | | 246.94 | 36 | -0.44 | -3.3 | -2.09% |
| IJT | iShares S&P Small-Cap 600 Growth | | 121.57 | 23 | -0.22 | -2.57 | -2.85% |
| XSLV | PowerShares S&P SmallCap Low Volatil ETF | | 41.65 | 25 | 0.56 | -1.05 | -5.66% |
| SAA | ProShares Ultra SmallCap600 | | 21.62 | 10 | -0.18 | -4.17 | -13.35% |
| SMLV | SPDR SSGA US Small Cap Low Volatil ETF | | 103.83 | 10 | 0.16 | -1.13 | -7.72% |
| SBB | ProShares Short SmallCap600 | | 16.98 | 95 | 0.77 | 2.62 | 6.59% |
| SDD | ProShares UltraShort SmallCap600 | | 20.69 | 83 | 0.44 | 4.33 | 12.28% |
| 12Stocks.com: Charts, Trends, Fundamental Data and Performances of SmallCap Stocks | |
|
We now take in-depth look at all SmallCap stocks including charts, multi-period performances and overall trends (as measured by Smart Investing & Trading Score). One can sort SmallCap stocks (click link to choose) by Daily, Weekly and by Year-to-Date performances. Also, one can sort by size of the company or by market capitalization. |
| Select Your Default Chart Type: | |||||
| |||||
| Click on stock symbol or name for detailed view. Click on to add stock symbol to your watchlist and to view watchlist. Quick View: Move mouse or cursor over "Daily" to quickly view daily technical stock chart and over "Weekly" to view weekly technical stock chart. | |||||

 | HEAR Turtle Beach Corporation |
| Sector: Technology | |
| SubSector: Communication Equipment | |
| MarketCap: 73.0539 Millions | |
| Recent Price: 14.88 Smart Investing & Trading Score: 36 | |
| Day Percent Change: -1.06% Day Change: -0.16 | |
| Week Change: -8.82% Year-to-date Change: 35.9% | |
| HEAR Links: Profile News Message Board | |
| Charts:- Daily , Weekly | |
| Add HEAR to Watchlist: View: Get Complete HEAR Trend Analysis ➞ | |
 | CELC Celcuity Inc. |
| Sector: Health Care | |
| SubSector: Medical Laboratories & Research | |
| MarketCap: 70.53 Millions | |
| Recent Price: 16.40 Smart Investing & Trading Score: 36 | |
| Day Percent Change: -3.59% Day Change: -0.61 | |
| Week Change: -10.43% Year-to-date Change: 11.9% | |
| CELC Links: Profile News Message Board | |
| Charts:- Daily , Weekly | |
| Add CELC to Watchlist: View: Get Complete CELC Trend Analysis ➞ | |
 | ASRT Assertio Therapeutics, Inc. |
| Sector: Health Care | |
| SubSector: Drugs - Generic | |
| MarketCap: 65.8185 Millions | |
| Recent Price: 0.76 Smart Investing & Trading Score: 10 | |
| Day Percent Change: -2.95% Day Change: -0.02 | |
| Week Change: -12.81% Year-to-date Change: -29.9% | |
| ASRT Links: Profile News Message Board | |
| Charts:- Daily , Weekly | |
| Add ASRT to Watchlist: View: Get Complete ASRT Trend Analysis ➞ | |
 | PRTS U.S. Auto Parts Network, Inc. |
| Sector: Consumer Staples | |
| SubSector: Auto Parts | |
| MarketCap: 65.0939 Millions | |
| Recent Price: 1.29 Smart Investing & Trading Score: 10 | |
| Day Percent Change: -1.53% Day Change: -0.02 | |
| Week Change: -9.15% Year-to-date Change: -59.2% | |
| PRTS Links: Profile News Message Board | |
| Charts:- Daily , Weekly | |
| Add PRTS to Watchlist: View: Get Complete PRTS Trend Analysis ➞ | |
 | HBIO Harvard Bioscience, Inc. |
| Sector: Health Care | |
| SubSector: Medical Instruments & Supplies | |
| MarketCap: 63.086 Millions | |
| Recent Price: 3.97 Smart Investing & Trading Score: 0 | |
| Day Percent Change: -2.93% Day Change: -0.12 | |
| Week Change: -6.37% Year-to-date Change: -25.8% | |
| HBIO Links: Profile News Message Board | |
| Charts:- Daily , Weekly | |
| Add HBIO to Watchlist: View: Get Complete HBIO Trend Analysis ➞ | |
 | ALDX Aldeyra Therapeutics, Inc. |
| Sector: Health Care | |
| SubSector: Biotechnology | |
| MarketCap: 61.2785 Millions | |
| Recent Price: 3.98 Smart Investing & Trading Score: 58 | |
| Day Percent Change: 0.25% Day Change: 0.01 | |
| Week Change: -6.35% Year-to-date Change: 13.4% | |
| ALDX Links: Profile News Message Board | |
| Charts:- Daily , Weekly | |
| Add ALDX to Watchlist: View: Get Complete ALDX Trend Analysis ➞ | |
 | BXC BlueLinx Holdings Inc. |
| Sector: Services & Goods | |
| SubSector: Building Materials Wholesale | |
| MarketCap: 60.7243 Millions | |
| Recent Price: 109.69 Smart Investing & Trading Score: 0 | |
| Day Percent Change: -0.28% Day Change: -0.31 | |
| Week Change: -6.65% Year-to-date Change: -3.2% | |
| BXC Links: Profile News Message Board | |
| Charts:- Daily , Weekly | |
| Add BXC to Watchlist: View: Get Complete BXC Trend Analysis ➞ | |
 | ATOM Atomera Incorporated |
| Sector: Technology | |
| SubSector: Semiconductor Equipment & Materials | |
| MarketCap: 60.6918 Millions | |
| Recent Price: 5.75 Smart Investing & Trading Score: 10 | |
| Day Percent Change: 1.95% Day Change: 0.11 | |
| Week Change: -4.96% Year-to-date Change: -18.0% | |
| ATOM Links: Profile News Message Board | |
| Charts:- Daily , Weekly | |
| Add ATOM to Watchlist: View: Get Complete ATOM Trend Analysis ➞ | |
 | AMRK A-Mark Precious Metals, Inc. |
| Sector: Financials | |
| SubSector: Investment Brokerage - National | |
| MarketCap: 60.2805 Millions | |
| Recent Price: 36.88 Smart Investing & Trading Score: 61 | |
| Day Percent Change: -1.94% Day Change: -0.73 | |
| Week Change: -9.45% Year-to-date Change: 21.9% | |
| AMRK Links: Profile News Message Board | |
| Charts:- Daily , Weekly | |
| Add AMRK to Watchlist: View: Get Complete AMRK Trend Analysis ➞ | |
 | HOV Hovnanian Enterprises, Inc. |
| Sector: Industrials | |
| SubSector: Residential Construction | |
| MarketCap: 59.9106 Millions | |
| Recent Price: 129.03 Smart Investing & Trading Score: 7 | |
| Day Percent Change: 0.41% Day Change: 0.53 | |
| Week Change: -8.9% Year-to-date Change: -17.1% | |
| HOV Links: Profile News Message Board | |
| Charts:- Daily , Weekly | |
| Add HOV to Watchlist: View: Get Complete HOV Trend Analysis ➞ | |
 | EGY VAALCO Energy, Inc. |
| Sector: Energy | |
| SubSector: Independent Oil & Gas | |
| MarketCap: 59.5593 Millions | |
| Recent Price: 6.64 Smart Investing & Trading Score: 36 | |
| Day Percent Change: -1.34% Day Change: -0.09 | |
| Week Change: -5.28% Year-to-date Change: 47.9% | |
| EGY Links: Profile News Message Board | |
| Charts:- Daily , Weekly | |
| Add EGY to Watchlist: View: Get Complete EGY Trend Analysis ➞ | |
 | TUSK Mammoth Energy Services, Inc. |
| Sector: Energy | |
| SubSector: Oil & Gas Drilling & Exploration | |
| MarketCap: 59.5139 Millions | |
| Recent Price: 3.23 Smart Investing & Trading Score: 18 | |
| Day Percent Change: 2.70% Day Change: 0.08 | |
| Week Change: -1.37% Year-to-date Change: -27.5% | |
| TUSK Links: Profile News Message Board | |
| Charts:- Daily , Weekly | |
| Add TUSK to Watchlist: View: Get Complete TUSK Trend Analysis ➞ | |
 | LINC Lincoln Educational Services Corporation |
| Sector: Services & Goods | |
| SubSector: Education & Training Services | |
| MarketCap: 59.5006 Millions | |
| Recent Price: 9.59 Smart Investing & Trading Score: 36 | |
| Day Percent Change: -1.03% Day Change: -0.10 | |
| Week Change: -2.54% Year-to-date Change: -4.5% | |
| LINC Links: Profile News Message Board | |
| Charts:- Daily , Weekly | |
| Add LINC to Watchlist: View: Get Complete LINC Trend Analysis ➞ | |
 | BW Babcock & Wilcox Enterprises, Inc. |
| Sector: Industrials | |
| SubSector: Industrial Electrical Equipment | |
| MarketCap: 59.0879 Millions | |
| Recent Price: 0.97 Smart Investing & Trading Score: 10 | |
| Day Percent Change: -3.16% Day Change: -0.03 | |
| Week Change: -7.77% Year-to-date Change: -33.7% | |
| BW Links: Profile News Message Board | |
| Charts:- Daily , Weekly | |
| Add BW to Watchlist: View: Get Complete BW Trend Analysis ➞ | |
 | PBPB Potbelly Corporation |
| Sector: Services & Goods | |
| SubSector: Specialty Eateries | |
| MarketCap: 58.8 Millions | |
| Recent Price: 10.29 Smart Investing & Trading Score: 32 | |
| Day Percent Change: 1.88% Day Change: 0.19 | |
| Week Change: -1.72% Year-to-date Change: -1.3% | |
| PBPB Links: Profile News Message Board | |
| Charts:- Daily , Weekly | |
| Add PBPB to Watchlist: View: Get Complete PBPB Trend Analysis ➞ | |
 | TTI TETRA Technologies, Inc. |
| Sector: Energy | |
| SubSector: Oil & Gas Equipment & Services | |
| MarketCap: 56.9461 Millions | |
| Recent Price: 4.34 Smart Investing & Trading Score: 26 | |
| Day Percent Change: 0.00% Day Change: 0.00 | |
| Week Change: -6.26% Year-to-date Change: -4.0% | |
| TTI Links: Profile News Message Board | |
| Charts:- Daily , Weekly | |
| Add TTI to Watchlist: View: Get Complete TTI Trend Analysis ➞ | |
 | CVGI Commercial Vehicle Group, Inc. |
| Sector: Services & Goods | |
| SubSector: Auto Parts Wholesale | |
| MarketCap: 56.6 Millions | |
| Recent Price: 6.20 Smart Investing & Trading Score: 10 | |
| Day Percent Change: -0.88% Day Change: -0.05 | |
| Week Change: -1.51% Year-to-date Change: -11.6% | |
| CVGI Links: Profile News Message Board | |
| Charts:- Daily , Weekly | |
| Add CVGI to Watchlist: View: Get Complete CVGI Trend Analysis ➞ | |
 | CLPT ClearPoint Neuro, Inc. |
| Sector: Health Care | |
| SubSector: Medical Appliances & Equipment | |
| MarketCap: 55.108 Millions | |
| Recent Price: 5.39 Smart Investing & Trading Score: 0 | |
| Day Percent Change: -2.53% Day Change: -0.14 | |
| Week Change: -7.23% Year-to-date Change: -20.9% | |
| CLPT Links: Profile News Message Board | |
| Charts:- Daily , Weekly | |
| Add CLPT to Watchlist: View: Get Complete CLPT Trend Analysis ➞ | |
 | EYEN Eyenovia, Inc. |
| Sector: Health Care | |
| SubSector: Biotechnology | |
| MarketCap: 52.2785 Millions | |
| Recent Price: 0.54 Smart Investing & Trading Score: 10 | |
| Day Percent Change: -0.15% Day Change: 0.00 | |
| Week Change: -9.04% Year-to-date Change: -74.2% | |
| EYEN Links: Profile News Message Board | |
| Charts:- Daily , Weekly | |
| Add EYEN to Watchlist: View: Get Complete EYEN Trend Analysis ➞ | |
 | VERI Veritone, Inc. |
| Sector: Technology | |
| SubSector: Application Software | |
| MarketCap: 52.1662 Millions | |
| Recent Price: 3.86 Smart Investing & Trading Score: 46 | |
| Day Percent Change: 2.12% Day Change: 0.08 | |
| Week Change: -20.58% Year-to-date Change: 112.1% | |
| VERI Links: Profile News Message Board | |
| Charts:- Daily , Weekly | |
| Add VERI to Watchlist: View: Get Complete VERI Trend Analysis ➞ | |
 | LXU LSB Industries, Inc. |
| Sector: Materials | |
| SubSector: Chemicals - Major Diversified | |
| MarketCap: 51.7736 Millions | |
| Recent Price: 7.96 Smart Investing & Trading Score: 36 | |
| Day Percent Change: 0.13% Day Change: 0.01 | |
| Week Change: -2.45% Year-to-date Change: -14.5% | |
| LXU Links: Profile News Message Board | |
| Charts:- Daily , Weekly | |
| Add LXU to Watchlist: View: Get Complete LXU Trend Analysis ➞ | |
 | REI Ring Energy, Inc. |
| Sector: Energy | |
| SubSector: Oil & Gas Drilling & Exploration | |
| MarketCap: 50.8139 Millions | |
| Recent Price: 1.97 Smart Investing & Trading Score: 36 | |
| Day Percent Change: -1.99% Day Change: -0.04 | |
| Week Change: -5.29% Year-to-date Change: 34.9% | |
| REI Links: Profile News Message Board | |
| Charts:- Daily , Weekly | |
| Add REI to Watchlist: View: Get Complete REI Trend Analysis ➞ | |
 | TRVI Trevi Therapeutics, Inc. |
| Sector: Health Care | |
| SubSector: Biotechnology | |
| MarketCap: 50.6785 Millions | |
| Recent Price: 2.68 Smart Investing & Trading Score: 48 | |
| Day Percent Change: 3.88% Day Change: 0.10 | |
| Week Change: -8.22% Year-to-date Change: 100.0% | |
| TRVI Links: Profile News Message Board | |
| Charts:- Daily , Weekly | |
| Add TRVI to Watchlist: View: Get Complete TRVI Trend Analysis ➞ | |
 | KFS Kingsway Financial Services Inc. |
| Sector: Financials | |
| SubSector: Property & Casualty Insurance | |
| MarketCap: 47.5812 Millions | |
| Recent Price: 8.43 Smart Investing & Trading Score: 25 | |
| Day Percent Change: -0.24% Day Change: -0.02 | |
| Week Change: 2.31% Year-to-date Change: 0.4% | |
| KFS Links: Profile News Message Board | |
| Charts:- Daily , Weekly | |
| Add KFS to Watchlist: View: Get Complete KFS Trend Analysis ➞ | |
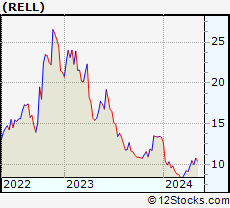 | RELL Richardson Electronics, Ltd. |
| Sector: Services & Goods | |
| SubSector: Electronics Wholesale | |
| MarketCap: 46.6 Millions | |
| Recent Price: 10.13 Smart Investing & Trading Score: 90 | |
| Day Percent Change: 2.74% Day Change: 0.27 | |
| Week Change: 3.47% Year-to-date Change: -24.1% | |
| RELL Links: Profile News Message Board | |
| Charts:- Daily , Weekly | |
| Add RELL to Watchlist: View: Get Complete RELL Trend Analysis ➞ | |
| For tabular summary view of above stock list: Summary View ➞ 0 - 25 , 25 - 50 , 50 - 75 , 75 - 100 , 100 - 125 , 125 - 150 , 150 - 175 , 175 - 200 | ||
| Click To Change The Sort Order: By Market Cap or Company Size Performance: Year-to-date, Week and Day | |
| Select Chart Type: | ||
| Too many stocks? View smallcap stocks filtered by marketcap & sector |
| Marketcap: All SmallCap Stocks (default-no microcap), Large, Mid-Range, Small & MicroCap |
| Sector: Tech, Finance, Energy, Staples, Retail, Industrial, Materials, Utilities & Medical |
|
Best Stocks Today 12Stocks.com |
© 2024 12Stocks.com Terms & Conditions Privacy Contact Us
All Information Provided Only For Education And Not To Be Used For Investing or Trading. See Terms & Conditions


One More Thing ... Get Best Stocks Delivered Daily!
Never Ever Miss A Move With Our Top Ten Stocks Lists
Find Best Stocks In Any Market - Bull or Bear Market
Take A Peek At Our Top Ten Stocks Lists: Daily, Weekly, Year-to-Date & Top Trends
Find Best Stocks In Any Market - Bull or Bear Market
Take A Peek At Our Top Ten Stocks Lists: Daily, Weekly, Year-to-Date & Top Trends
Smallcap Stocks With Best Up Trends [0-bearish to 100-bullish]: Badger Meter[100], Cullinan Oncology[100], Oscar Health[100], NextNav [100], EchoStar [100], Victory Capital[100], Macatawa Bank[100], IMAX [100], Envestnet [100], ALX Oncology[100], Argan [95]
Best Smallcap Stocks Year-to-Date:
Agenus [500.31%], CareMax [417.53%], Janux [348.12%], Viking [247.5%], Alpine Immune[238.5%], Super Micro[226.63%], Longboard [194.76%], Arcutis Bio[192.57%], Vera [161.3%], Avidity Biosciences[154.87%], Hippo [128.32%] Best Smallcap Stocks This Week:
Macatawa Bank[44.42%], 23andMe Holding[33.3%], ProKidney [32%], Snap One[29.73%], Vertex Energy[25.96%], ALX Oncology[20.64%], Vanda [20.63%], Expensify [18.37%], Badger Meter[16.72%], ContextLogic [15%], Cullinan Oncology[13.89%] Best Smallcap Stocks Daily:
23andMe Holding[65.91%], Vertex Energy[33.78%], Zura Bio[17.20%], Badger Meter[16.65%], ContextLogic [15.81%], Expensify [15.23%], Montrose Environmental[12.84%], Vaxxinity [10.05%], Cipher Mining[8.65%], FiscalNote [8.61%], Vuzix [8.15%]