
 Login Sign Up


| |||||
 |  | ||||

| 12Stocks.com Market Intelligence |
Best SmallCap Stocks
|
| In a hurry? Small Cap Stock Lists: Performance Trends Table, Stock Charts
Sort Small Cap stocks: Daily, Weekly, Year-to-Date, Market Cap & Trends. Filter Small Cap stocks list by sector: Show all, Tech, Finance, Energy, Staples, Retail, Industrial, Materials, Utilities and HealthCare Filter Small Cap stocks list by size: All Large Medium Small and MicroCap |
| 12Stocks.com Small Cap Stocks Performances & Trends Daily | |||||||||
|
|  The overall Smart Investing & Trading Score is 23 (0-bearish to 100-bullish) which puts Small Cap index in short term bearish to neutral trend. The Smart Investing & Trading Score from previous trading session is 13 and an improvement of trend continues.
| ||||||||
Here are the Smart Investing & Trading Scores of the most requested small cap stocks at 12Stocks.com (click stock name for detailed review):
|


| 12Stocks.com: Investing in Smallcap Index with Stocks | |
|
The following table helps investors and traders sort through current performance and trends (as measured by Smart Investing & Trading Score) of various
stocks in the Smallcap Index. Quick View: Move mouse or cursor over stock symbol (ticker) to view short-term technical chart and over stock name to view long term chart. Click on  to add stock symbol to your watchlist and to add stock symbol to your watchlist and  to view watchlist. Click on any ticker or stock name for detailed market intelligence report for that stock. to view watchlist. Click on any ticker or stock name for detailed market intelligence report for that stock. |
12Stocks.com Performance of Stocks in Smallcap Index
| Ticker | Stock Name | Watchlist | Category | Recent Price | Smart Investing & Trading Score | Change % | YTD Change% |
| FLR | Fluor |   | Industrials | 39.21 | 36 | 0.00% | 0.10% |
| PL | Planet Labs | | Industrials | 1.75 | 30 | -4.37% | -29.44% |
| CRS | Carpenter | | Industrials | 78.04 | 69 | -1.69% | 10.23% |
| EVLV | Evolv | | Industrials | 3.83 | 46 | -2.79% | -18.86% |
| HRT | HireRight | | Industrials | 14.24 | 61 | -0.07% | 5.87% |
| CDRE | Cadre | | Industrials | 32.86 | 10 | -1.53% | -0.33% |
| CODI | Compass Diversified | | Industrials | 22.81 | 68 | 2.15% | 1.60% |
| KAI | Kadant | | Industrials | 281.99 | 10 | -0.67% | 0.60% |
| RGR | Sturm Ruger | | Industrials | 46.75 | 88 | 1.37% | 2.86% |
| GTLS | Chart Industries | | Industrials | 148.04 | 54 | -0.36% | 8.59% |
| AZZ | AZZ | | Industrials | 74.80 | 31 | -0.90% | 28.77% |
| NPO | EnPro Industries | | Industrials | 149.02 | 23 | -0.16% | -4.93% |
| ASTE | Astec Industries | | Industrials | 42.77 | 68 | 2.13% | 14.97% |
| GRC | Gorman-Rupp | | Industrials | 36.02 | 43 | -0.06% | 1.38% |
| GVA | Granite Construction | | Industrials | 53.44 | 41 | -0.45% | 5.07% |
| AGX | Argan | | Industrials | 61.92 | 95 | 1.52% | 32.34% |
| SXI | Standex | | Industrials | 167.54 | 36 | 0.41% | 5.78% |
| GLDD | Great Lakes | | Industrials | 7.45 | 10 | 0.95% | -2.99% |
| GFF | Griffon | | Industrials | 65.97 | 36 | 1.18% | 8.24% |
| AMPX | Amprius | | Industrials | 1.76 | 32 | -4.09% | -64.87% |
| CMCO | Columbus McKinnon | | Industrials | 40.97 | 56 | 0.74% | 5.00% |
| AIR | AAR | | Industrials | 64.12 | 90 | 1.73% | 2.76% |
| OFLX | Omega Flex | | Industrials | 67.00 | 20 | 0.22% | -4.98% |
| GMS | GMS | | Industrials | 90.25 | 36 | 0.19% | 9.49% |
| DY | Dycom Industries | | Industrials | 135.56 | 54 | 0.63% | 17.79% |
| For chart view version of above stock list: Chart View ➞ 0 - 25 , 25 - 50 , 50 - 75 , 75 - 100 , 100 - 125 , 125 - 150 , 150 - 175 | ||
 | Click To Change The Sort Order: By Market Cap or Company Size Performance: Year-to-date, Week and Day |  |
| Too many stocks? View smallcap stocks filtered by marketcap & sector |
| Marketcap: All SmallCap Stocks (default-no microcap), Large, Mid-Range, Small |
| Smallcap Sector: Tech, Finance, Energy, Staples, Retail, Industrial, Materials, & Medical |
|
Get the most comprehensive stock market coverage daily at 12Stocks.com ➞ Best Stocks Today ➞ Best Stocks Weekly ➞ Best Stocks Year-to-Date ➞ Best Stocks Trends ➞  Best Stocks Today 12Stocks.com Best Nasdaq Stocks ➞ Best S&P 500 Stocks ➞ Best Tech Stocks ➞ Best Biotech Stocks ➞ |
| Detailed Overview of SmallCap Stocks |
| SmallCap Technical Overview, Leaders & Laggards, Top SmallCap ETF Funds & Detailed SmallCap Stocks List, Charts, Trends & More |
| Smallcap: Technical Analysis, Trends & YTD Performance | |
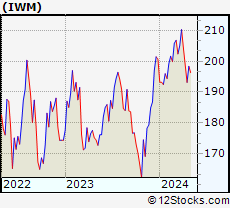
| SmallCap segment as represented by
IWM, an exchange-traded fund [ETF], holds basket of thousands of smallcap stocks from across all major sectors of the US stock market. The smallcap index (contains stocks like Riverbed & Sotheby's) is down by -3.77% and is currently underperforming the overall market by -7.15% year-to-date. Below is a quick view of technical charts and trends: | |
 IWM Weekly Chart |
|
| Long Term Trend: Good | |
| Medium Term Trend: Not Good | |
 IWM Daily Chart |
|
| Short Term Trend: Deteriorating | |
| Overall Trend Score: 23 | |
| YTD Performance: -3.77% | |
| **Trend Scores & Views Are Only For Educational Purposes And Not For Investing | |
| 12Stocks.com: Top Performing Small Cap Index Stocks | ||||||||||||||||||||||||||||||||||||||||||||||||
 The top performing Small Cap Index stocks year to date are
Now, more recently, over last week, the top performing Small Cap Index stocks on the move are


|
||||||||||||||||||||||||||||||||||||||||||||||||
| 12Stocks.com: Investing in Smallcap Index using Exchange Traded Funds | |
|
The following table shows list of key exchange traded funds (ETF) that
help investors track Smallcap index. The following list also includes leveraged ETF funds that track twice or thrice the daily returns of Smallcap indices. Short or inverse ETF funds move in the opposite direction to the index they track and are useful during market pullbacks or during bear markets. Quick View: Move mouse or cursor over ETF symbol (ticker) to view short-term technical chart and over ETF name to view long term chart. Click on ticker or stock name for detailed view. Click on to add stock symbol to your watchlist and to view watchlist. |
12Stocks.com List of ETFs that track Smallcap Index
| Ticker | ETF Name | Watchlist | Recent Price | Smart Investing & Trading Score | Change % | Week % | Year-to-date % |
| IWM | iShares Russell 2000 | | 193.14 | 23 | 0.16 | -2.79 | -3.77% |
| IJR | iShares Core S&P Small-Cap | | 103.22 | 31 | 0.86 | -1.23 | -4.65% |
| IWN | iShares Russell 2000 Value | | 147.78 | 31 | 0.99 | -1.73 | -4.86% |
| VTWO | Vanguard Russell 2000 ETF | | 78.08 | 23 | 0.17 | -2.79 | -3.72% |
| IWO | iShares Russell 2000 Growth | | 245.29 | 23 | -0.67 | -3.94 | -2.75% |
| IJS | iShares S&P Small-Cap 600 Value | | 95.61 | 32 | 1.16 | -0.58 | -7.24% |
| IJT | iShares S&P Small-Cap 600 Growth | | 122.21 | 31 | 0.53 | -2.06 | -2.34% |
| XSLV | PowerShares S&P SmallCap Low Volatil ETF | | 42.18 | 42 | 1.27 | 0.21 | -4.46% |
| SAA | ProShares Ultra SmallCap600 | | 21.80 | 18 | 0.83 | -3.37 | -12.63% |
| SMLV | SPDR SSGA US Small Cap Low Volatil ETF | | 106.09 | 37 | 2.18 | 1.03 | -5.71% |
| SDD | ProShares UltraShort SmallCap600 | | 20.34 | 76 | -1.69 | 2.57 | 10.38% |
| SBB | ProShares Short SmallCap600 | | 16.84 | 76 | -0.82 | 1.77 | 5.71% |
| 12Stocks.com: Charts, Trends, Fundamental Data and Performances of SmallCap Stocks | |
|
We now take in-depth look at all SmallCap stocks including charts, multi-period performances and overall trends (as measured by Smart Investing & Trading Score). One can sort SmallCap stocks (click link to choose) by Daily, Weekly and by Year-to-Date performances. Also, one can sort by size of the company or by market capitalization. |
| Select Your Default Chart Type: | |||||
| |||||
| Click on stock symbol or name for detailed view. Click on to add stock symbol to your watchlist and to view watchlist. Quick View: Move mouse or cursor over "Daily" to quickly view daily technical stock chart and over "Weekly" to view weekly technical stock chart. | |||||

 | FLR Fluor Corporation |
| Sector: Industrials | |
| SubSector: Heavy Construction | |
| MarketCap: 891.495 Millions | |
| Recent Price: 39.21 Smart Investing & Trading Score: 36 | |
| Day Percent Change: 0.00% Day Change: 0.00 | |
| Week Change: -4.01% Year-to-date Change: 0.1% | |
| FLR Links: Profile News Message Board | |
| Charts:- Daily , Weekly | |
| Add FLR to Watchlist: View: Get Complete FLR Trend Analysis ➞ | |
 | PL Planet Labs PBC |
| Sector: Industrials | |
| SubSector: Aerospace & Defense | |
| MarketCap: 874 Millions | |
| Recent Price: 1.75 Smart Investing & Trading Score: 30 | |
| Day Percent Change: -4.37% Day Change: -0.08 | |
| Week Change: -12.94% Year-to-date Change: -29.4% | |
| PL Links: Profile News Message Board | |
| Charts:- Daily , Weekly | |
| Add PL to Watchlist: View: Get Complete PL Trend Analysis ➞ | |
 | CRS Carpenter Technology Corporation |
| Sector: Industrials | |
| SubSector: Metal Fabrication | |
| MarketCap: 853.35 Millions | |
| Recent Price: 78.04 Smart Investing & Trading Score: 69 | |
| Day Percent Change: -1.69% Day Change: -1.34 | |
| Week Change: 0.7% Year-to-date Change: 10.2% | |
| CRS Links: Profile News Message Board | |
| Charts:- Daily , Weekly | |
| Add CRS to Watchlist: View: Get Complete CRS Trend Analysis ➞ | |
 | EVLV Evolv Technologies Holdings, Inc. |
| Sector: Industrials | |
| SubSector: Security & Protection Services | |
| MarketCap: 853 Millions | |
| Recent Price: 3.83 Smart Investing & Trading Score: 46 | |
| Day Percent Change: -2.79% Day Change: -0.11 | |
| Week Change: -5.43% Year-to-date Change: -18.9% | |
| EVLV Links: Profile News Message Board | |
| Charts:- Daily , Weekly | |
| Add EVLV to Watchlist: View: Get Complete EVLV Trend Analysis ➞ | |
 | HRT HireRight Holdings Corporation |
| Sector: Industrials | |
| SubSector: Staffing & Employment Services | |
| MarketCap: 823 Millions | |
| Recent Price: 14.24 Smart Investing & Trading Score: 61 | |
| Day Percent Change: -0.07% Day Change: -0.01 | |
| Week Change: 0% Year-to-date Change: 5.9% | |
| HRT Links: Profile News Message Board | |
| Charts:- Daily , Weekly | |
| Add HRT to Watchlist: View: Get Complete HRT Trend Analysis ➞ | |
 | CDRE Cadre Holdings, Inc. |
| Sector: Industrials | |
| SubSector: Aerospace & Defense | |
| MarketCap: 817 Millions | |
| Recent Price: 32.86 Smart Investing & Trading Score: 10 | |
| Day Percent Change: -1.53% Day Change: -0.51 | |
| Week Change: -2.14% Year-to-date Change: -0.3% | |
| CDRE Links: Profile News Message Board | |
| Charts:- Daily , Weekly | |
| Add CDRE to Watchlist: View: Get Complete CDRE Trend Analysis ➞ | |
 | CODI Compass Diversified Holdings LLC |
| Sector: Industrials | |
| SubSector: Conglomerates | |
| MarketCap: 803.348 Millions | |
| Recent Price: 22.81 Smart Investing & Trading Score: 68 | |
| Day Percent Change: 2.15% Day Change: 0.48 | |
| Week Change: -2.81% Year-to-date Change: 1.6% | |
| CODI Links: Profile News Message Board | |
| Charts:- Daily , Weekly | |
| Add CODI to Watchlist: View: Get Complete CODI Trend Analysis ➞ | |
 | KAI Kadant Inc. |
| Sector: Industrials | |
| SubSector: Diversified Machinery | |
| MarketCap: 787.116 Millions | |
| Recent Price: 281.99 Smart Investing & Trading Score: 10 | |
| Day Percent Change: -0.67% Day Change: -1.91 | |
| Week Change: -4.01% Year-to-date Change: 0.6% | |
| KAI Links: Profile News Message Board | |
| Charts:- Daily , Weekly | |
| Add KAI to Watchlist: View: Get Complete KAI Trend Analysis ➞ | |
 | RGR Sturm, Ruger & Company, Inc. |
| Sector: Industrials | |
| SubSector: Aerospace/Defense Products & Services | |
| MarketCap: 752 Millions | |
| Recent Price: 46.75 Smart Investing & Trading Score: 88 | |
| Day Percent Change: 1.37% Day Change: 0.63 | |
| Week Change: 2.25% Year-to-date Change: 2.9% | |
| RGR Links: Profile News Message Board | |
| Charts:- Daily , Weekly | |
| Add RGR to Watchlist: View: Get Complete RGR Trend Analysis ➞ | |
 | GTLS Chart Industries, Inc. |
| Sector: Industrials | |
| SubSector: Metal Fabrication | |
| MarketCap: 751.15 Millions | |
| Recent Price: 148.04 Smart Investing & Trading Score: 54 | |
| Day Percent Change: -0.36% Day Change: -0.53 | |
| Week Change: -4.06% Year-to-date Change: 8.6% | |
| GTLS Links: Profile News Message Board | |
| Charts:- Daily , Weekly | |
| Add GTLS to Watchlist: View: Get Complete GTLS Trend Analysis ➞ | |
 | AZZ AZZ Inc. |
| Sector: Industrials | |
| SubSector: Diversified Machinery | |
| MarketCap: 743.416 Millions | |
| Recent Price: 74.80 Smart Investing & Trading Score: 31 | |
| Day Percent Change: -0.90% Day Change: -0.68 | |
| Week Change: -4.08% Year-to-date Change: 28.8% | |
| AZZ Links: Profile News Message Board | |
| Charts:- Daily , Weekly | |
| Add AZZ to Watchlist: View: Get Complete AZZ Trend Analysis ➞ | |
 | NPO EnPro Industries, Inc. |
| Sector: Industrials | |
| SubSector: Industrial Equipment & Components | |
| MarketCap: 734.309 Millions | |
| Recent Price: 149.02 Smart Investing & Trading Score: 23 | |
| Day Percent Change: -0.16% Day Change: -0.24 | |
| Week Change: -5.34% Year-to-date Change: -4.9% | |
| NPO Links: Profile News Message Board | |
| Charts:- Daily , Weekly | |
| Add NPO to Watchlist: View: Get Complete NPO Trend Analysis ➞ | |
 | ASTE Astec Industries, Inc. |
| Sector: Industrials | |
| SubSector: Farm & Construction Machinery | |
| MarketCap: 731.607 Millions | |
| Recent Price: 42.77 Smart Investing & Trading Score: 68 | |
| Day Percent Change: 2.13% Day Change: 0.89 | |
| Week Change: 0.66% Year-to-date Change: 15.0% | |
| ASTE Links: Profile News Message Board | |
| Charts:- Daily , Weekly | |
| Add ASTE to Watchlist: View: Get Complete ASTE Trend Analysis ➞ | |
 | GRC The Gorman-Rupp Company |
| Sector: Industrials | |
| SubSector: Diversified Machinery | |
| MarketCap: 729.616 Millions | |
| Recent Price: 36.02 Smart Investing & Trading Score: 43 | |
| Day Percent Change: -0.06% Day Change: -0.02 | |
| Week Change: -1.8% Year-to-date Change: 1.4% | |
| GRC Links: Profile News Message Board | |
| Charts:- Daily , Weekly | |
| Add GRC to Watchlist: View: Get Complete GRC Trend Analysis ➞ | |
 | GVA Granite Construction Incorporated |
| Sector: Industrials | |
| SubSector: Heavy Construction | |
| MarketCap: 725.895 Millions | |
| Recent Price: 53.44 Smart Investing & Trading Score: 41 | |
| Day Percent Change: -0.45% Day Change: -0.24 | |
| Week Change: -3.43% Year-to-date Change: 5.1% | |
| GVA Links: Profile News Message Board | |
| Charts:- Daily , Weekly | |
| Add GVA to Watchlist: View: Get Complete GVA Trend Analysis ➞ | |
 | AGX Argan, Inc. |
| Sector: Industrials | |
| SubSector: Heavy Construction | |
| MarketCap: 664.095 Millions | |
| Recent Price: 61.92 Smart Investing & Trading Score: 95 | |
| Day Percent Change: 1.52% Day Change: 0.93 | |
| Week Change: 3.6% Year-to-date Change: 32.3% | |
| AGX Links: Profile News Message Board | |
| Charts:- Daily , Weekly | |
| Add AGX to Watchlist: View: Get Complete AGX Trend Analysis ➞ | |
 | SXI Standex International Corporation |
| Sector: Industrials | |
| SubSector: Industrial Equipment & Components | |
| MarketCap: 644.109 Millions | |
| Recent Price: 167.54 Smart Investing & Trading Score: 36 | |
| Day Percent Change: 0.41% Day Change: 0.69 | |
| Week Change: -2.28% Year-to-date Change: 5.8% | |
| SXI Links: Profile News Message Board | |
| Charts:- Daily , Weekly | |
| Add SXI to Watchlist: View: Get Complete SXI Trend Analysis ➞ | |
 | GLDD Great Lakes Dredge & Dock Corporation |
| Sector: Industrials | |
| SubSector: Heavy Construction | |
| MarketCap: 619.095 Millions | |
| Recent Price: 7.45 Smart Investing & Trading Score: 10 | |
| Day Percent Change: 0.95% Day Change: 0.07 | |
| Week Change: -6.29% Year-to-date Change: -3.0% | |
| GLDD Links: Profile News Message Board | |
| Charts:- Daily , Weekly | |
| Add GLDD to Watchlist: View: Get Complete GLDD Trend Analysis ➞ | |
 | GFF Griffon Corporation |
| Sector: Industrials | |
| SubSector: General Building Materials | |
| MarketCap: 616 Millions | |
| Recent Price: 65.97 Smart Investing & Trading Score: 36 | |
| Day Percent Change: 1.18% Day Change: 0.77 | |
| Week Change: -2.4% Year-to-date Change: 8.2% | |
| GFF Links: Profile News Message Board | |
| Charts:- Daily , Weekly | |
| Add GFF to Watchlist: View: Get Complete GFF Trend Analysis ➞ | |
 | AMPX Amprius Technologies, Inc. |
| Sector: Industrials | |
| SubSector: Electrical Equipment & Parts | |
| MarketCap: 608 Millions | |
| Recent Price: 1.76 Smart Investing & Trading Score: 32 | |
| Day Percent Change: -4.09% Day Change: -0.07 | |
| Week Change: -6.38% Year-to-date Change: -64.9% | |
| AMPX Links: Profile News Message Board | |
| Charts:- Daily , Weekly | |
| Add AMPX to Watchlist: View: Get Complete AMPX Trend Analysis ➞ | |
 | CMCO Columbus McKinnon Corporation |
| Sector: Industrials | |
| SubSector: Farm & Construction Machinery | |
| MarketCap: 598.807 Millions | |
| Recent Price: 40.97 Smart Investing & Trading Score: 56 | |
| Day Percent Change: 0.74% Day Change: 0.30 | |
| Week Change: -1.84% Year-to-date Change: 5.0% | |
| CMCO Links: Profile News Message Board | |
| Charts:- Daily , Weekly | |
| Add CMCO to Watchlist: View: Get Complete CMCO Trend Analysis ➞ | |
 | AIR AAR Corp. |
| Sector: Industrials | |
| SubSector: Aerospace/Defense Products & Services | |
| MarketCap: 591.701 Millions | |
| Recent Price: 64.12 Smart Investing & Trading Score: 90 | |
| Day Percent Change: 1.73% Day Change: 1.09 | |
| Week Change: 5.48% Year-to-date Change: 2.8% | |
| AIR Links: Profile News Message Board | |
| Charts:- Daily , Weekly | |
| Add AIR to Watchlist: View: Get Complete AIR Trend Analysis ➞ | |
 | OFLX Omega Flex, Inc. |
| Sector: Industrials | |
| SubSector: Industrial Equipment & Components | |
| MarketCap: 590.609 Millions | |
| Recent Price: 67.00 Smart Investing & Trading Score: 20 | |
| Day Percent Change: 0.22% Day Change: 0.15 | |
| Week Change: -2.26% Year-to-date Change: -5.0% | |
| OFLX Links: Profile News Message Board | |
| Charts:- Daily , Weekly | |
| Add OFLX to Watchlist: View: Get Complete OFLX Trend Analysis ➞ | |
 | GMS GMS Inc. |
| Sector: Industrials | |
| SubSector: General Building Materials | |
| MarketCap: 587.753 Millions | |
| Recent Price: 90.25 Smart Investing & Trading Score: 36 | |
| Day Percent Change: 0.19% Day Change: 0.17 | |
| Week Change: -5.31% Year-to-date Change: 9.5% | |
| GMS Links: Profile News Message Board | |
| Charts:- Daily , Weekly | |
| Add GMS to Watchlist: View: Get Complete GMS Trend Analysis ➞ | |
 | DY Dycom Industries, Inc. |
| Sector: Industrials | |
| SubSector: Heavy Construction | |
| MarketCap: 576.295 Millions | |
| Recent Price: 135.56 Smart Investing & Trading Score: 54 | |
| Day Percent Change: 0.63% Day Change: 0.85 | |
| Week Change: -1.61% Year-to-date Change: 17.8% | |
| DY Links: Profile News Message Board | |
| Charts:- Daily , Weekly | |
| Add DY to Watchlist: View: Get Complete DY Trend Analysis ➞ | |
| For tabular summary view of above stock list: Summary View ➞ 0 - 25 , 25 - 50 , 50 - 75 , 75 - 100 , 100 - 125 , 125 - 150 , 150 - 175 | ||
| Click To Change The Sort Order: By Market Cap or Company Size Performance: Year-to-date, Week and Day | |
| Select Chart Type: | ||
| Too many stocks? View smallcap stocks filtered by marketcap & sector |
| Marketcap: All SmallCap Stocks (default-no microcap), Large, Mid-Range, Small & MicroCap |
| Sector: Tech, Finance, Energy, Staples, Retail, Industrial, Materials, Utilities & Medical |
|
Best Stocks Today 12Stocks.com |
© 2024 12Stocks.com Terms & Conditions Privacy Contact Us
All Information Provided Only For Education And Not To Be Used For Investing or Trading. See Terms & Conditions


One More Thing ... Get Best Stocks Delivered Daily!
Never Ever Miss A Move With Our Top Ten Stocks Lists
Find Best Stocks In Any Market - Bull or Bear Market
Take A Peek At Our Top Ten Stocks Lists: Daily, Weekly, Year-to-Date & Top Trends
Find Best Stocks In Any Market - Bull or Bear Market
Take A Peek At Our Top Ten Stocks Lists: Daily, Weekly, Year-to-Date & Top Trends
Smallcap Stocks With Best Up Trends [0-bearish to 100-bullish]: Vertex Energy[100], BancFirst [100], Calavo Growers[100], Old Second[100], Excelerate Energy[100], Gannett Co[100], Core Molding[100], Angel Oak[100], Tejon Ranch[100], United Fire[100], Victory Capital[100]
Best Smallcap Stocks Year-to-Date:
Agenus [541.38%], CareMax [429.9%], Janux [353.14%], Viking [240.78%], Alpine Immune[238.94%], Longboard [185.43%], Arcutis Bio[181.42%], Avidity Biosciences[153.65%], Super Micro[151.06%], Vera [145.48%], Stoke [129.66%] Best Smallcap Stocks This Week:
Macatawa Bank[47.34%], Vertex Energy[43.27%], Snap One[29.73%], Humacyte [28.47%], Vanda [24.03%], ALX Oncology[22.49%], ContextLogic [16.8%], ProKidney [16.57%], Calavo Growers[16.24%], Badger Meter[15.61%], Accolade [13.45%] Best Smallcap Stocks Daily:
Tellurian [28.11%], Origin Materials[19.59%], Metropolitan Bank[18.01%], Genelux [14.25%], Humacyte [14.02%], Vertex Energy[13.74%], Chemung Financial[10.29%], Gevo [10.14%], Riot Blockchain[10.13%], Marathon Patent[9.78%], Emergent BioSolutions[9.68%]