
 Login Sign Up


| |||||
 |  | ||||

| 12Stocks.com Market Intelligence |
Best SmallCap Stocks
|
| In a hurry? Small Cap Stock Lists: Performance Trends Table, Stock Charts
Sort Small Cap stocks: Daily, Weekly, Year-to-Date, Market Cap & Trends. Filter Small Cap stocks list by sector: Show all, Tech, Finance, Energy, Staples, Retail, Industrial, Materials, Utilities and HealthCare Filter Small Cap stocks list by size: All Large Medium Small and MicroCap |
| 12Stocks.com Small Cap Stocks Performances & Trends Daily | |||||||||
|
|  The overall Smart Investing & Trading Score is 31 (0-bearish to 100-bullish) which puts Small Cap index in short term bearish to neutral trend. The Smart Investing & Trading Score from previous trading session is 58 and hence a deterioration of trend.
| ||||||||
Here are the Smart Investing & Trading Scores of the most requested small cap stocks at 12Stocks.com (click stock name for detailed review):
|


| 12Stocks.com: Investing in Smallcap Index with Stocks | |
|
The following table helps investors and traders sort through current performance and trends (as measured by Smart Investing & Trading Score) of various
stocks in the Smallcap Index. Quick View: Move mouse or cursor over stock symbol (ticker) to view short-term technical chart and over stock name to view long term chart. Click on  to add stock symbol to your watchlist and to add stock symbol to your watchlist and  to view watchlist. Click on any ticker or stock name for detailed market intelligence report for that stock. to view watchlist. Click on any ticker or stock name for detailed market intelligence report for that stock. |
12Stocks.com Performance of Stocks in Smallcap Index
| Ticker | Stock Name | Watchlist | Category | Recent Price | Smart Investing & Trading Score | Change % | YTD Change% |
| DNLI | Denali |   | Health Care | 14.72 | 23 | -5.43% | -31.43% |
| IGMS | IGM Biosciences | | Health Care | 7.29 | 15 | -8.42% | -12.27% |
| VTYX | Ventyx Biosciences | | Health Care | 4.09 | 46 | -6.31% | 65.05% |
| ITGR | Integer | | Health Care | 114.10 | 86 | -7.44% | 15.15% |
| OSCR | Oscar Health | | Health Care | 17.23 | 83 | -1.20% | 89.24% |
| SEM | Select Medical | | Health Care | 27.55 | 61 | -0.61% | 17.23% |
| XNCR | Xencor | | Health Care | 18.44 | 17 | -3.05% | -13.14% |
| MMSI | Merit Medical | | Health Care | 73.00 | 67 | -1.39% | -3.90% |
| DH | Definitive Healthcare | | Health Care | 7.00 | 47 | -2.44% | -30.49% |
| SAGE | Sage | | Health Care | 14.07 | 22 | 0.50% | -35.07% |
| PBH | Prestige Consumer | | Health Care | 69.41 | 76 | -1.03% | 13.38% |
| IRWD | Ironwood | | Health Care | 8.02 | 52 | -1.05% | -29.94% |
| PRCT | PROCEPT BioRobotics | | Health Care | 50.94 | 83 | -3.28% | 20.31% |
| CNMD | CONMED | | Health Care | 64.26 | 10 | -8.21% | -41.32% |
| TMCI | Treace Medical | | Health Care | 10.30 | 10 | -3.70% | -19.19% |
| ACLX | Arcellx | | Health Care | 49.91 | 25 | -6.30% | -10.55% |
| AMLX | Amylyx | | Health Care | 1.83 | 30 | -5.44% | -87.38% |
| KPTI | Karyopharm | | Health Care | 1.06 | 46 | -2.29% | 23.12% |
| RXRX | Recursion | | Health Care | 7.50 | 25 | -5.60% | -23.34% |
| INSM | Insmed | | Health Care | 24.98 | 35 | -3.22% | -19.39% |
| PRME | Prime Medicine | | Health Care | 4.34 | 55 | -8.25% | -52.41% |
| FNA | Paragon 28 | | Health Care | 9.26 | 45 | -6.56% | -25.74% |
| TBPH | Theravance Biopharma | | Health Care | 9.04 | 7 | -1.47% | -19.62% |
| PCRX | Pacira BioSciences | | Health Care | 25.49 | 20 | -1.58% | -24.45% |
| WRBY | Warby Parker | | Health Care | 12.77 | 74 | -2.52% | -9.46% |
| For chart view version of above stock list: Chart View ➞ 0 - 25 , 25 - 50 , 50 - 75 , 75 - 100 , 100 - 125 , 125 - 150 , 150 - 175 , 175 - 200 , 200 - 225 , 225 - 250 , 250 - 275 , 275 - 300 , 300 - 325 , 325 - 350 | ||
 | Click To Change The Sort Order: By Market Cap or Company Size Performance: Year-to-date, Week and Day |  |
| Too many stocks? View smallcap stocks filtered by marketcap & sector |
| Marketcap: All SmallCap Stocks (default-no microcap), Large, Mid-Range, Small |
| Smallcap Sector: Tech, Finance, Energy, Staples, Retail, Industrial, Materials, & Medical |
|
Get the most comprehensive stock market coverage daily at 12Stocks.com ➞ Best Stocks Today ➞ Best Stocks Weekly ➞ Best Stocks Year-to-Date ➞ Best Stocks Trends ➞  Best Stocks Today 12Stocks.com Best Nasdaq Stocks ➞ Best S&P 500 Stocks ➞ Best Tech Stocks ➞ Best Biotech Stocks ➞ |
| Detailed Overview of SmallCap Stocks |
| SmallCap Technical Overview, Leaders & Laggards, Top SmallCap ETF Funds & Detailed SmallCap Stocks List, Charts, Trends & More |
| Smallcap: Technical Analysis, Trends & YTD Performance | |
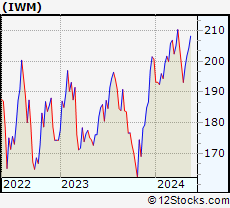
| SmallCap segment as represented by
IWM, an exchange-traded fund [ETF], holds basket of thousands of smallcap stocks from across all major sectors of the US stock market. The smallcap index (contains stocks like Riverbed & Sotheby's) is down by -3.39% and is currently underperforming the overall market by -7.31% year-to-date. Below is a quick view of technical charts and trends: | |
 IWM Weekly Chart |
|
| Long Term Trend: Good | |
| Medium Term Trend: Not Good | |
 IWM Daily Chart |
|
| Short Term Trend: Not Good | |
| Overall Trend Score: 31 | |
| YTD Performance: -3.39% | |
| **Trend Scores & Views Are Only For Educational Purposes And Not For Investing | |
| 12Stocks.com: Top Performing Small Cap Index Stocks | ||||||||||||||||||||||||||||||||||||||||||||||||
 The top performing Small Cap Index stocks year to date are
Now, more recently, over last week, the top performing Small Cap Index stocks on the move are


|
||||||||||||||||||||||||||||||||||||||||||||||||
| 12Stocks.com: Investing in Smallcap Index using Exchange Traded Funds | |
|
The following table shows list of key exchange traded funds (ETF) that
help investors track Smallcap index. The following list also includes leveraged ETF funds that track twice or thrice the daily returns of Smallcap indices. Short or inverse ETF funds move in the opposite direction to the index they track and are useful during market pullbacks or during bear markets. Quick View: Move mouse or cursor over ETF symbol (ticker) to view short-term technical chart and over ETF name to view long term chart. Click on ticker or stock name for detailed view. Click on to add stock symbol to your watchlist and to view watchlist. |
12Stocks.com List of ETFs that track Smallcap Index
| Ticker | ETF Name | Watchlist | Recent Price | Smart Investing & Trading Score | Change % | Week % | Year-to-date % |
| IWM | iShares Russell 2000 | | 193.91 | 31 | -1.91 | 0.4 | -3.39% |
| SBB | ProShares Short SmallCap600 | | 16.60 | 40 | 1.41 | -1.43 | 4.21% |
| SDD | ProShares UltraShort SmallCap600 | | 19.79 | 42 | 1.51 | -2.73 | 7.37% |
| SMLV | SPDR SSGA US Small Cap Low Volatil ETF | | 107.56 | 73 | -0.80 | 1.39 | -4.41% |
| SAA | ProShares Ultra SmallCap600 | | 23.01 | 58 | 0.00 | 5.55 | -7.78% |
| 12Stocks.com: Charts, Trends, Fundamental Data and Performances of SmallCap Stocks | |
|
We now take in-depth look at all SmallCap stocks including charts, multi-period performances and overall trends (as measured by Smart Investing & Trading Score). One can sort SmallCap stocks (click link to choose) by Daily, Weekly and by Year-to-Date performances. Also, one can sort by size of the company or by market capitalization. |
| Select Your Default Chart Type: | |||||
| |||||
| Click on stock symbol or name for detailed view. Click on to add stock symbol to your watchlist and to view watchlist. Quick View: Move mouse or cursor over "Daily" to quickly view daily technical stock chart and over "Weekly" to view weekly technical stock chart. | |||||

 | DNLI Denali Therapeutics Inc. |
| Sector: Health Care | |
| SubSector: Biotechnology | |
| MarketCap: 2020.05 Millions | |
| Recent Price: 14.72 Smart Investing & Trading Score: 23 | |
| Day Percent Change: -5.43% Day Change: -0.85 | |
| Week Change: -7.92% Year-to-date Change: -31.4% | |
| DNLI Links: Profile News Message Board | |
| Charts:- Daily , Weekly | |
| Add DNLI to Watchlist: View: Get Complete DNLI Trend Analysis ➞ | |
 | IGMS IGM Biosciences, Inc. |
| Sector: Health Care | |
| SubSector: Biotechnology | |
| MarketCap: 2000.05 Millions | |
| Recent Price: 7.29 Smart Investing & Trading Score: 15 | |
| Day Percent Change: -8.42% Day Change: -0.67 | |
| Week Change: 1.25% Year-to-date Change: -12.3% | |
| IGMS Links: Profile News Message Board | |
| Charts:- Daily , Weekly | |
| Add IGMS to Watchlist: View: Get Complete IGMS Trend Analysis ➞ | |
 | VTYX Ventyx Biosciences, Inc. |
| Sector: Health Care | |
| SubSector: Biotechnology | |
| MarketCap: 1950 Millions | |
| Recent Price: 4.09 Smart Investing & Trading Score: 46 | |
| Day Percent Change: -6.31% Day Change: -0.28 | |
| Week Change: -8.61% Year-to-date Change: 65.1% | |
| VTYX Links: Profile News Message Board | |
| Charts:- Daily , Weekly | |
| Add VTYX to Watchlist: View: Get Complete VTYX Trend Analysis ➞ | |
 | ITGR Integer Holdings Corporation |
| Sector: Health Care | |
| SubSector: Medical Appliances & Equipment | |
| MarketCap: 1794.8 Millions | |
| Recent Price: 114.10 Smart Investing & Trading Score: 86 | |
| Day Percent Change: -7.44% Day Change: -9.17 | |
| Week Change: -2.17% Year-to-date Change: 15.2% | |
| ITGR Links: Profile News Message Board | |
| Charts:- Daily , Weekly | |
| Add ITGR to Watchlist: View: Get Complete ITGR Trend Analysis ➞ | |
 | OSCR Oscar Health, Inc. |
| Sector: Health Care | |
| SubSector: Healthcare Plans | |
| MarketCap: 1790 Millions | |
| Recent Price: 17.23 Smart Investing & Trading Score: 83 | |
| Day Percent Change: -1.20% Day Change: -0.21 | |
| Week Change: 7.62% Year-to-date Change: 89.2% | |
| OSCR Links: Profile News Message Board | |
| Charts:- Daily , Weekly | |
| Add OSCR to Watchlist: View: Get Complete OSCR Trend Analysis ➞ | |
 | SEM Select Medical Holdings Corporation |
| Sector: Health Care | |
| SubSector: Hospitals | |
| MarketCap: 1765.96 Millions | |
| Recent Price: 27.55 Smart Investing & Trading Score: 61 | |
| Day Percent Change: -0.61% Day Change: -0.17 | |
| Week Change: 1.81% Year-to-date Change: 17.2% | |
| SEM Links: Profile News Message Board | |
| Charts:- Daily , Weekly | |
| Add SEM to Watchlist: View: Get Complete SEM Trend Analysis ➞ | |
 | XNCR Xencor, Inc. |
| Sector: Health Care | |
| SubSector: Biotechnology | |
| MarketCap: 1744.35 Millions | |
| Recent Price: 18.44 Smart Investing & Trading Score: 17 | |
| Day Percent Change: -3.05% Day Change: -0.58 | |
| Week Change: 0.33% Year-to-date Change: -13.1% | |
| XNCR Links: Profile News Message Board | |
| Charts:- Daily , Weekly | |
| Add XNCR to Watchlist: View: Get Complete XNCR Trend Analysis ➞ | |
 | MMSI Merit Medical Systems, Inc. |
| Sector: Health Care | |
| SubSector: Medical Instruments & Supplies | |
| MarketCap: 1719.2 Millions | |
| Recent Price: 73.00 Smart Investing & Trading Score: 67 | |
| Day Percent Change: -1.39% Day Change: -1.03 | |
| Week Change: 1.35% Year-to-date Change: -3.9% | |
| MMSI Links: Profile News Message Board | |
| Charts:- Daily , Weekly | |
| Add MMSI to Watchlist: View: Get Complete MMSI Trend Analysis ➞ | |
 | DH Definitive Healthcare Corp. |
| Sector: Health Care | |
| SubSector: Health Information Services | |
| MarketCap: 1690 Millions | |
| Recent Price: 7.00 Smart Investing & Trading Score: 47 | |
| Day Percent Change: -2.44% Day Change: -0.17 | |
| Week Change: -0.85% Year-to-date Change: -30.5% | |
| DH Links: Profile News Message Board | |
| Charts:- Daily , Weekly | |
| Add DH to Watchlist: View: Get Complete DH Trend Analysis ➞ | |
 | SAGE Sage Therapeutics, Inc. |
| Sector: Health Care | |
| SubSector: Biotechnology | |
| MarketCap: 1683.75 Millions | |
| Recent Price: 14.07 Smart Investing & Trading Score: 22 | |
| Day Percent Change: 0.50% Day Change: 0.07 | |
| Week Change: 5.55% Year-to-date Change: -35.1% | |
| SAGE Links: Profile News Message Board | |
| Charts:- Daily , Weekly | |
| Add SAGE to Watchlist: View: Get Complete SAGE Trend Analysis ➞ | |
 | PBH Prestige Consumer Healthcare Inc. |
| Sector: Health Care | |
| SubSector: Medical Appliances & Equipment | |
| MarketCap: 1639.6 Millions | |
| Recent Price: 69.41 Smart Investing & Trading Score: 76 | |
| Day Percent Change: -1.03% Day Change: -0.72 | |
| Week Change: -0.37% Year-to-date Change: 13.4% | |
| PBH Links: Profile News Message Board | |
| Charts:- Daily , Weekly | |
| Add PBH to Watchlist: View: Get Complete PBH Trend Analysis ➞ | |
 | IRWD Ironwood Pharmaceuticals, Inc. |
| Sector: Health Care | |
| SubSector: Drugs - Generic | |
| MarketCap: 1616.35 Millions | |
| Recent Price: 8.02 Smart Investing & Trading Score: 52 | |
| Day Percent Change: -1.05% Day Change: -0.08 | |
| Week Change: 1.2% Year-to-date Change: -29.9% | |
| IRWD Links: Profile News Message Board | |
| Charts:- Daily , Weekly | |
| Add IRWD to Watchlist: View: Get Complete IRWD Trend Analysis ➞ | |
 | PRCT PROCEPT BioRobotics Corporation |
| Sector: Health Care | |
| SubSector: Medical Devices | |
| MarketCap: 1600 Millions | |
| Recent Price: 50.94 Smart Investing & Trading Score: 83 | |
| Day Percent Change: -3.28% Day Change: -1.73 | |
| Week Change: 1.49% Year-to-date Change: 20.3% | |
| PRCT Links: Profile News Message Board | |
| Charts:- Daily , Weekly | |
| Add PRCT to Watchlist: View: Get Complete PRCT Trend Analysis ➞ | |
 | CNMD CONMED Corporation |
| Sector: Health Care | |
| SubSector: Medical Appliances & Equipment | |
| MarketCap: 1589.2 Millions | |
| Recent Price: 64.26 Smart Investing & Trading Score: 10 | |
| Day Percent Change: -8.21% Day Change: -5.75 | |
| Week Change: -11.54% Year-to-date Change: -41.3% | |
| CNMD Links: Profile News Message Board | |
| Charts:- Daily , Weekly | |
| Add CNMD to Watchlist: View: Get Complete CNMD Trend Analysis ➞ | |
 | TMCI Treace Medical Concepts, Inc. |
| Sector: Health Care | |
| SubSector: Medical Devices | |
| MarketCap: 1550 Millions | |
| Recent Price: 10.30 Smart Investing & Trading Score: 10 | |
| Day Percent Change: -3.70% Day Change: -0.39 | |
| Week Change: -6.15% Year-to-date Change: -19.2% | |
| TMCI Links: Profile News Message Board | |
| Charts:- Daily , Weekly | |
| Add TMCI to Watchlist: View: Get Complete TMCI Trend Analysis ➞ | |
 | ACLX Arcellx, Inc. |
| Sector: Health Care | |
| SubSector: Biotechnology | |
| MarketCap: 1530 Millions | |
| Recent Price: 49.91 Smart Investing & Trading Score: 25 | |
| Day Percent Change: -6.30% Day Change: -3.36 | |
| Week Change: -3.36% Year-to-date Change: -10.6% | |
| ACLX Links: Profile News Message Board | |
| Charts:- Daily , Weekly | |
| Add ACLX to Watchlist: View: Get Complete ACLX Trend Analysis ➞ | |
 | AMLX Amylyx Pharmaceuticals, Inc. |
| Sector: Health Care | |
| SubSector: Biotechnology | |
| MarketCap: 1500 Millions | |
| Recent Price: 1.83 Smart Investing & Trading Score: 30 | |
| Day Percent Change: -5.44% Day Change: -0.10 | |
| Week Change: -2.41% Year-to-date Change: -87.4% | |
| AMLX Links: Profile News Message Board | |
| Charts:- Daily , Weekly | |
| Add AMLX to Watchlist: View: Get Complete AMLX Trend Analysis ➞ | |
 | KPTI Karyopharm Therapeutics Inc. |
| Sector: Health Care | |
| SubSector: Biotechnology | |
| MarketCap: 1471.85 Millions | |
| Recent Price: 1.06 Smart Investing & Trading Score: 46 | |
| Day Percent Change: -2.29% Day Change: -0.03 | |
| Week Change: -8.97% Year-to-date Change: 23.1% | |
| KPTI Links: Profile News Message Board | |
| Charts:- Daily , Weekly | |
| Add KPTI to Watchlist: View: Get Complete KPTI Trend Analysis ➞ | |
 | RXRX Recursion Pharmaceuticals, Inc. |
| Sector: Health Care | |
| SubSector: Biotechnology | |
| MarketCap: 1470 Millions | |
| Recent Price: 7.50 Smart Investing & Trading Score: 25 | |
| Day Percent Change: -5.60% Day Change: -0.45 | |
| Week Change: 2.11% Year-to-date Change: -23.3% | |
| RXRX Links: Profile News Message Board | |
| Charts:- Daily , Weekly | |
| Add RXRX to Watchlist: View: Get Complete RXRX Trend Analysis ➞ | |
 | INSM Insmed Incorporated |
| Sector: Health Care | |
| SubSector: Biotechnology | |
| MarketCap: 1452.45 Millions | |
| Recent Price: 24.98 Smart Investing & Trading Score: 35 | |
| Day Percent Change: -3.22% Day Change: -0.83 | |
| Week Change: 2.71% Year-to-date Change: -19.4% | |
| INSM Links: Profile News Message Board | |
| Charts:- Daily , Weekly | |
| Add INSM to Watchlist: View: Get Complete INSM Trend Analysis ➞ | |
 | PRME Prime Medicine, Inc. |
| Sector: Health Care | |
| SubSector: Biotechnology | |
| MarketCap: 1440 Millions | |
| Recent Price: 4.34 Smart Investing & Trading Score: 55 | |
| Day Percent Change: -8.25% Day Change: -0.39 | |
| Week Change: -3.77% Year-to-date Change: -52.4% | |
| PRME Links: Profile News Message Board | |
| Charts:- Daily , Weekly | |
| Add PRME to Watchlist: View: Get Complete PRME Trend Analysis ➞ | |
 | FNA Paragon 28, Inc. |
| Sector: Health Care | |
| SubSector: Medical Devices | |
| MarketCap: 1420 Millions | |
| Recent Price: 9.26 Smart Investing & Trading Score: 45 | |
| Day Percent Change: -6.56% Day Change: -0.65 | |
| Week Change: -5.51% Year-to-date Change: -25.7% | |
| FNA Links: Profile News Message Board | |
| Charts:- Daily , Weekly | |
| Add FNA to Watchlist: View: Get Complete FNA Trend Analysis ➞ | |
 | TBPH Theravance Biopharma, Inc. |
| Sector: Health Care | |
| SubSector: Biotechnology | |
| MarketCap: 1404.55 Millions | |
| Recent Price: 9.04 Smart Investing & Trading Score: 7 | |
| Day Percent Change: -1.47% Day Change: -0.13 | |
| Week Change: -3.27% Year-to-date Change: -19.6% | |
| TBPH Links: Profile News Message Board | |
| Charts:- Daily , Weekly | |
| Add TBPH to Watchlist: View: Get Complete TBPH Trend Analysis ➞ | |
 | PCRX Pacira BioSciences, Inc. |
| Sector: Health Care | |
| SubSector: Drugs - Generic | |
| MarketCap: 1403.95 Millions | |
| Recent Price: 25.49 Smart Investing & Trading Score: 20 | |
| Day Percent Change: -1.58% Day Change: -0.41 | |
| Week Change: -2.9% Year-to-date Change: -24.5% | |
| PCRX Links: Profile News Message Board | |
| Charts:- Daily , Weekly | |
| Add PCRX to Watchlist: View: Get Complete PCRX Trend Analysis ➞ | |
 | WRBY Warby Parker Inc. |
| Sector: Health Care | |
| SubSector: Medical Instruments & Supplies | |
| MarketCap: 1380 Millions | |
| Recent Price: 12.77 Smart Investing & Trading Score: 74 | |
| Day Percent Change: -2.52% Day Change: -0.33 | |
| Week Change: 5.98% Year-to-date Change: -9.5% | |
| WRBY Links: Profile News Message Board | |
| Charts:- Daily , Weekly | |
| Add WRBY to Watchlist: View: Get Complete WRBY Trend Analysis ➞ | |
| For tabular summary view of above stock list: Summary View ➞ 0 - 25 , 25 - 50 , 50 - 75 , 75 - 100 , 100 - 125 , 125 - 150 , 150 - 175 , 175 - 200 , 200 - 225 , 225 - 250 , 250 - 275 , 275 - 300 , 300 - 325 , 325 - 350 | ||
| Click To Change The Sort Order: By Market Cap or Company Size Performance: Year-to-date, Week and Day | |
| Select Chart Type: | ||
| Too many stocks? View smallcap stocks filtered by marketcap & sector |
| Marketcap: All SmallCap Stocks (default-no microcap), Large, Mid-Range, Small & MicroCap |
| Sector: Tech, Finance, Energy, Staples, Retail, Industrial, Materials, Utilities & Medical |
|
Best Stocks Today 12Stocks.com |
© 2024 12Stocks.com Terms & Conditions Privacy Contact Us
All Information Provided Only For Education And Not To Be Used For Investing or Trading. See Terms & Conditions


One More Thing ... Get Best Stocks Delivered Daily!
Never Ever Miss A Move With Our Top Ten Stocks Lists
Find Best Stocks In Any Market - Bull or Bear Market
Take A Peek At Our Top Ten Stocks Lists: Daily, Weekly, Year-to-Date & Top Trends
Find Best Stocks In Any Market - Bull or Bear Market
Take A Peek At Our Top Ten Stocks Lists: Daily, Weekly, Year-to-Date & Top Trends
Smallcap Stocks With Best Up Trends [0-bearish to 100-bullish]: Ribbon [100], Trustmark [100], Third Coast[100], Diodes [100], NextNav [100], LCNB [100], Vishay Inter[100], Northwest Natural[100], Mueller Industries[100], Excelerate Energy[100], Hibbett Sports[100]
Best Smallcap Stocks Year-to-Date:
CareMax [572.16%], Janux [332.95%], Alpine Immune[239.08%], Longboard [210.15%], Super Micro[163.77%], Arcutis Bio[163.47%], Avidity Biosciences[161.17%], Vera [147.64%], Hippo [121.73%], Y-mAbs [119.35%], Stoke [111.69%] Best Smallcap Stocks This Week:
Matterport [166.09%], B. Riley[42.62%], OptiNose [36.3%], Seres [34.31%], Ribbon [32.95%], CareMax [26.85%], ProKidney [24.02%], Riot Blockchain[23.22%], Hibbett Sports[20.96%], Impinj [19.61%], Cullinan Oncology[16.54%] Best Smallcap Stocks Daily:
OptiNose [31.85%], Impinj [15.06%], Strategic Education[10.26%], Sleep Number[8.77%], Zura Bio[8.59%], Core [8.17%], Community Health[7.10%], Sonic Automotive[6.73%], Direxion Daily[5.82%], Red Robin[5.54%], Ribbon [5.54%]