
 Login Sign Up


| |||||
 |  | ||||

| 12Stocks.com Market Intelligence |
Best SmallCap Stocks
|
| In a hurry? Small Cap Stock Lists: Performance Trends Table, Stock Charts
Sort Small Cap stocks: Daily, Weekly, Year-to-Date, Market Cap & Trends. Filter Small Cap stocks list by sector: Show all, Tech, Finance, Energy, Staples, Retail, Industrial, Materials, Utilities and HealthCare Filter Small Cap stocks list by size: All Large Medium Small and MicroCap |
| 12Stocks.com Small Cap Stocks Performances & Trends Daily | |||||||||
|
|  The overall Smart Investing & Trading Score is 44 (0-bearish to 100-bullish) which puts Small Cap index in short term neutral trend. The Smart Investing & Trading Score from previous trading session is 13 and hence an improvement of trend.
| ||||||||
Here are the Smart Investing & Trading Scores of the most requested small cap stocks at 12Stocks.com (click stock name for detailed review):
|


| 12Stocks.com: Investing in Smallcap Index with Stocks | |
|
The following table helps investors and traders sort through current performance and trends (as measured by Smart Investing & Trading Score) of various
stocks in the Smallcap Index. Quick View: Move mouse or cursor over stock symbol (ticker) to view short-term technical chart and over stock name to view long term chart. Click on  to add stock symbol to your watchlist and to add stock symbol to your watchlist and  to view watchlist. Click on any ticker or stock name for detailed market intelligence report for that stock. to view watchlist. Click on any ticker or stock name for detailed market intelligence report for that stock. |
12Stocks.com Performance of Stocks in Smallcap Index
| Ticker | Stock Name | Watchlist | Category | Recent Price | Smart Investing & Trading Score | Change % | YTD Change% |
| FRSH | Freshworks |   | Technology | 17.89 | 48 | 1.10% | -23.86% |
| DEI | Douglas Emmett | | Financials | 13.06 | 42 | 1.36% | -9.97% |
| HLF | Herbalife Nutrition | | Consumer Staples | 8.49 | 42 | 3.16% | -44.36% |
| FLNC | Fluence Energy | | Utilities | 15.87 | 25 | -0.87% | -33.65% |
| VAL | Valaris | | Energy | 68.21 | 41 | 0.41% | -0.53% |
| HAE | Haemonetics | | Health Care | 85.75 | 86 | 1.02% | 0.28% |
| AIV | Apartment | | Financials | 7.82 | 36 | 0.77% | -0.13% |
| SHLS | Shoals | | Technology | 8.31 | 17 | 0.42% | -46.35% |
| BRZE | Braze | | Technology | 39.54 | 17 | 0.10% | -25.73% |
| POR | Portland General | | Utilities | 41.17 | 53 | 0.46% | -5.01% |
| SQSP | Squarespace | | Technology | 34.92 | 31 | 0.30% | 5.23% |
| XRX | Xerox | | Technology | 16.48 | 25 | 1.76% | -10.12% |
| LANC | Lancaster Colony | | Consumer Staples | 186.04 | 36 | 0.35% | 11.81% |
| OGS | ONE Gas | | Utilities | 62.09 | 61 | 1.04% | -2.56% |
| SLG | SL Green | | Financials | 50.56 | 63 | 1.78% | 11.92% |
| ACT | Enact | | Financials | 29.71 | 58 | 1.47% | 2.17% |
| PECO | Phillips Edison | | Financials | 32.71 | 25 | 2.12% | -11.19% |
| PWSC | PowerSchool | | Technology | 17.70 | 0 | -0.51% | -25.13% |
| CCOI | Cogent | | Technology | 62.95 | 23 | 1.61% | -17.24% |
| MMS | MAXIMUS | | Services & Goods | 80.43 | 18 | 0.81% | -4.09% |
| SVV | Savers Value | | Services & Goods | 17.42 | 42 | 2.11% | -1.86% |
| SR | Spire | | Utilities | 58.77 | 61 | 1.01% | -5.73% |
| LTH | Life Time | | Services & Goods | 14.07 | 46 | 2.07% | -7.10% |
| SLAB | Silicon | | Technology | 120.44 | 10 | -0.90% | -8.94% |
| CXM | Sprinklr | | Technology | 11.55 | 32 | 1.63% | -4.47% |
| For chart view version of above stock list: Chart View ➞ 0 - 25 , 25 - 50 , 50 - 75 , 75 - 100 , 100 - 125 , 125 - 150 , 150 - 175 , 175 - 200 , 200 - 225 , 225 - 250 , 250 - 275 , 275 - 300 , 300 - 325 , 325 - 350 , 350 - 375 , 375 - 400 , 400 - 425 , 425 - 450 , 450 - 475 , 475 - 500 , 500 - 525 , 525 - 550 , 550 - 575 , 575 - 600 , 600 - 625 , 625 - 650 , 650 - 675 , 675 - 700 , 700 - 725 , 725 - 750 , 750 - 775 , 775 - 800 , 800 - 825 , 825 - 850 , 850 - 875 , 875 - 900 , 900 - 925 , 925 - 950 , 950 - 975 , 975 - 1000 , 1000 - 1025 , 1025 - 1050 , 1050 - 1075 , 1075 - 1100 , 1100 - 1125 , 1125 - 1150 , 1150 - 1175 , 1175 - 1200 , 1200 - 1225 , 1225 - 1250 , 1250 - 1275 , 1275 - 1300 , 1300 - 1325 , 1325 - 1350 , 1350 - 1375 , 1375 - 1400 , 1400 - 1425 , 1425 - 1450 , 1450 - 1475 , 1475 - 1500 | ||
 | Click To Change The Sort Order: By Market Cap or Company Size Performance: Year-to-date, Week and Day |  |
| Too many stocks? View smallcap stocks filtered by marketcap & sector |
| Marketcap: All SmallCap Stocks (default-no microcap), Large, Mid-Range, Small |
| Smallcap Sector: Tech, Finance, Energy, Staples, Retail, Industrial, Materials, & Medical |
|
Get the most comprehensive stock market coverage daily at 12Stocks.com ➞ Best Stocks Today ➞ Best Stocks Weekly ➞ Best Stocks Year-to-Date ➞ Best Stocks Trends ➞  Best Stocks Today 12Stocks.com Best Nasdaq Stocks ➞ Best S&P 500 Stocks ➞ Best Tech Stocks ➞ Best Biotech Stocks ➞ |
| Detailed Overview of SmallCap Stocks |
| SmallCap Technical Overview, Leaders & Laggards, Top SmallCap ETF Funds & Detailed SmallCap Stocks List, Charts, Trends & More |
| Smallcap: Technical Analysis, Trends & YTD Performance | |
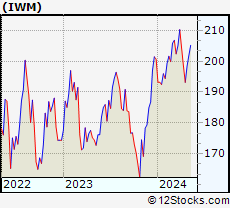
| SmallCap segment as represented by
IWM, an exchange-traded fund [ETF], holds basket of thousands of smallcap stocks from across all major sectors of the US stock market. The smallcap index (contains stocks like Riverbed & Sotheby's) is down by -2.78% and is currently underperforming the overall market by -7.83% year-to-date. Below is a quick view of technical charts and trends: | |
 IWM Weekly Chart |
|
| Long Term Trend: Good | |
| Medium Term Trend: Not Good | |
 IWM Daily Chart |
|
| Short Term Trend: Deteriorating | |
| Overall Trend Score: 44 | |
| YTD Performance: -2.78% | |
| **Trend Scores & Views Are Only For Educational Purposes And Not For Investing | |
| 12Stocks.com: Top Performing Small Cap Index Stocks | ||||||||||||||||||||||||||||||||||||||||||||||||
 The top performing Small Cap Index stocks year to date are
Now, more recently, over last week, the top performing Small Cap Index stocks on the move are


|
||||||||||||||||||||||||||||||||||||||||||||||||
| 12Stocks.com: Investing in Smallcap Index using Exchange Traded Funds | |
|
The following table shows list of key exchange traded funds (ETF) that
help investors track Smallcap index. The following list also includes leveraged ETF funds that track twice or thrice the daily returns of Smallcap indices. Short or inverse ETF funds move in the opposite direction to the index they track and are useful during market pullbacks or during bear markets. Quick View: Move mouse or cursor over ETF symbol (ticker) to view short-term technical chart and over ETF name to view long term chart. Click on ticker or stock name for detailed view. Click on to add stock symbol to your watchlist and to view watchlist. |
12Stocks.com List of ETFs that track Smallcap Index
| Ticker | ETF Name | Watchlist | Recent Price | Smart Investing & Trading Score | Change % | Week % | Year-to-date % |
| IWM | iShares Russell 2000 | | 195.14 | 44 | 1.11 | -1.79 | -2.78% |
| IJR | iShares Core S&P Small-Cap | | 103.30 | 38 | 1.15 | -1.16 | -4.57% |
| IWN | iShares Russell 2000 Value | | 146.73 | 10 | 0.48 | -2.43 | -5.54% |
| IWO | iShares Russell 2000 Growth | | 248.39 | 36 | 0.15 | -2.73 | -1.52% |
| IJS | iShares S&P Small-Cap 600 Value | | 94.21 | 10 | 0.10 | -2.04 | -8.6% |
| XSLV | PowerShares S&P SmallCap Low Volatil ETF | | 41.58 | 18 | 0.39 | -1.21 | -5.82% |
| 12Stocks.com: Charts, Trends, Fundamental Data and Performances of SmallCap Stocks | |
|
We now take in-depth look at all SmallCap stocks including charts, multi-period performances and overall trends (as measured by Smart Investing & Trading Score). One can sort SmallCap stocks (click link to choose) by Daily, Weekly and by Year-to-Date performances. Also, one can sort by size of the company or by market capitalization. |
| Select Your Default Chart Type: | |||||
| |||||
| Click on stock symbol or name for detailed view. Click on to add stock symbol to your watchlist and to view watchlist. Quick View: Move mouse or cursor over "Daily" to quickly view daily technical stock chart and over "Weekly" to view weekly technical stock chart. | |||||

 | FRSH Freshworks Inc. |
| Sector: Technology | |
| SubSector: Software - Application | |
| MarketCap: 5000 Millions | |
| Recent Price: 17.89 Smart Investing & Trading Score: 48 | |
| Day Percent Change: 1.10% Day Change: 0.20 | |
| Week Change: -0.42% Year-to-date Change: -23.9% | |
| FRSH Links: Profile News Message Board | |
| Charts:- Daily , Weekly | |
| Add FRSH to Watchlist: View: Get Complete FRSH Trend Analysis ➞ | |
 | DEI Douglas Emmett, Inc. |
| Sector: Financials | |
| SubSector: REIT - Diversified | |
| MarketCap: 4917.83 Millions | |
| Recent Price: 13.06 Smart Investing & Trading Score: 42 | |
| Day Percent Change: 1.36% Day Change: 0.17 | |
| Week Change: -1.55% Year-to-date Change: -10.0% | |
| DEI Links: Profile News Message Board | |
| Charts:- Daily , Weekly | |
| Add DEI to Watchlist: View: Get Complete DEI Trend Analysis ➞ | |
 | HLF Herbalife Nutrition Ltd. |
| Sector: Consumer Staples | |
| SubSector: Personal Products | |
| MarketCap: 4884.65 Millions | |
| Recent Price: 8.49 Smart Investing & Trading Score: 42 | |
| Day Percent Change: 3.16% Day Change: 0.26 | |
| Week Change: 4.81% Year-to-date Change: -44.4% | |
| HLF Links: Profile News Message Board | |
| Charts:- Daily , Weekly | |
| Add HLF to Watchlist: View: Get Complete HLF Trend Analysis ➞ | |
 | FLNC Fluence Energy, Inc. |
| Sector: Utilities | |
| SubSector: Utilities - Renewable | |
| MarketCap: 4550 Millions | |
| Recent Price: 15.87 Smart Investing & Trading Score: 25 | |
| Day Percent Change: -0.87% Day Change: -0.14 | |
| Week Change: -5.54% Year-to-date Change: -33.7% | |
| FLNC Links: Profile News Message Board | |
| Charts:- Daily , Weekly | |
| Add FLNC to Watchlist: View: Get Complete FLNC Trend Analysis ➞ | |
 | VAL Valaris Limited |
| Sector: Energy | |
| SubSector: Oil & Gas Equipment & Services | |
| MarketCap: 4520 Millions | |
| Recent Price: 68.21 Smart Investing & Trading Score: 41 | |
| Day Percent Change: 0.41% Day Change: 0.28 | |
| Week Change: -3.7% Year-to-date Change: -0.5% | |
| VAL Links: Profile News Message Board | |
| Charts:- Daily , Weekly | |
| Add VAL to Watchlist: View: Get Complete VAL Trend Analysis ➞ | |
 | HAE Haemonetics Corporation |
| Sector: Health Care | |
| SubSector: Medical Instruments & Supplies | |
| MarketCap: 4500.7 Millions | |
| Recent Price: 85.75 Smart Investing & Trading Score: 86 | |
| Day Percent Change: 1.02% Day Change: 0.87 | |
| Week Change: 0.62% Year-to-date Change: 0.3% | |
| HAE Links: Profile News Message Board | |
| Charts:- Daily , Weekly | |
| Add HAE to Watchlist: View: Get Complete HAE Trend Analysis ➞ | |
 | AIV Apartment Investment and Management Company |
| Sector: Financials | |
| SubSector: REIT - Residential | |
| MarketCap: 4485.11 Millions | |
| Recent Price: 7.82 Smart Investing & Trading Score: 36 | |
| Day Percent Change: 0.77% Day Change: 0.06 | |
| Week Change: -3.58% Year-to-date Change: -0.1% | |
| AIV Links: Profile News Message Board | |
| Charts:- Daily , Weekly | |
| Add AIV to Watchlist: View: Get Complete AIV Trend Analysis ➞ | |
 | SHLS Shoals Technologies Group, Inc. |
| Sector: Technology | |
| SubSector: Solar | |
| MarketCap: 4360 Millions | |
| Recent Price: 8.31 Smart Investing & Trading Score: 17 | |
| Day Percent Change: 0.42% Day Change: 0.04 | |
| Week Change: -9.32% Year-to-date Change: -46.4% | |
| SHLS Links: Profile News Message Board | |
| Charts:- Daily , Weekly | |
| Add SHLS to Watchlist: View: Get Complete SHLS Trend Analysis ➞ | |
 | BRZE Braze, Inc. |
| Sector: Technology | |
| SubSector: Software - Application | |
| MarketCap: 4340 Millions | |
| Recent Price: 39.54 Smart Investing & Trading Score: 17 | |
| Day Percent Change: 0.10% Day Change: 0.04 | |
| Week Change: -5.54% Year-to-date Change: -25.7% | |
| BRZE Links: Profile News Message Board | |
| Charts:- Daily , Weekly | |
| Add BRZE to Watchlist: View: Get Complete BRZE Trend Analysis ➞ | |
 | POR Portland General Electric Company |
| Sector: Utilities | |
| SubSector: Electric Utilities | |
| MarketCap: 4291.84 Millions | |
| Recent Price: 41.17 Smart Investing & Trading Score: 53 | |
| Day Percent Change: 0.46% Day Change: 0.19 | |
| Week Change: 1.5% Year-to-date Change: -5.0% | |
| POR Links: Profile News Message Board | |
| Charts:- Daily , Weekly | |
| Add POR to Watchlist: View: Get Complete POR Trend Analysis ➞ | |
 | SQSP Squarespace, Inc. |
| Sector: Technology | |
| SubSector: Software - Infrastructure | |
| MarketCap: 4150 Millions | |
| Recent Price: 34.92 Smart Investing & Trading Score: 31 | |
| Day Percent Change: 0.30% Day Change: 0.10 | |
| Week Change: -4.55% Year-to-date Change: 5.2% | |
| SQSP Links: Profile News Message Board | |
| Charts:- Daily , Weekly | |
| Add SQSP to Watchlist: View: Get Complete SQSP Trend Analysis ➞ | |
 | XRX Xerox Holdings Corporation |
| Sector: Technology | |
| SubSector: Information Technology Services | |
| MarketCap: 4077.48 Millions | |
| Recent Price: 16.48 Smart Investing & Trading Score: 25 | |
| Day Percent Change: 1.76% Day Change: 0.29 | |
| Week Change: -2.23% Year-to-date Change: -10.1% | |
| XRX Links: Profile News Message Board | |
| Charts:- Daily , Weekly | |
| Add XRX to Watchlist: View: Get Complete XRX Trend Analysis ➞ | |
 | LANC Lancaster Colony Corporation |
| Sector: Consumer Staples | |
| SubSector: Food - Major Diversified | |
| MarketCap: 4060.83 Millions | |
| Recent Price: 186.04 Smart Investing & Trading Score: 36 | |
| Day Percent Change: 0.35% Day Change: 0.64 | |
| Week Change: -5.13% Year-to-date Change: 11.8% | |
| LANC Links: Profile News Message Board | |
| Charts:- Daily , Weekly | |
| Add LANC to Watchlist: View: Get Complete LANC Trend Analysis ➞ | |
 | OGS ONE Gas, Inc. |
| Sector: Utilities | |
| SubSector: Gas Utilities | |
| MarketCap: 4051.17 Millions | |
| Recent Price: 62.09 Smart Investing & Trading Score: 61 | |
| Day Percent Change: 1.04% Day Change: 0.64 | |
| Week Change: 0.02% Year-to-date Change: -2.6% | |
| OGS Links: Profile News Message Board | |
| Charts:- Daily , Weekly | |
| Add OGS to Watchlist: View: Get Complete OGS Trend Analysis ➞ | |
 | SLG SL Green Realty Corp. |
| Sector: Financials | |
| SubSector: REIT - Retail | |
| MarketCap: 4048.14 Millions | |
| Recent Price: 50.56 Smart Investing & Trading Score: 63 | |
| Day Percent Change: 1.78% Day Change: 0.88 | |
| Week Change: -1.24% Year-to-date Change: 11.9% | |
| SLG Links: Profile News Message Board | |
| Charts:- Daily , Weekly | |
| Add SLG to Watchlist: View: Get Complete SLG Trend Analysis ➞ | |
 | ACT Enact Holdings, Inc. |
| Sector: Financials | |
| SubSector: Insurance - Specialty | |
| MarketCap: 4010 Millions | |
| Recent Price: 29.71 Smart Investing & Trading Score: 58 | |
| Day Percent Change: 1.47% Day Change: 0.43 | |
| Week Change: 0.41% Year-to-date Change: 2.2% | |
| ACT Links: Profile News Message Board | |
| Charts:- Daily , Weekly | |
| Add ACT to Watchlist: View: Get Complete ACT Trend Analysis ➞ | |
 | PECO Phillips Edison & Company, Inc. |
| Sector: Financials | |
| SubSector: REIT - Retail | |
| MarketCap: 3920 Millions | |
| Recent Price: 32.71 Smart Investing & Trading Score: 25 | |
| Day Percent Change: 2.12% Day Change: 0.68 | |
| Week Change: -0.67% Year-to-date Change: -11.2% | |
| PECO Links: Profile News Message Board | |
| Charts:- Daily , Weekly | |
| Add PECO to Watchlist: View: Get Complete PECO Trend Analysis ➞ | |
 | PWSC PowerSchool Holdings, Inc. |
| Sector: Technology | |
| SubSector: Software - Application | |
| MarketCap: 3870 Millions | |
| Recent Price: 17.70 Smart Investing & Trading Score: 0 | |
| Day Percent Change: -0.51% Day Change: -0.09 | |
| Week Change: -13.99% Year-to-date Change: -25.1% | |
| PWSC Links: Profile News Message Board | |
| Charts:- Daily , Weekly | |
| Add PWSC to Watchlist: View: Get Complete PWSC Trend Analysis ➞ | |
 | CCOI Cogent Communications Holdings, Inc. |
| Sector: Technology | |
| SubSector: Diversified Communication Services | |
| MarketCap: 3868.14 Millions | |
| Recent Price: 62.95 Smart Investing & Trading Score: 23 | |
| Day Percent Change: 1.61% Day Change: 0.99 | |
| Week Change: -0.09% Year-to-date Change: -17.2% | |
| CCOI Links: Profile News Message Board | |
| Charts:- Daily , Weekly | |
| Add CCOI to Watchlist: View: Get Complete CCOI Trend Analysis ➞ | |
 | MMS MAXIMUS, Inc. |
| Sector: Services & Goods | |
| SubSector: Business Services | |
| MarketCap: 3833.02 Millions | |
| Recent Price: 80.43 Smart Investing & Trading Score: 18 | |
| Day Percent Change: 0.81% Day Change: 0.65 | |
| Week Change: 0.54% Year-to-date Change: -4.1% | |
| MMS Links: Profile News Message Board | |
| Charts:- Daily , Weekly | |
| Add MMS to Watchlist: View: Get Complete MMS Trend Analysis ➞ | |
 | SVV Savers Value Village, Inc. |
| Sector: Services & Goods | |
| SubSector: Specialty Retail | |
| MarketCap: 3800 Millions | |
| Recent Price: 17.42 Smart Investing & Trading Score: 42 | |
| Day Percent Change: 2.11% Day Change: 0.36 | |
| Week Change: 4.31% Year-to-date Change: -1.9% | |
| SVV Links: Profile News Message Board | |
| Charts:- Daily , Weekly | |
| Add SVV to Watchlist: View: Get Complete SVV Trend Analysis ➞ | |
 | SR Spire Inc. |
| Sector: Utilities | |
| SubSector: Gas Utilities | |
| MarketCap: 3745.87 Millions | |
| Recent Price: 58.77 Smart Investing & Trading Score: 61 | |
| Day Percent Change: 1.01% Day Change: 0.59 | |
| Week Change: 0.19% Year-to-date Change: -5.7% | |
| SR Links: Profile News Message Board | |
| Charts:- Daily , Weekly | |
| Add SR to Watchlist: View: Get Complete SR Trend Analysis ➞ | |
 | LTH Life Time Group Holdings, Inc. |
| Sector: Services & Goods | |
| SubSector: Leisure | |
| MarketCap: 3740 Millions | |
| Recent Price: 14.07 Smart Investing & Trading Score: 46 | |
| Day Percent Change: 2.07% Day Change: 0.29 | |
| Week Change: -1.71% Year-to-date Change: -7.1% | |
| LTH Links: Profile News Message Board | |
| Charts:- Daily , Weekly | |
| Add LTH to Watchlist: View: Get Complete LTH Trend Analysis ➞ | |
 | SLAB Silicon Laboratories Inc. |
| Sector: Technology | |
| SubSector: Semiconductor - Integrated Circuits | |
| MarketCap: 3710.2 Millions | |
| Recent Price: 120.44 Smart Investing & Trading Score: 10 | |
| Day Percent Change: -0.90% Day Change: -1.09 | |
| Week Change: -4.65% Year-to-date Change: -8.9% | |
| SLAB Links: Profile News Message Board | |
| Charts:- Daily , Weekly | |
| Add SLAB to Watchlist: View: Get Complete SLAB Trend Analysis ➞ | |
 | CXM Sprinklr, Inc. |
| Sector: Technology | |
| SubSector: Software - Application | |
| MarketCap: 3700 Millions | |
| Recent Price: 11.55 Smart Investing & Trading Score: 32 | |
| Day Percent Change: 1.63% Day Change: 0.19 | |
| Week Change: -0.04% Year-to-date Change: -4.5% | |
| CXM Links: Profile News Message Board | |
| Charts:- Daily , Weekly | |
| Add CXM to Watchlist: View: Get Complete CXM Trend Analysis ➞ | |
| For tabular summary view of above stock list: Summary View ➞ 0 - 25 , 25 - 50 , 50 - 75 , 75 - 100 , 100 - 125 , 125 - 150 , 150 - 175 , 175 - 200 , 200 - 225 , 225 - 250 , 250 - 275 , 275 - 300 , 300 - 325 , 325 - 350 , 350 - 375 , 375 - 400 , 400 - 425 , 425 - 450 , 450 - 475 , 475 - 500 , 500 - 525 , 525 - 550 , 550 - 575 , 575 - 600 , 600 - 625 , 625 - 650 , 650 - 675 , 675 - 700 , 700 - 725 , 725 - 750 , 750 - 775 , 775 - 800 , 800 - 825 , 825 - 850 , 850 - 875 , 875 - 900 , 900 - 925 , 925 - 950 , 950 - 975 , 975 - 1000 , 1000 - 1025 , 1025 - 1050 , 1050 - 1075 , 1075 - 1100 , 1100 - 1125 , 1125 - 1150 , 1150 - 1175 , 1175 - 1200 , 1200 - 1225 , 1225 - 1250 , 1250 - 1275 , 1275 - 1300 , 1300 - 1325 , 1325 - 1350 , 1350 - 1375 , 1375 - 1400 , 1400 - 1425 , 1425 - 1450 , 1450 - 1475 , 1475 - 1500 | ||
| Click To Change The Sort Order: By Market Cap or Company Size Performance: Year-to-date, Week and Day | |
| Select Chart Type: | ||
| Too many stocks? View smallcap stocks filtered by marketcap & sector |
| Marketcap: All SmallCap Stocks (default-no microcap), Large, Mid-Range, Small & MicroCap |
| Sector: Tech, Finance, Energy, Staples, Retail, Industrial, Materials, Utilities & Medical |
|
Best Stocks Today 12Stocks.com |
© 2024 12Stocks.com Terms & Conditions Privacy Contact Us
All Information Provided Only For Education And Not To Be Used For Investing or Trading. See Terms & Conditions


One More Thing ... Get Best Stocks Delivered Daily!
Never Ever Miss A Move With Our Top Ten Stocks Lists
Find Best Stocks In Any Market - Bull or Bear Market
Take A Peek At Our Top Ten Stocks Lists: Daily, Weekly, Year-to-Date & Top Trends
Find Best Stocks In Any Market - Bull or Bear Market
Take A Peek At Our Top Ten Stocks Lists: Daily, Weekly, Year-to-Date & Top Trends
Smallcap Stocks With Best Up Trends [0-bearish to 100-bullish]: Badger Meter[100], Apogee Enterprises[100], Cullinan Oncology[100], Oscar Health[100], Richardson Electronics[100], NextNav [100], Lantheus [100], Envestnet [100], Geron [100], Seneca Foods[100], IMAX [100]
Best Smallcap Stocks Year-to-Date:
Agenus [522.66%], CareMax [417.53%], Janux [348.12%], Viking [251.48%], Super Micro[239.3%], Alpine Immune[238.6%], Longboard [184.12%], Vera [161.3%], Avidity Biosciences[159.18%], Hippo [128.32%], Acrivon [118.61%] Best Smallcap Stocks This Week:
Macatawa Bank[45.05%], 23andMe Holding[33.3%], ProKidney [32%], Snap One[29.73%], Vertex Energy[25.96%], ALX Oncology[22.79%], Vanda [21.84%], Expensify [18.37%], E.W. Scripps[15%], Cullinan Oncology[13.89%], Humacyte [12.67%] Best Smallcap Stocks Daily:
23andMe Holding[65.91%], Vertex Energy[33.78%], Expensify [15.23%], Vuzix [13.73%], Badger Meter[12.03%], E.W. Scripps[11.68%], Zura Bio[10.99%], Vaxxinity [10.05%], Barnes Group[9.70%], eHealth [9.68%], Montrose Environmental[8.91%]