
 Login Sign Up


| |||||
 |  | ||||

| 12Stocks.com Market Intelligence |
Best S&P 500 Stocks
|
On this page, you will find the most comprehensive analysis of S&P 500 stocks and ETFs - from latest trends to performances to charts ➞. First, here are the year-to-date (YTD) performances of the most requested S&P 500 stocks at 12Stocks.com (click stock for review):
| NVIDIA 70% | ||
| Caterpillar 21% | ||
| Amazon.com 19% | ||
| Merck 15% | ||
| Walmart 14% | ||
| Google 11% | ||
| Microsoft 10% | ||
| JPMorgan Chase 6% | ||
| Chevron 5% | ||
| Goldman Sachs 5% | ||
| Johnson & Johnson -8% | ||
| McDonald s -9% | ||
| Starbucks -10% | ||
| Apple -13% | ||
| Gilead -17% | ||
| Intel -29% | ||
| Boeing -35% | ||
| Quick: S&P 500 Stocks Lists: Performances & Trends, S&P 500 Stock Charts
Sort S&P 500 stocks: Daily, Weekly, Year-to-Date, Market Cap & Trends. Filter S&P 500 stocks list by sector: Show all, Tech, Finance, Energy, Staples, Retail, Industrial, Materials, Utilities and HealthCare |
| 12Stocks.com S&P 500 Stocks Performances & Trends Daily Report | |||||||||
|
| 
The overall Smart Investing & Trading Score is 26 (0-bearish to 100-bullish) which puts S&P 500 index in short term bearish to neutral trend. The Smart Investing & Trading Score from previous trading session is 31 and a deterioration of trend continues. | ||||||||
Here are the Smart Investing & Trading Scores of the most requested S&P 500 stocks at 12Stocks.com (click stock name for detailed review):
|


| 12Stocks.com: Top Performing S&P 500 Index Stocks | ||||||||||||||||||||||||||||||||||||||||||||||||
 The top performing S&P 500 Index stocks year to date are
Now, more recently, over last week, the top performing S&P 500 Index stocks on the move are


|
||||||||||||||||||||||||||||||||||||||||||||||||
| 12Stocks.com: Investing in S&P 500 Index with Stocks | |
|
The following table helps investors and traders sort through current performance and trends (as measured by Smart Investing & Trading Score) of various
stocks in the S&P 500 Index. Quick View: Move mouse or cursor over stock symbol (ticker) to view short-term technical chart and over stock name to view long term chart. Click on  to add stock symbol to your watchlist and to add stock symbol to your watchlist and  to view watchlist. Click on any ticker or stock name for detailed market intelligence report for that stock. to view watchlist. Click on any ticker or stock name for detailed market intelligence report for that stock. |
12Stocks.com Performance of Stocks in S&P 500 Index
| Ticker | Stock Name | Watchlist | Category | Recent Price | Smart Investing & Trading Score | Change % | YTD Change% |
| CHD | Church & Dwight Co |   | Consumer Staples | 103.49 | 70 | 0.23% | 9.44% |
| KEYS | Keysight Technologies | | Technology | 149.93 | 10 | -1.10% | -5.76% |
| AEE | Ameren | | Utilities | 71.93 | 61 | 2.26% | -0.57% |
| DAL | Delta Air | | Transports | 47.88 | 73 | 2.86% | 19.02% |
| FTNT | Fortinet | | Technology | 64.66 | 23 | 0.28% | 10.47% |
| CDNS | Cadence Design | | Technology | 293.71 | 26 | -2.36% | 7.83% |
| MPC | Marathon | | Energy | 202.46 | 44 | -0.69% | 36.47% |
| WMB | Williams | | Energy | 37.68 | 43 | 0.08% | 8.18% |
| CMG | Chipotle Mexican | | Services & Goods | 2902.96 | 51 | -1.34% | 26.94% |
| MCHP | Microchip | | Technology | 85.07 | 21 | -1.00% | -5.67% |
| ARE | Alexandria Real | | Financials | 116.45 | 10 | -0.46% | -8.14% |
| AME | AMETEK | | Industrials | 178.05 | 26 | -0.58% | 7.98% |
| PPL | PPL | | Utilities | 26.42 | 53 | 1.58% | -2.51% |
| LYB | LyondellBasell Industries | | Materials | 99.70 | 33 | 0.55% | 4.86% |
| FTV | Fortive | | Technology | 80.20 | 26 | -1.04% | 8.92% |
| GLW | Corning | | Technology | 30.98 | 10 | 0.19% | 1.74% |
| PANW | Palo Alto | | Technology | 277.33 | 30 | 0.84% | -5.95% |
| MTD | Mettler-Toledo | | Health Care | 1198.03 | 23 | -2.46% | -1.23% |
| IDXX | IDEXX | | Health Care | 478.24 | 0 | -2.31% | -13.84% |
| BBY | Best Buy | | Services & Goods | 76.23 | 43 | 1.41% | -2.62% |
| ROK | Rockwell Automation | | Industrials | 278.65 | 43 | -0.97% | -10.25% |
| CPRT | Copart | | Services & Goods | 54.02 | 26 | -0.66% | 10.24% |
| COO | Cooper | | Health Care | 89.86 | 0 | -0.74% | -5.02% |
| INCY | Incyte | | Health Care | 52.72 | 0 | -0.94% | -16.04% |
| NTRS | Northern Trust | | Financials | 81.23 | 36 | 2.10% | -3.73% |
| For chart view version of above stock list: Chart View ➞ 0 - 25 , 25 - 50 , 50 - 75 , 75 - 100 , 100 - 125 , 125 - 150 , 150 - 175 , 175 - 200 , 200 - 225 , 225 - 250 , 250 - 275 , 275 - 300 , 300 - 325 , 325 - 350 , 350 - 375 , 375 - 400 , 400 - 425 , 425 - 450 , 450 - 475 , 475 - 500 | ||
 | Click To Change The Sort Order: By Market Cap or Company Size Performance: Year-to-date, Week and Day |  |
|
Get the most comprehensive stock market coverage daily at 12Stocks.com ➞ Best Stocks Today ➞ Best Stocks Weekly ➞ Best Stocks Year-to-Date ➞ Best Stocks Trends ➞  Best Stocks Today 12Stocks.com Best Nasdaq Stocks ➞ Best S&P 500 Stocks ➞ Best Tech Stocks ➞ Best Biotech Stocks ➞ |
| Detailed Overview of S&P 500 Stocks |
| S&P 500 Technical Overview, Leaders & Laggards, Top S&P 500 ETF Funds & Detailed S&P 500 Stocks List, Charts, Trends & More |
| S&P 500: Technical Analysis, Trends & YTD Performance | |
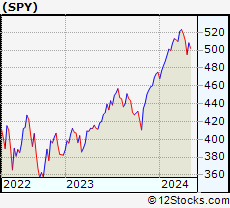
| S&P 500 index as represented by
SPY, an exchange-traded fund [ETF], holds basket of five hundred (mostly largecap) stocks from across all major sectors of the US stock market. The S&P 500 index (contains stocks like Apple and Exxon) is up by 5.31% and is currently outperforming the overall market by 0.9% year-to-date. Below is a quick view of technical charts and trends: | |
 SPY Weekly Chart |
|
| Long Term Trend: Good | |
| Medium Term Trend: Not Good | |
 SPY Daily Chart |
|
| Short Term Trend: Not Good | |
| Overall Trend Score: 26 | |
| YTD Performance: 5.31% | |
| **Trend Scores & Views Are Only For Educational Purposes And Not For Investing | |
| 12Stocks.com: Investing in S&P 500 Index using Exchange Traded Funds | |
|
The following table shows list of key exchange traded funds (ETF) that
help investors track S&P 500 index. The following list also includes leveraged ETF funds that track twice or thrice the daily returns of S&P 500 indices. Short or inverse ETF funds move in the opposite direction to the index they track and are useful during market pullbacks or during bear markets. Quick View: Move mouse or cursor over ETF symbol (ticker) to view short-term technical chart and over ETF name to view long term chart. Click on ticker or stock name for detailed view. Click on to add stock symbol to your watchlist and to view watchlist. |
12Stocks.com List of ETFs that track S&P 500 Index
| Ticker | ETF Name | Watchlist | Recent Price | Smart Investing & Trading Score | Change % | Week % | Year-to-date % |
| SPY | SPDR S&P 500 ETF | | 500.55 | 26 | -0.59 | -2.02 | 5.31% |
| IVV | iShares Core S&P 500 ETF | | 503.04 | 26 | -0.62 | -2 | 5.32% |
| VOO | Vanguard 500 ETF | | 459.99 | 26 | -0.65 | -2.04 | 5.31% |
| OEF | iShares S&P 100 | | 237.92 | 26 | -0.62 | -2.15 | 6.5% |
| SSO | ProShares Ultra S&P500 | | 70.66 | 26 | -1.24 | -4.07 | 8.59% |
| UPRO | ProShares UltraPro S&P500 | | 61.26 | 26 | -1.78 | -6.04 | 11.91% |
| SPXL | Direxion Daily S&P500 Bull 3X ETF | | 116.35 | 36 | -1.96 | -6.05 | 11.89% |
| SH | ProShares Short S&P500 | | 12.44 | 74 | 0.57 | 2.05 | -4.23% |
| SDS | ProShares UltraShort S&P500 | | 27.27 | 74 | 1.26 | 4.2 | -8.86% |
| SPXU | ProShares UltraPro Short S&P500 | | 37.07 | 74 | 1.90 | 6.34 | -13.79% |
| SPXS | Direxion Daily S&P 500 Bear 3X ETF | | 10.01 | 64 | 1.83 | 6.26 | -13.33% |
| 12Stocks.com: Charts, Trends, Fundamental Data and Performances of S&P 500 Stocks | |
|
We now take in-depth look at all S&P 500 stocks including charts, multi-period performances and overall trends (as measured by Smart Investing & Trading Score). One can sort S&P 500 stocks (click link to choose) by Daily, Weekly and by Year-to-Date performances. Also, one can sort by size of the company or by market capitalization. |
| Select Your Default Chart Type: | |||||
| |||||
| Click on stock symbol or name for detailed view. Click on to add stock symbol to your watchlist and to view watchlist. Quick View: Move mouse or cursor over "Daily" to quickly view daily technical stock chart and over "Weekly" to view weekly technical stock chart. | |||||

 | CHD Church & Dwight Co., Inc. |
| Sector: Consumer Staples | |
| SubSector: Cleaning Products | |
| MarketCap: 17425.7 Millions | |
| Recent Price: 103.49 Smart Investing & Trading Score: 70 | |
| Day Percent Change: 0.23% Day Change: 0.24 | |
| Week Change: 2.38% Year-to-date Change: 9.4% | |
| CHD Links: Profile News Message Board | |
| Charts:- Daily , Weekly | |
| Add CHD to Watchlist: View: Get CHD Trend Analysis ➞ | |
 | KEYS Keysight Technologies, Inc. |
| Sector: Technology | |
| SubSector: Scientific & Technical Instruments | |
| MarketCap: 17355.1 Millions | |
| Recent Price: 149.93 Smart Investing & Trading Score: 10 | |
| Day Percent Change: -1.10% Day Change: -1.67 | |
| Week Change: -3.33% Year-to-date Change: -5.8% | |
| KEYS Links: Profile News Message Board | |
| Charts:- Daily , Weekly | |
| Add KEYS to Watchlist: View: Get KEYS Trend Analysis ➞ | |
 | AEE Ameren Corporation |
| Sector: Utilities | |
| SubSector: Electric Utilities | |
| MarketCap: 17308.2 Millions | |
| Recent Price: 71.93 Smart Investing & Trading Score: 61 | |
| Day Percent Change: 2.26% Day Change: 1.59 | |
| Week Change: 0.24% Year-to-date Change: -0.6% | |
| AEE Links: Profile News Message Board | |
| Charts:- Daily , Weekly | |
| Add AEE to Watchlist: View: Get AEE Trend Analysis ➞ | |
 | DAL Delta Air Lines, Inc. |
| Sector: Transports | |
| SubSector: Major Airlines | |
| MarketCap: 17298.5 Millions | |
| Recent Price: 47.88 Smart Investing & Trading Score: 73 | |
| Day Percent Change: 2.86% Day Change: 1.33 | |
| Week Change: 2.18% Year-to-date Change: 19.0% | |
| DAL Links: Profile News Message Board | |
| Charts:- Daily , Weekly | |
| Add DAL to Watchlist: View: Get DAL Trend Analysis ➞ | |
 | FTNT Fortinet, Inc. |
| Sector: Technology | |
| SubSector: Application Software | |
| MarketCap: 16993.8 Millions | |
| Recent Price: 64.66 Smart Investing & Trading Score: 23 | |
| Day Percent Change: 0.28% Day Change: 0.18 | |
| Week Change: -5.22% Year-to-date Change: 10.5% | |
| FTNT Links: Profile News Message Board | |
| Charts:- Daily , Weekly | |
| Add FTNT to Watchlist: View: Get FTNT Trend Analysis ➞ | |
 | CDNS Cadence Design Systems, Inc. |
| Sector: Technology | |
| SubSector: Application Software | |
| MarketCap: 16865.8 Millions | |
| Recent Price: 293.71 Smart Investing & Trading Score: 26 | |
| Day Percent Change: -2.36% Day Change: -7.10 | |
| Week Change: -3.97% Year-to-date Change: 7.8% | |
| CDNS Links: Profile News Message Board | |
| Charts:- Daily , Weekly | |
| Add CDNS to Watchlist: View: Get CDNS Trend Analysis ➞ | |
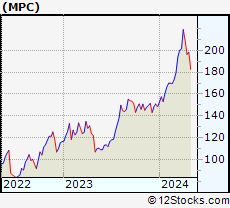 | MPC Marathon Petroleum Corporation |
| Sector: Energy | |
| SubSector: Oil & Gas Refining & Marketing | |
| MarketCap: 16862.4 Millions | |
| Recent Price: 202.46 Smart Investing & Trading Score: 44 | |
| Day Percent Change: -0.69% Day Change: -1.40 | |
| Week Change: -3.02% Year-to-date Change: 36.5% | |
| MPC Links: Profile News Message Board | |
| Charts:- Daily , Weekly | |
| Add MPC to Watchlist: View: Get MPC Trend Analysis ➞ | |
 | WMB The Williams Companies, Inc. |
| Sector: Energy | |
| SubSector: Oil & Gas Pipelines | |
| MarketCap: 16851.5 Millions | |
| Recent Price: 37.68 Smart Investing & Trading Score: 43 | |
| Day Percent Change: 0.08% Day Change: 0.03 | |
| Week Change: -1.05% Year-to-date Change: 8.2% | |
| WMB Links: Profile News Message Board | |
| Charts:- Daily , Weekly | |
| Add WMB to Watchlist: View: Get WMB Trend Analysis ➞ | |
 | CMG Chipotle Mexican Grill, Inc. |
| Sector: Services & Goods | |
| SubSector: Restaurants | |
| MarketCap: 16849.9 Millions | |
| Recent Price: 2902.96 Smart Investing & Trading Score: 51 | |
| Day Percent Change: -1.34% Day Change: -39.37 | |
| Week Change: -1.85% Year-to-date Change: 26.9% | |
| CMG Links: Profile News Message Board | |
| Charts:- Daily , Weekly | |
| Add CMG to Watchlist: View: Get CMG Trend Analysis ➞ | |
 | MCHP Microchip Technology Incorporated |
| Sector: Technology | |
| SubSector: Semiconductor - Broad Line | |
| MarketCap: 16826.3 Millions | |
| Recent Price: 85.07 Smart Investing & Trading Score: 21 | |
| Day Percent Change: -1.00% Day Change: -0.86 | |
| Week Change: -0.67% Year-to-date Change: -5.7% | |
| MCHP Links: Profile News Message Board | |
| Charts:- Daily , Weekly | |
| Add MCHP to Watchlist: View: Get MCHP Trend Analysis ➞ | |
 | ARE Alexandria Real Estate Equities, Inc. |
| Sector: Financials | |
| SubSector: REIT - Office | |
| MarketCap: 16793.6 Millions | |
| Recent Price: 116.45 Smart Investing & Trading Score: 10 | |
| Day Percent Change: -0.46% Day Change: -0.54 | |
| Week Change: -4.42% Year-to-date Change: -8.1% | |
| ARE Links: Profile News Message Board | |
| Charts:- Daily , Weekly | |
| Add ARE to Watchlist: View: Get ARE Trend Analysis ➞ | |
 | AME AMETEK, Inc. |
| Sector: Industrials | |
| SubSector: Diversified Machinery | |
| MarketCap: 16611.8 Millions | |
| Recent Price: 178.05 Smart Investing & Trading Score: 26 | |
| Day Percent Change: -0.58% Day Change: -1.04 | |
| Week Change: -0.92% Year-to-date Change: 8.0% | |
| AME Links: Profile News Message Board | |
| Charts:- Daily , Weekly | |
| Add AME to Watchlist: View: Get AME Trend Analysis ➞ | |
 | PPL PPL Corporation |
| Sector: Utilities | |
| SubSector: Electric Utilities | |
| MarketCap: 16588.8 Millions | |
| Recent Price: 26.42 Smart Investing & Trading Score: 53 | |
| Day Percent Change: 1.58% Day Change: 0.41 | |
| Week Change: -0.79% Year-to-date Change: -2.5% | |
| PPL Links: Profile News Message Board | |
| Charts:- Daily , Weekly | |
| Add PPL to Watchlist: View: Get PPL Trend Analysis ➞ | |
 | LYB LyondellBasell Industries N.V. |
| Sector: Materials | |
| SubSector: Specialty Chemicals | |
| MarketCap: 16420.7 Millions | |
| Recent Price: 99.70 Smart Investing & Trading Score: 33 | |
| Day Percent Change: 0.55% Day Change: 0.55 | |
| Week Change: -1.8% Year-to-date Change: 4.9% | |
| LYB Links: Profile News Message Board | |
| Charts:- Daily , Weekly | |
| Add LYB to Watchlist: View: Get LYB Trend Analysis ➞ | |
 | FTV Fortive Corporation |
| Sector: Technology | |
| SubSector: Scientific & Technical Instruments | |
| MarketCap: 16351.9 Millions | |
| Recent Price: 80.20 Smart Investing & Trading Score: 26 | |
| Day Percent Change: -1.04% Day Change: -0.84 | |
| Week Change: -2.68% Year-to-date Change: 8.9% | |
| FTV Links: Profile News Message Board | |
| Charts:- Daily , Weekly | |
| Add FTV to Watchlist: View: Get FTV Trend Analysis ➞ | |
 | GLW Corning Incorporated |
| Sector: Technology | |
| SubSector: Diversified Electronics | |
| MarketCap: 16287.6 Millions | |
| Recent Price: 30.98 Smart Investing & Trading Score: 10 | |
| Day Percent Change: 0.19% Day Change: 0.06 | |
| Week Change: -1.62% Year-to-date Change: 1.7% | |
| GLW Links: Profile News Message Board | |
| Charts:- Daily , Weekly | |
| Add GLW to Watchlist: View: Get GLW Trend Analysis ➞ | |
 | PANW Palo Alto Networks, Inc. |
| Sector: Technology | |
| SubSector: Networking & Communication Devices | |
| MarketCap: 16039.4 Millions | |
| Recent Price: 277.33 Smart Investing & Trading Score: 30 | |
| Day Percent Change: 0.84% Day Change: 2.31 | |
| Week Change: -0.62% Year-to-date Change: -6.0% | |
| PANW Links: Profile News Message Board | |
| Charts:- Daily , Weekly | |
| Add PANW to Watchlist: View: Get PANW Trend Analysis ➞ | |
 | MTD Mettler-Toledo International Inc. |
| Sector: Health Care | |
| SubSector: Medical Instruments & Supplies | |
| MarketCap: 15973.1 Millions | |
| Recent Price: 1198.03 Smart Investing & Trading Score: 23 | |
| Day Percent Change: -2.46% Day Change: -30.27 | |
| Week Change: -5% Year-to-date Change: -1.2% | |
| MTD Links: Profile News Message Board | |
| Charts:- Daily , Weekly | |
| Add MTD to Watchlist: View: Get MTD Trend Analysis ➞ | |
 | IDXX IDEXX Laboratories, Inc. |
| Sector: Health Care | |
| SubSector: Diagnostic Substances | |
| MarketCap: 15937.1 Millions | |
| Recent Price: 478.24 Smart Investing & Trading Score: 0 | |
| Day Percent Change: -2.31% Day Change: -11.33 | |
| Week Change: -3.93% Year-to-date Change: -13.8% | |
| IDXX Links: Profile News Message Board | |
| Charts:- Daily , Weekly | |
| Add IDXX to Watchlist: View: Get IDXX Trend Analysis ➞ | |
 | BBY Best Buy Co., Inc. |
| Sector: Services & Goods | |
| SubSector: Electronics Stores | |
| MarketCap: 15771.3 Millions | |
| Recent Price: 76.23 Smart Investing & Trading Score: 43 | |
| Day Percent Change: 1.41% Day Change: 1.06 | |
| Week Change: -2.27% Year-to-date Change: -2.6% | |
| BBY Links: Profile News Message Board | |
| Charts:- Daily , Weekly | |
| Add BBY to Watchlist: View: Get BBY Trend Analysis ➞ | |
 | ROK Rockwell Automation, Inc. |
| Sector: Industrials | |
| SubSector: Diversified Machinery | |
| MarketCap: 15666.1 Millions | |
| Recent Price: 278.65 Smart Investing & Trading Score: 43 | |
| Day Percent Change: -0.97% Day Change: -2.74 | |
| Week Change: -2.17% Year-to-date Change: -10.3% | |
| ROK Links: Profile News Message Board | |
| Charts:- Daily , Weekly | |
| Add ROK to Watchlist: View: Get ROK Trend Analysis ➞ | |
 | CPRT Copart, Inc. |
| Sector: Services & Goods | |
| SubSector: Auto Dealerships | |
| MarketCap: 15462.1 Millions | |
| Recent Price: 54.02 Smart Investing & Trading Score: 26 | |
| Day Percent Change: -0.66% Day Change: -0.36 | |
| Week Change: -2.46% Year-to-date Change: 10.2% | |
| CPRT Links: Profile News Message Board | |
| Charts:- Daily , Weekly | |
| Add CPRT to Watchlist: View: Get CPRT Trend Analysis ➞ | |
 | COO The Cooper Companies, Inc. |
| Sector: Health Care | |
| SubSector: Medical Instruments & Supplies | |
| MarketCap: 15460 Millions | |
| Recent Price: 89.86 Smart Investing & Trading Score: 0 | |
| Day Percent Change: -0.74% Day Change: -0.67 | |
| Week Change: -3.91% Year-to-date Change: -5.0% | |
| COO Links: Profile News Message Board | |
| Charts:- Daily , Weekly | |
| Add COO to Watchlist: View: Get COO Trend Analysis ➞ | |
 | INCY Incyte Corporation |
| Sector: Health Care | |
| SubSector: Biotechnology | |
| MarketCap: 15343.2 Millions | |
| Recent Price: 52.72 Smart Investing & Trading Score: 0 | |
| Day Percent Change: -0.94% Day Change: -0.50 | |
| Week Change: -2.1% Year-to-date Change: -16.0% | |
| INCY Links: Profile News Message Board | |
| Charts:- Daily , Weekly | |
| Add INCY to Watchlist: View: Get INCY Trend Analysis ➞ | |
 | NTRS Northern Trust Corporation |
| Sector: Financials | |
| SubSector: Asset Management | |
| MarketCap: 15316.8 Millions | |
| Recent Price: 81.23 Smart Investing & Trading Score: 36 | |
| Day Percent Change: 2.10% Day Change: 1.67 | |
| Week Change: -3.1% Year-to-date Change: -3.7% | |
| NTRS Links: Profile News Message Board | |
| Charts:- Daily , Weekly | |
| Add NTRS to Watchlist: View: Get NTRS Trend Analysis ➞ | |
| For tabular summary view of above stock list: Summary View ➞ 0 - 25 , 25 - 50 , 50 - 75 , 75 - 100 , 100 - 125 , 125 - 150 , 150 - 175 , 175 - 200 , 200 - 225 , 225 - 250 , 250 - 275 , 275 - 300 , 300 - 325 , 325 - 350 , 350 - 375 , 375 - 400 , 400 - 425 , 425 - 450 , 450 - 475 , 475 - 500 | ||
| Click To Change The Sort Order: By Market Cap or Company Size Performance: Year-to-date, Week and Day | |
| Select Chart Type: | ||
|
Best Stocks Today 12Stocks.com |
© 2024 12Stocks.com Terms & Conditions Privacy Contact Us
All Information Provided Only For Education And Not To Be Used For Investing or Trading. See Terms & Conditions


One More Thing ... Get Best Stocks Delivered Daily!
Never Ever Miss A Move With Our Top Ten Stocks Lists
Find Best Stocks In Any Market - Bull or Bear Market
Take A Peek At Our Top Ten Stocks Lists: Daily, Weekly, Year-to-Date & Top Trends
Find Best Stocks In Any Market - Bull or Bear Market
Take A Peek At Our Top Ten Stocks Lists: Daily, Weekly, Year-to-Date & Top Trends
S&P 500 Stocks With Best Up Trends [0-bearish to 100-bullish]: United Airlines[100], Conagra Brands[95], Bunge [93], Charles Schwab[88], Lockheed Martin[86], Progressive [83], NextEra [81], Newmont [76], Google [75], Google [75], Yum! Brands[75]
Best S&P 500 Stocks Year-to-Date:
NVIDIA [69.69%], Constellation [58.3%], NRG [42.01%], Meta Platforms[39.59%], Marathon [36.47%], Micron [36.31%], Western Digital[33.99%], Progressive [31.29%], Diamondback [29.71%], Targa Resources[29.19%], Eaton [28.8%] Best S&P 500 Stocks This Week:
United Airlines[16.6%], UnitedHealth [9.06%], Globe Life[7.01%], ProShares UltraPro[6.34%], American Airlines[5.63%], Morgan Stanley[4.51%], Southwest Airlines[4.5%], Goldman Sachs[3.7%], Charles Schwab[3.53%], General Mills[3.49%], Humana [3.48%] Best S&P 500 Stocks Daily:
United Airlines[17.45%], American Airlines[6.60%], Globe Life[5.44%], NextEra [3.39%], Consolidated Edison[3.33%], Norwegian Cruise[3.15%], Dominion [3.12%], Southern [3.00%], Delta Air[2.86%], First Solar[2.85%], Southwest Airlines[2.60%]