
 Login Sign Up


| |||||
 |  | ||||

| 12Stocks.com Market Intelligence |
Best S&P 500 Stocks
|
On this page, you will find the most comprehensive analysis of S&P 500 stocks and ETFs - from latest trends to performances to charts ➞. First, here are the year-to-date (YTD) performances of the most requested S&P 500 stocks at 12Stocks.com (click stock for review):
| NVIDIA 71% | ||
| Caterpillar 21% | ||
| Amazon.com 18% | ||
| Merck 15% | ||
| Walmart 13% | ||
| Google 12% | ||
| Microsoft 8% | ||
| JPMorgan Chase 7% | ||
| Chevron 6% | ||
| Goldman Sachs 4% | ||
| Johnson & Johnson -7% | ||
| McDonald s -9% | ||
| Starbucks -9% | ||
| Apple -13% | ||
| Gilead -18% | ||
| Intel -30% | ||
| Boeing -35% | ||
| Quick: S&P 500 Stocks Lists: Performances & Trends, S&P 500 Stock Charts
Sort S&P 500 stocks: Daily, Weekly, Year-to-Date, Market Cap & Trends. Filter S&P 500 stocks list by sector: Show all, Tech, Finance, Energy, Staples, Retail, Industrial, Materials, Utilities and HealthCare |
| 12Stocks.com S&P 500 Stocks Performances & Trends Daily Report | |||||||||
|
| 
The overall Smart Investing & Trading Score is 36 (0-bearish to 100-bullish) which puts S&P 500 index in short term bearish to neutral trend. The Smart Investing & Trading Score from previous trading session is 26 and hence an improvement of trend. | ||||||||
Here are the Smart Investing & Trading Scores of the most requested S&P 500 stocks at 12Stocks.com (click stock name for detailed review):
|


| 12Stocks.com: Top Performing S&P 500 Index Stocks | ||||||||||||||||||||||||||||||||||||||||||||||||
 The top performing S&P 500 Index stocks year to date are
Now, more recently, over last week, the top performing S&P 500 Index stocks on the move are


|
||||||||||||||||||||||||||||||||||||||||||||||||
| 12Stocks.com: Investing in S&P 500 Index with Stocks | |
|
The following table helps investors and traders sort through current performance and trends (as measured by Smart Investing & Trading Score) of various
stocks in the S&P 500 Index. Quick View: Move mouse or cursor over stock symbol (ticker) to view short-term technical chart and over stock name to view long term chart. Click on  to add stock symbol to your watchlist and to add stock symbol to your watchlist and  to view watchlist. Click on any ticker or stock name for detailed market intelligence report for that stock. to view watchlist. Click on any ticker or stock name for detailed market intelligence report for that stock. |
12Stocks.com Performance of Stocks in S&P 500 Index
| Ticker | Stock Name | Watchlist | Category | Recent Price | Smart Investing & Trading Score | Change % | YTD Change% |
| REGN | Regeneron |   | Health Care | 893.99 | 18 | -0.80% | 1.79% |
| CB | Chubb | | Financials | 245.39 | 38 | 0.76% | 8.58% |
| BX | Blackstone | | Financials | 120.32 | 8 | -2.33% | -8.10% |
| ISRG | Intuitive Surgical | | Health Care | 372.63 | 0 | -0.41% | 10.45% |
| TJX | TJX | | Services & Goods | 92.66 | 18 | -0.50% | -1.23% |
| KVUE | Kenvue | | Consumer Staples | 19.41 | 42 | 0.70% | -9.58% |
| PLD | Prologis | | Financials | 104.69 | 0 | -1.69% | -21.46% |
| WM | Waste Management | | Industrials | 205.07 | 49 | -0.52% | 14.50% |
| ECL | Ecolab | | Materials | 219.21 | 44 | -0.02% | 10.52% |
| APD | Air Products | | Materials | 233.02 | 42 | 1.75% | -14.89% |
| WBA | Walgreens Boots | | Services & Goods | 17.59 | 28 | -0.23% | -32.63% |
| ICE | Intercontinental Exchange | | Financials | 130.98 | 51 | 0.18% | 1.99% |
| EQIX | Equinix | | Financials | 739.85 | 25 | 0.72% | -8.14% |
| ITW | Illinois Tool | | Industrials | 248.83 | 10 | -0.28% | -5.00% |
| MU | Micron | | Technology | 111.93 | 36 | -3.78% | 31.16% |
| SCHW | Charles Schwab | | Financials | 72.93 | 93 | 0.59% | 6.00% |
| TFC | Truist Financial | | Financials | 35.71 | 27 | 0.14% | -3.28% |
| KMB | Kimberly-Clark | | Consumer Staples | 125.61 | 61 | -0.28% | 3.37% |
| PGR | Progressive | | Financials | 209.75 | 83 | 0.30% | 31.69% |
| MMC | Marsh & McLennan | | Financials | 201.73 | 58 | 2.08% | 6.47% |
| UBER | Uber Technologies | | Technology | 71.30 | 26 | -0.89% | 15.80% |
| CSX | CSX | | Transports | 34.39 | 17 | 0.67% | -0.81% |
| BSX | Boston Scientific | | Health Care | 67.42 | 39 | -0.79% | 16.62% |
| PNC | PNC Financial | | Financials | 147.89 | 27 | 0.43% | -4.49% |
| SHW | Sherwin-Williams | | Materials | 309.38 | 43 | -0.25% | -0.81% |
| For chart view version of above stock list: Chart View ➞ 0 - 25 , 25 - 50 , 50 - 75 , 75 - 100 , 100 - 125 , 125 - 150 , 150 - 175 , 175 - 200 , 200 - 225 , 225 - 250 , 250 - 275 , 275 - 300 , 300 - 325 , 325 - 350 , 350 - 375 , 375 - 400 , 400 - 425 , 425 - 450 , 450 - 475 , 475 - 500 | ||
 | Click To Change The Sort Order: By Market Cap or Company Size Performance: Year-to-date, Week and Day |  |
|
Get the most comprehensive stock market coverage daily at 12Stocks.com ➞ Best Stocks Today ➞ Best Stocks Weekly ➞ Best Stocks Year-to-Date ➞ Best Stocks Trends ➞  Best Stocks Today 12Stocks.com Best Nasdaq Stocks ➞ Best S&P 500 Stocks ➞ Best Tech Stocks ➞ Best Biotech Stocks ➞ |
| Detailed Overview of S&P 500 Stocks |
| S&P 500 Technical Overview, Leaders & Laggards, Top S&P 500 ETF Funds & Detailed S&P 500 Stocks List, Charts, Trends & More |
| S&P 500: Technical Analysis, Trends & YTD Performance | |
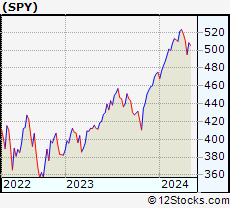
| S&P 500 index as represented by
SPY, an exchange-traded fund [ETF], holds basket of five hundred (mostly largecap) stocks from across all major sectors of the US stock market. The S&P 500 index (contains stocks like Apple and Exxon) is up by 5.09% and is currently outperforming the overall market by 0.9% year-to-date. Below is a quick view of technical charts and trends: | |
 SPY Weekly Chart |
|
| Long Term Trend: Good | |
| Medium Term Trend: Not Good | |
 SPY Daily Chart |
|
| Short Term Trend: Not Good | |
| Overall Trend Score: 36 | |
| YTD Performance: 5.09% | |
| **Trend Scores & Views Are Only For Educational Purposes And Not For Investing | |
| 12Stocks.com: Investing in S&P 500 Index using Exchange Traded Funds | |
|
The following table shows list of key exchange traded funds (ETF) that
help investors track S&P 500 index. The following list also includes leveraged ETF funds that track twice or thrice the daily returns of S&P 500 indices. Short or inverse ETF funds move in the opposite direction to the index they track and are useful during market pullbacks or during bear markets. Quick View: Move mouse or cursor over ETF symbol (ticker) to view short-term technical chart and over ETF name to view long term chart. Click on ticker or stock name for detailed view. Click on to add stock symbol to your watchlist and to view watchlist. |
12Stocks.com List of ETFs that track S&P 500 Index
| Ticker | ETF Name | Watchlist | Recent Price | Smart Investing & Trading Score | Change % | Week % | Year-to-date % |
| SPY | SPDR S&P 500 ETF | | 499.52 | 36 | -0.21 | -2.22 | 5.09% |
| IVV | iShares Core S&P 500 ETF | | 501.88 | 36 | -0.23 | -2.23 | 5.08% |
| VOO | Vanguard 500 ETF | | 458.94 | 36 | -0.23 | -2.26 | 5.07% |
| OEF | iShares S&P 100 | | 237.62 | 36 | -0.13 | -2.27 | 6.37% |
| SSO | ProShares Ultra S&P500 | | 70.33 | 36 | -0.47 | -4.52 | 8.08% |
| UPRO | ProShares UltraPro S&P500 | | 60.78 | 36 | -0.78 | -6.78 | 11.03% |
| SPXL | Direxion Daily S&P500 Bull 3X ETF | | 115.53 | 36 | -0.70 | -6.71 | 11.1% |
| SH | ProShares Short S&P500 | | 12.47 | 74 | 0.24 | 2.3 | -4% |
| SDS | ProShares UltraShort S&P500 | | 27.41 | 74 | 0.51 | 4.74 | -8.39% |
| SPXU | ProShares UltraPro Short S&P500 | | 37.33 | 69 | 0.70 | 7.09 | -13.19% |
| SPXS | Direxion Daily S&P 500 Bear 3X ETF | | 10.11 | 69 | 1.00 | 7.32 | -12.47% |
| 12Stocks.com: Charts, Trends, Fundamental Data and Performances of S&P 500 Stocks | |
|
We now take in-depth look at all S&P 500 stocks including charts, multi-period performances and overall trends (as measured by Smart Investing & Trading Score). One can sort S&P 500 stocks (click link to choose) by Daily, Weekly and by Year-to-Date performances. Also, one can sort by size of the company or by market capitalization. |
| Select Your Default Chart Type: | |||||
| |||||
| Click on stock symbol or name for detailed view. Click on to add stock symbol to your watchlist and to view watchlist. Quick View: Move mouse or cursor over "Daily" to quickly view daily technical stock chart and over "Weekly" to view weekly technical stock chart. | |||||

 | REGN Regeneron Pharmaceuticals, Inc. |
| Sector: Health Care | |
| SubSector: Biotechnology | |
| MarketCap: 51903.7 Millions | |
| Recent Price: 893.99 Smart Investing & Trading Score: 18 | |
| Day Percent Change: -0.80% Day Change: -7.20 | |
| Week Change: -1.18% Year-to-date Change: 1.8% | |
| REGN Links: Profile News Message Board | |
| Charts:- Daily , Weekly | |
| Add REGN to Watchlist: View: Get REGN Trend Analysis ➞ | |
 | CB Chubb Limited |
| Sector: Financials | |
| SubSector: Property & Casualty Insurance | |
| MarketCap: 51615.9 Millions | |
| Recent Price: 245.39 Smart Investing & Trading Score: 38 | |
| Day Percent Change: 0.76% Day Change: 1.86 | |
| Week Change: -0.17% Year-to-date Change: 8.6% | |
| CB Links: Profile News Message Board | |
| Charts:- Daily , Weekly | |
| Add CB to Watchlist: View: Get CB Trend Analysis ➞ | |
 | BX The Blackstone Group Inc. |
| Sector: Financials | |
| SubSector: Asset Management | |
| MarketCap: 50957.7 Millions | |
| Recent Price: 120.32 Smart Investing & Trading Score: 8 | |
| Day Percent Change: -2.33% Day Change: -2.87 | |
| Week Change: -2.55% Year-to-date Change: -8.1% | |
| BX Links: Profile News Message Board | |
| Charts:- Daily , Weekly | |
| Add BX to Watchlist: View: Get BX Trend Analysis ➞ | |
 | ISRG Intuitive Surgical, Inc. |
| Sector: Health Care | |
| SubSector: Medical Instruments & Supplies | |
| MarketCap: 50917.5 Millions | |
| Recent Price: 372.63 Smart Investing & Trading Score: 0 | |
| Day Percent Change: -0.41% Day Change: -1.54 | |
| Week Change: -3.16% Year-to-date Change: 10.5% | |
| ISRG Links: Profile News Message Board | |
| Charts:- Daily , Weekly | |
| Add ISRG to Watchlist: View: Get ISRG Trend Analysis ➞ | |
 | TJX The TJX Companies, Inc. |
| Sector: Services & Goods | |
| SubSector: Department Stores | |
| MarketCap: 50656.2 Millions | |
| Recent Price: 92.66 Smart Investing & Trading Score: 18 | |
| Day Percent Change: -0.50% Day Change: -0.47 | |
| Week Change: -1.86% Year-to-date Change: -1.2% | |
| TJX Links: Profile News Message Board | |
| Charts:- Daily , Weekly | |
| Add TJX to Watchlist: View: Get TJX Trend Analysis ➞ | |
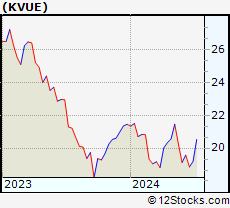 | KVUE Kenvue Inc. |
| Sector: Consumer Staples | |
| SubSector: Household & Personal Products | |
| MarketCap: 50220 Millions | |
| Recent Price: 19.41 Smart Investing & Trading Score: 42 | |
| Day Percent Change: 0.70% Day Change: 0.14 | |
| Week Change: 1.44% Year-to-date Change: -9.6% | |
| KVUE Links: Profile News Message Board | |
| Charts:- Daily , Weekly | |
| Add KVUE to Watchlist: View: Get KVUE Trend Analysis ➞ | |
 | PLD Prologis, Inc. |
| Sector: Financials | |
| SubSector: REIT - Industrial | |
| MarketCap: 48728.9 Millions | |
| Recent Price: 104.69 Smart Investing & Trading Score: 0 | |
| Day Percent Change: -1.69% Day Change: -1.80 | |
| Week Change: -12.03% Year-to-date Change: -21.5% | |
| PLD Links: Profile News Message Board | |
| Charts:- Daily , Weekly | |
| Add PLD to Watchlist: View: Get PLD Trend Analysis ➞ | |
 | WM Waste Management, Inc. |
| Sector: Industrials | |
| SubSector: Waste Management | |
| MarketCap: 46977.4 Millions | |
| Recent Price: 205.07 Smart Investing & Trading Score: 49 | |
| Day Percent Change: -0.52% Day Change: -1.08 | |
| Week Change: -0.15% Year-to-date Change: 14.5% | |
| WM Links: Profile News Message Board | |
| Charts:- Daily , Weekly | |
| Add WM to Watchlist: View: Get WM Trend Analysis ➞ | |
 | ECL Ecolab Inc. |
| Sector: Materials | |
| SubSector: Specialty Chemicals | |
| MarketCap: 46215.9 Millions | |
| Recent Price: 219.21 Smart Investing & Trading Score: 44 | |
| Day Percent Change: -0.02% Day Change: -0.04 | |
| Week Change: -1.12% Year-to-date Change: 10.5% | |
| ECL Links: Profile News Message Board | |
| Charts:- Daily , Weekly | |
| Add ECL to Watchlist: View: Get ECL Trend Analysis ➞ | |
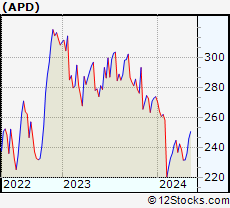 | APD Air Products and Chemicals, Inc. |
| Sector: Materials | |
| SubSector: Chemicals - Major Diversified | |
| MarketCap: 46203.6 Millions | |
| Recent Price: 233.02 Smart Investing & Trading Score: 42 | |
| Day Percent Change: 1.75% Day Change: 4.01 | |
| Week Change: 0.64% Year-to-date Change: -14.9% | |
| APD Links: Profile News Message Board | |
| Charts:- Daily , Weekly | |
| Add APD to Watchlist: View: Get APD Trend Analysis ➞ | |
 | WBA Walgreens Boots Alliance, Inc. |
| Sector: Services & Goods | |
| SubSector: Drug Stores | |
| MarketCap: 46184.1 Millions | |
| Recent Price: 17.59 Smart Investing & Trading Score: 28 | |
| Day Percent Change: -0.23% Day Change: -0.04 | |
| Week Change: -1.46% Year-to-date Change: -32.6% | |
| WBA Links: Profile News Message Board | |
| Charts:- Daily , Weekly | |
| Add WBA to Watchlist: View: Get WBA Trend Analysis ➞ | |
 | ICE Intercontinental Exchange, Inc. |
| Sector: Financials | |
| SubSector: Diversified Investments | |
| MarketCap: 46054.6 Millions | |
| Recent Price: 130.98 Smart Investing & Trading Score: 51 | |
| Day Percent Change: 0.18% Day Change: 0.24 | |
| Week Change: -1.92% Year-to-date Change: 2.0% | |
| ICE Links: Profile News Message Board | |
| Charts:- Daily , Weekly | |
| Add ICE to Watchlist: View: Get ICE Trend Analysis ➞ | |
 | EQIX Equinix, Inc. (REIT) |
| Sector: Financials | |
| SubSector: REIT - Diversified | |
| MarketCap: 45855.3 Millions | |
| Recent Price: 739.85 Smart Investing & Trading Score: 25 | |
| Day Percent Change: 0.72% Day Change: 5.29 | |
| Week Change: -4.39% Year-to-date Change: -8.1% | |
| EQIX Links: Profile News Message Board | |
| Charts:- Daily , Weekly | |
| Add EQIX to Watchlist: View: Get EQIX Trend Analysis ➞ | |
 | ITW Illinois Tool Works Inc. |
| Sector: Industrials | |
| SubSector: Diversified Machinery | |
| MarketCap: 45324.8 Millions | |
| Recent Price: 248.83 Smart Investing & Trading Score: 10 | |
| Day Percent Change: -0.28% Day Change: -0.71 | |
| Week Change: -1.85% Year-to-date Change: -5.0% | |
| ITW Links: Profile News Message Board | |
| Charts:- Daily , Weekly | |
| Add ITW to Watchlist: View: Get ITW Trend Analysis ➞ | |
 | MU Micron Technology, Inc. |
| Sector: Technology | |
| SubSector: Semiconductor- Memory Chips | |
| MarketCap: 45188.4 Millions | |
| Recent Price: 111.93 Smart Investing & Trading Score: 36 | |
| Day Percent Change: -3.78% Day Change: -4.40 | |
| Week Change: -8.64% Year-to-date Change: 31.2% | |
| MU Links: Profile News Message Board | |
| Charts:- Daily , Weekly | |
| Add MU to Watchlist: View: Get MU Trend Analysis ➞ | |
 | SCHW The Charles Schwab Corporation |
| Sector: Financials | |
| SubSector: Investment Brokerage - National | |
| MarketCap: 45115.8 Millions | |
| Recent Price: 72.93 Smart Investing & Trading Score: 93 | |
| Day Percent Change: 0.59% Day Change: 0.43 | |
| Week Change: 4.14% Year-to-date Change: 6.0% | |
| SCHW Links: Profile News Message Board | |
| Charts:- Daily , Weekly | |
| Add SCHW to Watchlist: View: Get SCHW Trend Analysis ➞ | |
 | TFC Truist Financial Corporation |
| Sector: Financials | |
| SubSector: Regional - Southeast Banks | |
| MarketCap: 44928.5 Millions | |
| Recent Price: 35.71 Smart Investing & Trading Score: 27 | |
| Day Percent Change: 0.14% Day Change: 0.05 | |
| Week Change: -2.88% Year-to-date Change: -3.3% | |
| TFC Links: Profile News Message Board | |
| Charts:- Daily , Weekly | |
| Add TFC to Watchlist: View: Get TFC Trend Analysis ➞ | |
 | KMB Kimberly-Clark Corporation |
| Sector: Consumer Staples | |
| SubSector: Personal Products | |
| MarketCap: 44300.5 Millions | |
| Recent Price: 125.61 Smart Investing & Trading Score: 61 | |
| Day Percent Change: -0.28% Day Change: -0.35 | |
| Week Change: 1.39% Year-to-date Change: 3.4% | |
| KMB Links: Profile News Message Board | |
| Charts:- Daily , Weekly | |
| Add KMB to Watchlist: View: Get KMB Trend Analysis ➞ | |
 | PGR The Progressive Corporation |
| Sector: Financials | |
| SubSector: Property & Casualty Insurance | |
| MarketCap: 43112 Millions | |
| Recent Price: 209.75 Smart Investing & Trading Score: 83 | |
| Day Percent Change: 0.30% Day Change: 0.63 | |
| Week Change: 2.87% Year-to-date Change: 31.7% | |
| PGR Links: Profile News Message Board | |
| Charts:- Daily , Weekly | |
| Add PGR to Watchlist: View: Get PGR Trend Analysis ➞ | |
 | MMC Marsh & McLennan Companies, Inc. |
| Sector: Financials | |
| SubSector: Insurance Brokers | |
| MarketCap: 42821.8 Millions | |
| Recent Price: 201.73 Smart Investing & Trading Score: 58 | |
| Day Percent Change: 2.08% Day Change: 4.11 | |
| Week Change: 1.85% Year-to-date Change: 6.5% | |
| MMC Links: Profile News Message Board | |
| Charts:- Daily , Weekly | |
| Add MMC to Watchlist: View: Get MMC Trend Analysis ➞ | |
 | UBER Uber Technologies, Inc. |
| Sector: Technology | |
| SubSector: Application Software | |
| MarketCap: 42671.2 Millions | |
| Recent Price: 71.30 Smart Investing & Trading Score: 26 | |
| Day Percent Change: -0.89% Day Change: -0.64 | |
| Week Change: -5.29% Year-to-date Change: 15.8% | |
| UBER Links: Profile News Message Board | |
| Charts:- Daily , Weekly | |
| Add UBER to Watchlist: View: Get UBER Trend Analysis ➞ | |
 | CSX CSX Corporation |
| Sector: Transports | |
| SubSector: Railroads | |
| MarketCap: 42131.2 Millions | |
| Recent Price: 34.39 Smart Investing & Trading Score: 17 | |
| Day Percent Change: 0.67% Day Change: 0.23 | |
| Week Change: -2.69% Year-to-date Change: -0.8% | |
| CSX Links: Profile News Message Board | |
| Charts:- Daily , Weekly | |
| Add CSX to Watchlist: View: Get CSX Trend Analysis ➞ | |
 | BSX Boston Scientific Corporation |
| Sector: Health Care | |
| SubSector: Medical Appliances & Equipment | |
| MarketCap: 41541.2 Millions | |
| Recent Price: 67.42 Smart Investing & Trading Score: 39 | |
| Day Percent Change: -0.79% Day Change: -0.54 | |
| Week Change: -0.95% Year-to-date Change: 16.6% | |
| BSX Links: Profile News Message Board | |
| Charts:- Daily , Weekly | |
| Add BSX to Watchlist: View: Get BSX Trend Analysis ➞ | |
 | PNC The PNC Financial Services Group, Inc. |
| Sector: Financials | |
| SubSector: Money Center Banks | |
| MarketCap: 41291.5 Millions | |
| Recent Price: 147.89 Smart Investing & Trading Score: 27 | |
| Day Percent Change: 0.43% Day Change: 0.64 | |
| Week Change: -1.82% Year-to-date Change: -4.5% | |
| PNC Links: Profile News Message Board | |
| Charts:- Daily , Weekly | |
| Add PNC to Watchlist: View: Get PNC Trend Analysis ➞ | |
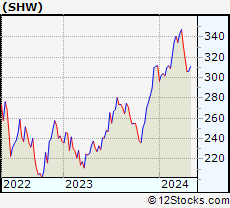 | SHW The Sherwin-Williams Company |
| Sector: Materials | |
| SubSector: Specialty Chemicals | |
| MarketCap: 40832.5 Millions | |
| Recent Price: 309.38 Smart Investing & Trading Score: 43 | |
| Day Percent Change: -0.25% Day Change: -0.78 | |
| Week Change: -2.79% Year-to-date Change: -0.8% | |
| SHW Links: Profile News Message Board | |
| Charts:- Daily , Weekly | |
| Add SHW to Watchlist: View: Get SHW Trend Analysis ➞ | |
| For tabular summary view of above stock list: Summary View ➞ 0 - 25 , 25 - 50 , 50 - 75 , 75 - 100 , 100 - 125 , 125 - 150 , 150 - 175 , 175 - 200 , 200 - 225 , 225 - 250 , 250 - 275 , 275 - 300 , 300 - 325 , 325 - 350 , 350 - 375 , 375 - 400 , 400 - 425 , 425 - 450 , 450 - 475 , 475 - 500 | ||
| Click To Change The Sort Order: By Market Cap or Company Size Performance: Year-to-date, Week and Day | |
| Select Chart Type: | ||
|
Best Stocks Today 12Stocks.com |
© 2024 12Stocks.com Terms & Conditions Privacy Contact Us
All Information Provided Only For Education And Not To Be Used For Investing or Trading. See Terms & Conditions


One More Thing ... Get Best Stocks Delivered Daily!
Never Ever Miss A Move With Our Top Ten Stocks Lists
Find Best Stocks In Any Market - Bull or Bear Market
Take A Peek At Our Top Ten Stocks Lists: Daily, Weekly, Year-to-Date & Top Trends
Find Best Stocks In Any Market - Bull or Bear Market
Take A Peek At Our Top Ten Stocks Lists: Daily, Weekly, Year-to-Date & Top Trends
S&P 500 Stocks With Best Up Trends [0-bearish to 100-bullish]: Genuine Parts[100], United Airlines[100], Generac Holdings[93], Bunge [93], Charles Schwab[93], Conagra Brands[93], Wells Fargo[90], PepsiCo [85], Lockheed Martin[85], Constellation [83], Progressive [83]
Best S&P 500 Stocks Year-to-Date:
NVIDIA [70.98%], Constellation [59.78%], Meta Platforms[41.76%], NRG [36.4%], Progressive [31.69%], Marathon [31.45%], Micron [31.16%], Western Digital[30.46%], Diamondback [28.71%], Targa Resources[28.68%], Eaton [28.29%] Best S&P 500 Stocks This Week:
United Airlines[23.01%], UnitedHealth [12.29%], Genuine Parts[10.21%], Globe Life[10%], ProShares UltraPro[7.09%], American Airlines[6.62%], Southwest Airlines[5.52%], Morgan Stanley[4.72%], V.F [4.62%], General Mills[4.37%], Estee Lauder[4.33%] Best S&P 500 Stocks Daily:
Genuine Parts[11.22%], United Airlines[5.50%], Estee Lauder[4.90%], Allstate [3.80%], Discover Financial[3.65%], Capital One[3.55%], V.F [3.43%], UnitedHealth [2.96%], Synchrony Financial[2.82%], Globe Life[2.80%], Wells Fargo[2.73%]