
 Login Sign Up


| |||||
 |  | ||||

| 12Stocks.com Market Intelligence |
Best S&P 500 Stocks
|
On this page, you will find the most comprehensive analysis of S&P 500 stocks and ETFs - from latest trends to performances to charts ➞. First, here are the year-to-date (YTD) performances of the most requested S&P 500 stocks at 12Stocks.com (click stock for review):
| NVIDIA 61% | ||
| Caterpillar 23% | ||
| Merck 16% | ||
| Amazon.com 16% | ||
| Walmart 14% | ||
| Google 14% | ||
| JPMorgan Chase 14% | ||
| Chevron 10% | ||
| Goldman Sachs 10% | ||
| Microsoft 9% | ||
| Johnson & Johnson -5% | ||
| McDonald s -7% | ||
| Starbucks -8% | ||
| Apple -12% | ||
| Gilead -17% | ||
| Intel -31% | ||
| Boeing -37% | ||
| Quick: S&P 500 Stocks Lists: Performances & Trends, S&P 500 Stock Charts
Sort S&P 500 stocks: Daily, Weekly, Year-to-Date, Market Cap & Trends. Filter S&P 500 stocks list by sector: Show all, Tech, Finance, Energy, Staples, Retail, Industrial, Materials, Utilities and HealthCare |
| 12Stocks.com S&P 500 Stocks Performances & Trends Daily Report | |||||||||
|
| 
The overall Smart Investing & Trading Score is 58 (0-bearish to 100-bullish) which puts S&P 500 index in short term neutral trend. The Smart Investing & Trading Score from previous trading session is 51 and an improvement of trend continues. | ||||||||
Here are the Smart Investing & Trading Scores of the most requested S&P 500 stocks at 12Stocks.com (click stock name for detailed review):
|


| 12Stocks.com: Top Performing S&P 500 Index Stocks | ||||||||||||||||||||||||||||||||||||||||||||||||
 The top performing S&P 500 Index stocks year to date are
Now, more recently, over last week, the top performing S&P 500 Index stocks on the move are


|
||||||||||||||||||||||||||||||||||||||||||||||||
| 12Stocks.com: Investing in S&P 500 Index with Stocks | |
|
The following table helps investors and traders sort through current performance and trends (as measured by Smart Investing & Trading Score) of various
stocks in the S&P 500 Index. Quick View: Move mouse or cursor over stock symbol (ticker) to view short-term technical chart and over stock name to view long term chart. Click on  to add stock symbol to your watchlist and to add stock symbol to your watchlist and  to view watchlist. Click on any ticker or stock name for detailed market intelligence report for that stock. to view watchlist. Click on any ticker or stock name for detailed market intelligence report for that stock. |
12Stocks.com Performance of Stocks in S&P 500 Index
| Ticker | Stock Name | Watchlist | Category | Recent Price | Smart Investing & Trading Score | Change % | YTD Change% |
| NI | NiSource |   | Utilities | 28.18 | 100 | 0.90% | 6.14% |
| NTAP | NetApp | | Technology | 100.06 | 63 | 0.64% | 13.50% |
| FDS | FactSet Research | | Technology | 422.83 | 0 | 0.69% | -11.37% |
| IR | Ingersoll Rand | | Industrials | 92.50 | 63 | 2.13% | 19.60% |
| PKG | Packaging | | Consumer Staples | 173.92 | 43 | 1.78% | 6.76% |
| DVA | DaVita | | Health Care | 132.74 | 76 | -0.87% | 26.71% |
| RF | Regions Financial | | Financials | 19.77 | 75 | 2.17% | 2.01% |
| CBOE | Cboe Global | | Financials | 179.68 | 42 | 0.48% | 0.63% |
| MAS | Masco | | Industrials | 69.74 | 26 | -4.48% | 4.12% |
| TAP | Molson Coors | | Consumer Staples | 63.70 | 36 | -0.75% | 4.07% |
| GPC | Genuine Parts | | Services & Goods | 161.80 | 88 | -0.97% | 16.82% |
| CE | Celanese | | Materials | 155.43 | 51 | -0.40% | 0.04% |
| ALLE | Allegion | | Services & Goods | 126.54 | 58 | -0.34% | -0.12% |
| HBAN | Huntington Bancshares | | Financials | 13.76 | 100 | 0.95% | 8.18% |
| LYV | Live Nation | | Services & Goods | 89.65 | 51 | -0.49% | -4.22% |
| HST | Host Hotels | | Financials | 19.33 | 45 | 0.21% | -0.72% |
| PNW | Pinnacle West | | Utilities | 74.54 | 86 | 0.05% | 3.76% |
| WAB | Wabtec | | Transports | 163.38 | 100 | 10.04% | 28.75% |
| CFG | Citizens Financial | | Financials | 35.52 | 100 | 1.57% | 7.18% |
| PFG | Principal Financial | | Financials | 82.16 | 75 | 0.80% | 4.44% |
| TER | Teradyne | | Technology | 100.70 | 58 | 0.85% | -7.21% |
| KMX | CarMax | | Services & Goods | 70.27 | 32 | 0.83% | -8.43% |
| UAL | United Airlines | | Transports | 52.67 | 83 | -2.52% | 27.65% |
| EXPE | Expedia | | Services & Goods | 135.80 | 64 | 0.58% | -10.53% |
| AVY | Avery Dennison | | Consumer Staples | 212.42 | 63 | 0.52% | 5.08% |
| For chart view version of above stock list: Chart View ➞ 0 - 25 , 25 - 50 , 50 - 75 , 75 - 100 , 100 - 125 , 125 - 150 , 150 - 175 , 175 - 200 , 200 - 225 , 225 - 250 , 250 - 275 , 275 - 300 , 300 - 325 , 325 - 350 , 350 - 375 , 375 - 400 , 400 - 425 , 425 - 450 , 450 - 475 , 475 - 500 | ||
 | Click To Change The Sort Order: By Market Cap or Company Size Performance: Year-to-date, Week and Day |  |
|
Get the most comprehensive stock market coverage daily at 12Stocks.com ➞ Best Stocks Today ➞ Best Stocks Weekly ➞ Best Stocks Year-to-Date ➞ Best Stocks Trends ➞  Best Stocks Today 12Stocks.com Best Nasdaq Stocks ➞ Best S&P 500 Stocks ➞ Best Tech Stocks ➞ Best Biotech Stocks ➞ |
| Detailed Overview of S&P 500 Stocks |
| S&P 500 Technical Overview, Leaders & Laggards, Top S&P 500 ETF Funds & Detailed S&P 500 Stocks List, Charts, Trends & More |
| S&P 500: Technical Analysis, Trends & YTD Performance | |
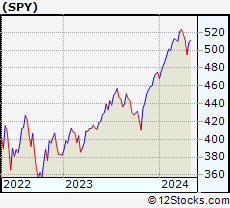
| S&P 500 index as represented by
SPY, an exchange-traded fund [ETF], holds basket of five hundred (mostly largecap) stocks from across all major sectors of the US stock market. The S&P 500 index (contains stocks like Apple and Exxon) is up by 6.33% and is currently outperforming the overall market by 0.67% year-to-date. Below is a quick view of technical charts and trends: | |
 SPY Weekly Chart |
|
| Long Term Trend: Good | |
| Medium Term Trend: Not Good | |
 SPY Daily Chart |
|
| Short Term Trend: Very Good | |
| Overall Trend Score: 58 | |
| YTD Performance: 6.33% | |
| **Trend Scores & Views Are Only For Educational Purposes And Not For Investing | |
| 12Stocks.com: Investing in S&P 500 Index using Exchange Traded Funds | |
|
The following table shows list of key exchange traded funds (ETF) that
help investors track S&P 500 index. The following list also includes leveraged ETF funds that track twice or thrice the daily returns of S&P 500 indices. Short or inverse ETF funds move in the opposite direction to the index they track and are useful during market pullbacks or during bear markets. Quick View: Move mouse or cursor over ETF symbol (ticker) to view short-term technical chart and over ETF name to view long term chart. Click on ticker or stock name for detailed view. Click on to add stock symbol to your watchlist and to view watchlist. |
12Stocks.com List of ETFs that track S&P 500 Index
| Ticker | ETF Name | Watchlist | Recent Price | Smart Investing & Trading Score | Change % | Week % | Year-to-date % |
| SPY | SPDR S&P 500 ETF | | 505.41 | 58 | -0.05 | 2.07 | 6.33% |
| IVV | iShares Core S&P 500 ETF | | 507.97 | 63 | -0.04 | 2.1 | 6.35% |
| VOO | Vanguard 500 ETF | | 464.50 | 63 | -0.07 | 2.07 | 6.34% |
| OEF | iShares S&P 100 | | 239.79 | 58 | -0.07 | 2.18 | 7.34% |
| SSO | ProShares Ultra S&P500 | | 71.95 | 58 | -0.12 | 4.11 | 10.57% |
| UPRO | ProShares UltraPro S&P500 | | 62.88 | 58 | -0.08 | 6.29 | 14.87% |
| SPXL | Direxion Daily S&P500 Bull 3X ETF | | 119.35 | 63 | -0.13 | 6.04 | 14.77% |
| SH | ProShares Short S&P500 | | 12.33 | 42 | -0.08 | -2.07 | -5.08% |
| SDS | ProShares UltraShort S&P500 | | 26.80 | 37 | 0.07 | -3.94 | -10.43% |
| SPXU | ProShares UltraPro Short S&P500 | | 36.04 | 42 | 0.14 | -5.97 | -16.19% |
| SPXS | Direxion Daily S&P 500 Bear 3X ETF | | 9.75 | 32 | 0.00 | -5.89 | -15.58% |
| 12Stocks.com: Charts, Trends, Fundamental Data and Performances of S&P 500 Stocks | |
|
We now take in-depth look at all S&P 500 stocks including charts, multi-period performances and overall trends (as measured by Smart Investing & Trading Score). One can sort S&P 500 stocks (click link to choose) by Daily, Weekly and by Year-to-Date performances. Also, one can sort by size of the company or by market capitalization. |
| Select Your Default Chart Type: | |||||
| |||||
| Click on stock symbol or name for detailed view. Click on to add stock symbol to your watchlist and to view watchlist. Quick View: Move mouse or cursor over "Daily" to quickly view daily technical stock chart and over "Weekly" to view weekly technical stock chart. | |||||

 | NI NiSource Inc. |
| Sector: Utilities | |
| SubSector: Diversified Utilities | |
| MarketCap: 9056.8 Millions | |
| Recent Price: 28.18 Smart Investing & Trading Score: 100 | |
| Day Percent Change: 0.90% Day Change: 0.25 | |
| Week Change: 2.18% Year-to-date Change: 6.1% | |
| NI Links: Profile News Message Board | |
| Charts:- Daily , Weekly | |
| Add NI to Watchlist: View: Get NI Trend Analysis ➞ | |
 | NTAP NetApp, Inc. |
| Sector: Technology | |
| SubSector: Data Storage Devices | |
| MarketCap: 9028.89 Millions | |
| Recent Price: 100.06 Smart Investing & Trading Score: 63 | |
| Day Percent Change: 0.64% Day Change: 0.64 | |
| Week Change: 2.15% Year-to-date Change: 13.5% | |
| NTAP Links: Profile News Message Board | |
| Charts:- Daily , Weekly | |
| Add NTAP to Watchlist: View: Get NTAP Trend Analysis ➞ | |
 | FDS FactSet Research Systems Inc. |
| Sector: Technology | |
| SubSector: Information & Delivery Services | |
| MarketCap: 9024.37 Millions | |
| Recent Price: 422.83 Smart Investing & Trading Score: 0 | |
| Day Percent Change: 0.69% Day Change: 2.89 | |
| Week Change: -2.58% Year-to-date Change: -11.4% | |
| FDS Links: Profile News Message Board | |
| Charts:- Daily , Weekly | |
| Add FDS to Watchlist: View: Get FDS Trend Analysis ➞ | |
 | IR Ingersoll Rand Inc. |
| Sector: Industrials | |
| SubSector: Diversified Machinery | |
| MarketCap: 8970.56 Millions | |
| Recent Price: 92.50 Smart Investing & Trading Score: 63 | |
| Day Percent Change: 2.13% Day Change: 1.93 | |
| Week Change: 4.64% Year-to-date Change: 19.6% | |
| IR Links: Profile News Message Board | |
| Charts:- Daily , Weekly | |
| Add IR to Watchlist: View: Get IR Trend Analysis ➞ | |
 | PKG Packaging Corporation of America |
| Sector: Consumer Staples | |
| SubSector: Packaging & Containers | |
| MarketCap: 8963 Millions | |
| Recent Price: 173.92 Smart Investing & Trading Score: 43 | |
| Day Percent Change: 1.78% Day Change: 3.04 | |
| Week Change: -3.32% Year-to-date Change: 6.8% | |
| PKG Links: Profile News Message Board | |
| Charts:- Daily , Weekly | |
| Add PKG to Watchlist: View: Get PKG Trend Analysis ➞ | |
 | DVA DaVita Inc. |
| Sector: Health Care | |
| SubSector: Specialized Health Services | |
| MarketCap: 8954.36 Millions | |
| Recent Price: 132.74 Smart Investing & Trading Score: 76 | |
| Day Percent Change: -0.87% Day Change: -1.17 | |
| Week Change: 3.85% Year-to-date Change: 26.7% | |
| DVA Links: Profile News Message Board | |
| Charts:- Daily , Weekly | |
| Add DVA to Watchlist: View: Get DVA Trend Analysis ➞ | |
 | RF Regions Financial Corporation |
| Sector: Financials | |
| SubSector: Regional - Southeast Banks | |
| MarketCap: 8936.25 Millions | |
| Recent Price: 19.77 Smart Investing & Trading Score: 75 | |
| Day Percent Change: 2.17% Day Change: 0.42 | |
| Week Change: 4.6% Year-to-date Change: 2.0% | |
| RF Links: Profile News Message Board | |
| Charts:- Daily , Weekly | |
| Add RF to Watchlist: View: Get RF Trend Analysis ➞ | |
 | CBOE Cboe Global Markets, Inc. |
| Sector: Financials | |
| SubSector: Diversified Investments | |
| MarketCap: 8834.5 Millions | |
| Recent Price: 179.68 Smart Investing & Trading Score: 42 | |
| Day Percent Change: 0.48% Day Change: 0.86 | |
| Week Change: -0.65% Year-to-date Change: 0.6% | |
| CBOE Links: Profile News Message Board | |
| Charts:- Daily , Weekly | |
| Add CBOE to Watchlist: View: Get CBOE Trend Analysis ➞ | |
 | MAS Masco Corporation |
| Sector: Industrials | |
| SubSector: General Building Materials | |
| MarketCap: 8655.63 Millions | |
| Recent Price: 69.74 Smart Investing & Trading Score: 26 | |
| Day Percent Change: -4.48% Day Change: -3.27 | |
| Week Change: -3.02% Year-to-date Change: 4.1% | |
| MAS Links: Profile News Message Board | |
| Charts:- Daily , Weekly | |
| Add MAS to Watchlist: View: Get MAS Trend Analysis ➞ | |
 | TAP Molson Coors Beverage Company |
| Sector: Consumer Staples | |
| SubSector: Beverages - Brewers | |
| MarketCap: 8619.97 Millions | |
| Recent Price: 63.70 Smart Investing & Trading Score: 36 | |
| Day Percent Change: -0.75% Day Change: -0.48 | |
| Week Change: -0.83% Year-to-date Change: 4.1% | |
| TAP Links: Profile News Message Board | |
| Charts:- Daily , Weekly | |
| Add TAP to Watchlist: View: Get TAP Trend Analysis ➞ | |
 | GPC Genuine Parts Company |
| Sector: Services & Goods | |
| SubSector: Auto Parts Stores | |
| MarketCap: 8605.9 Millions | |
| Recent Price: 161.80 Smart Investing & Trading Score: 88 | |
| Day Percent Change: -0.97% Day Change: -1.58 | |
| Week Change: -0.36% Year-to-date Change: 16.8% | |
| GPC Links: Profile News Message Board | |
| Charts:- Daily , Weekly | |
| Add GPC to Watchlist: View: Get GPC Trend Analysis ➞ | |
 | CE Celanese Corporation |
| Sector: Materials | |
| SubSector: Chemicals - Major Diversified | |
| MarketCap: 8521.06 Millions | |
| Recent Price: 155.43 Smart Investing & Trading Score: 51 | |
| Day Percent Change: -0.40% Day Change: -0.62 | |
| Week Change: 0.63% Year-to-date Change: 0.0% | |
| CE Links: Profile News Message Board | |
| Charts:- Daily , Weekly | |
| Add CE to Watchlist: View: Get CE Trend Analysis ➞ | |
 | ALLE Allegion plc |
| Sector: Services & Goods | |
| SubSector: Security & Protection Services | |
| MarketCap: 8515.93 Millions | |
| Recent Price: 126.54 Smart Investing & Trading Score: 58 | |
| Day Percent Change: -0.34% Day Change: -0.43 | |
| Week Change: 1.06% Year-to-date Change: -0.1% | |
| ALLE Links: Profile News Message Board | |
| Charts:- Daily , Weekly | |
| Add ALLE to Watchlist: View: Get ALLE Trend Analysis ➞ | |
 | HBAN Huntington Bancshares Incorporated |
| Sector: Financials | |
| SubSector: Regional - Midwest Banks | |
| MarketCap: 8468.1 Millions | |
| Recent Price: 13.76 Smart Investing & Trading Score: 100 | |
| Day Percent Change: 0.95% Day Change: 0.13 | |
| Week Change: 3.61% Year-to-date Change: 8.2% | |
| HBAN Links: Profile News Message Board | |
| Charts:- Daily , Weekly | |
| Add HBAN to Watchlist: View: Get HBAN Trend Analysis ➞ | |
 | LYV Live Nation Entertainment, Inc. |
| Sector: Services & Goods | |
| SubSector: Entertainment - Diversified | |
| MarketCap: 8457.17 Millions | |
| Recent Price: 89.65 Smart Investing & Trading Score: 51 | |
| Day Percent Change: -0.49% Day Change: -0.44 | |
| Week Change: -0.34% Year-to-date Change: -4.2% | |
| LYV Links: Profile News Message Board | |
| Charts:- Daily , Weekly | |
| Add LYV to Watchlist: View: Get LYV Trend Analysis ➞ | |
 | HST Host Hotels & Resorts, Inc. |
| Sector: Financials | |
| SubSector: REIT - Hotel/Motel | |
| MarketCap: 8253.74 Millions | |
| Recent Price: 19.33 Smart Investing & Trading Score: 45 | |
| Day Percent Change: 0.21% Day Change: 0.04 | |
| Week Change: 3.31% Year-to-date Change: -0.7% | |
| HST Links: Profile News Message Board | |
| Charts:- Daily , Weekly | |
| Add HST to Watchlist: View: Get HST Trend Analysis ➞ | |
 | PNW Pinnacle West Capital Corporation |
| Sector: Utilities | |
| SubSector: Electric Utilities | |
| MarketCap: 8240.24 Millions | |
| Recent Price: 74.54 Smart Investing & Trading Score: 86 | |
| Day Percent Change: 0.05% Day Change: 0.04 | |
| Week Change: 0.19% Year-to-date Change: 3.8% | |
| PNW Links: Profile News Message Board | |
| Charts:- Daily , Weekly | |
| Add PNW to Watchlist: View: Get PNW Trend Analysis ➞ | |
 | WAB Wabtec Corporation |
| Sector: Transports | |
| SubSector: Railroads | |
| MarketCap: 8230.22 Millions | |
| Recent Price: 163.38 Smart Investing & Trading Score: 100 | |
| Day Percent Change: 10.04% Day Change: 14.90 | |
| Week Change: 13.32% Year-to-date Change: 28.8% | |
| WAB Links: Profile News Message Board | |
| Charts:- Daily , Weekly | |
| Add WAB to Watchlist: View: Get WAB Trend Analysis ➞ | |
 | CFG Citizens Financial Group, Inc. |
| Sector: Financials | |
| SubSector: Regional - Mid-Atlantic Banks | |
| MarketCap: 8225.19 Millions | |
| Recent Price: 35.52 Smart Investing & Trading Score: 100 | |
| Day Percent Change: 1.57% Day Change: 0.55 | |
| Week Change: 4.5% Year-to-date Change: 7.2% | |
| CFG Links: Profile News Message Board | |
| Charts:- Daily , Weekly | |
| Add CFG to Watchlist: View: Get CFG Trend Analysis ➞ | |
 | PFG Principal Financial Group, Inc. |
| Sector: Financials | |
| SubSector: Life Insurance | |
| MarketCap: 8178.86 Millions | |
| Recent Price: 82.16 Smart Investing & Trading Score: 75 | |
| Day Percent Change: 0.80% Day Change: 0.65 | |
| Week Change: 2.14% Year-to-date Change: 4.4% | |
| PFG Links: Profile News Message Board | |
| Charts:- Daily , Weekly | |
| Add PFG to Watchlist: View: Get PFG Trend Analysis ➞ | |
 | TER Teradyne, Inc. |
| Sector: Technology | |
| SubSector: Semiconductor Equipment & Materials | |
| MarketCap: 8135.68 Millions | |
| Recent Price: 100.70 Smart Investing & Trading Score: 58 | |
| Day Percent Change: 0.85% Day Change: 0.85 | |
| Week Change: 4.93% Year-to-date Change: -7.2% | |
| TER Links: Profile News Message Board | |
| Charts:- Daily , Weekly | |
| Add TER to Watchlist: View: Get TER Trend Analysis ➞ | |
 | KMX CarMax, Inc. |
| Sector: Services & Goods | |
| SubSector: Auto Dealerships | |
| MarketCap: 8121.71 Millions | |
| Recent Price: 70.27 Smart Investing & Trading Score: 32 | |
| Day Percent Change: 0.83% Day Change: 0.58 | |
| Week Change: 2.82% Year-to-date Change: -8.4% | |
| KMX Links: Profile News Message Board | |
| Charts:- Daily , Weekly | |
| Add KMX to Watchlist: View: Get KMX Trend Analysis ➞ | |
 | UAL United Airlines Holdings, Inc. |
| Sector: Transports | |
| SubSector: Major Airlines | |
| MarketCap: 8083.25 Millions | |
| Recent Price: 52.67 Smart Investing & Trading Score: 83 | |
| Day Percent Change: -2.52% Day Change: -1.36 | |
| Week Change: 2.51% Year-to-date Change: 27.7% | |
| UAL Links: Profile News Message Board | |
| Charts:- Daily , Weekly | |
| Add UAL to Watchlist: View: Get UAL Trend Analysis ➞ | |
 | EXPE Expedia Group, Inc. |
| Sector: Services & Goods | |
| SubSector: Lodging | |
| MarketCap: 8052.96 Millions | |
| Recent Price: 135.80 Smart Investing & Trading Score: 64 | |
| Day Percent Change: 0.58% Day Change: 0.78 | |
| Week Change: 5.27% Year-to-date Change: -10.5% | |
| EXPE Links: Profile News Message Board | |
| Charts:- Daily , Weekly | |
| Add EXPE to Watchlist: View: Get EXPE Trend Analysis ➞ | |
 | AVY Avery Dennison Corporation |
| Sector: Consumer Staples | |
| SubSector: Business Equipment | |
| MarketCap: 8051.27 Millions | |
| Recent Price: 212.42 Smart Investing & Trading Score: 63 | |
| Day Percent Change: 0.52% Day Change: 1.09 | |
| Week Change: 0.4% Year-to-date Change: 5.1% | |
| AVY Links: Profile News Message Board | |
| Charts:- Daily , Weekly | |
| Add AVY to Watchlist: View: Get AVY Trend Analysis ➞ | |
| For tabular summary view of above stock list: Summary View ➞ 0 - 25 , 25 - 50 , 50 - 75 , 75 - 100 , 100 - 125 , 125 - 150 , 150 - 175 , 175 - 200 , 200 - 225 , 225 - 250 , 250 - 275 , 275 - 300 , 300 - 325 , 325 - 350 , 350 - 375 , 375 - 400 , 400 - 425 , 425 - 450 , 450 - 475 , 475 - 500 | ||
| Click To Change The Sort Order: By Market Cap or Company Size Performance: Year-to-date, Week and Day | |
| Select Chart Type: | ||
|
Best Stocks Today 12Stocks.com |
© 2024 12Stocks.com Terms & Conditions Privacy Contact Us
All Information Provided Only For Education And Not To Be Used For Investing or Trading. See Terms & Conditions


One More Thing ... Get Best Stocks Delivered Daily!
Never Ever Miss A Move With Our Top Ten Stocks Lists
Find Best Stocks In Any Market - Bull or Bear Market
Take A Peek At Our Top Ten Stocks Lists: Daily, Weekly, Year-to-Date & Top Trends
Find Best Stocks In Any Market - Bull or Bear Market
Take A Peek At Our Top Ten Stocks Lists: Daily, Weekly, Year-to-Date & Top Trends
S&P 500 Stocks With Best Up Trends [0-bearish to 100-bullish]: Hasbro [100], Wabtec [100], Boston Scientific[100], Texas Instruments[100], Microchip [100], Synchrony Financial[100], EQT [100], PepsiCo [100], Analog Devices[100], Equity Residential[100], Essex Property[100]
Best S&P 500 Stocks Year-to-Date:
NVIDIA [60.89%], Constellation [59.4%], NRG [40.44%], Meta Platforms[39.4%], Targa Resources[34.57%], Marathon [34.23%], Progressive [33.22%], Western Digital[32.81%], Eaton [32.38%], Diamondback [32.34%], Micron [30.98%] Best S&P 500 Stocks This Week:
Globe Life[17.77%], Hasbro [17.66%], Wabtec [13.32%], Microchip [11.02%], Tesla [10.26%], Texas Instruments[9.48%], NXP Semiconductors[9.26%], CoStar [9.13%], Kimberly-Clark [8.63%], Monolithic Power[8.57%], Synchrony Financial[8.3%] Best S&P 500 Stocks Daily:
Tesla [12.06%], Hasbro [11.85%], Wabtec [10.04%], CoStar [8.66%], ON Semiconductor[6.24%], Boston Scientific[5.68%], Texas Instruments[5.64%], Microchip [5.21%], Monolithic Power[5.04%], Synchrony Financial[5.04%], Biogen [4.56%]