
 Login Sign Up


| |||||
 |  | ||||

| 12Stocks.com Market Intelligence |
Best S&P 500 Stocks
|
On this page, you will find the most comprehensive analysis of S&P 500 stocks and ETFs - from latest trends to performances to charts ➞. First, here are the year-to-date (YTD) performances of the most requested S&P 500 stocks at 12Stocks.com (click stock for review):
| NVIDIA 71% | ||
| Caterpillar 21% | ||
| Amazon.com 18% | ||
| Merck 15% | ||
| Walmart 13% | ||
| Google 12% | ||
| Microsoft 8% | ||
| JPMorgan Chase 7% | ||
| Chevron 6% | ||
| Goldman Sachs 4% | ||
| Johnson & Johnson -7% | ||
| McDonald s -9% | ||
| Starbucks -9% | ||
| Apple -13% | ||
| Gilead -18% | ||
| Intel -30% | ||
| Boeing -35% | ||
| Quick: S&P 500 Stocks Lists: Performances & Trends, S&P 500 Stock Charts
Sort S&P 500 stocks: Daily, Weekly, Year-to-Date, Market Cap & Trends. Filter S&P 500 stocks list by sector: Show all, Tech, Finance, Energy, Staples, Retail, Industrial, Materials, Utilities and HealthCare |
| 12Stocks.com S&P 500 Stocks Performances & Trends Daily Report | |||||||||
|
| 
The overall Smart Investing & Trading Score is 36 (0-bearish to 100-bullish) which puts S&P 500 index in short term bearish to neutral trend. The Smart Investing & Trading Score from previous trading session is 26 and hence an improvement of trend. | ||||||||
Here are the Smart Investing & Trading Scores of the most requested S&P 500 stocks at 12Stocks.com (click stock name for detailed review):
|


| 12Stocks.com: Top Performing S&P 500 Index Stocks | ||||||||||||||||||||||||||||||||||||||||||||||||
 The top performing S&P 500 Index stocks year to date are
Now, more recently, over last week, the top performing S&P 500 Index stocks on the move are


|
||||||||||||||||||||||||||||||||||||||||||||||||
| 12Stocks.com: Investing in S&P 500 Index with Stocks | |
|
The following table helps investors and traders sort through current performance and trends (as measured by Smart Investing & Trading Score) of various
stocks in the S&P 500 Index. Quick View: Move mouse or cursor over stock symbol (ticker) to view short-term technical chart and over stock name to view long term chart. Click on  to add stock symbol to your watchlist and to add stock symbol to your watchlist and  to view watchlist. Click on any ticker or stock name for detailed market intelligence report for that stock. to view watchlist. Click on any ticker or stock name for detailed market intelligence report for that stock. |
12Stocks.com Performance of Stocks in S&P 500 Index
| Ticker | Stock Name | Watchlist | Category | Recent Price | Smart Investing & Trading Score | Change % | YTD Change% |
| NXPI | NXP Semiconductors |   | Technology | 219.35 | 26 | -3.34% | -4.50% |
| ORLY | O Reilly | | Services & Goods | 1101.06 | 58 | 0.57% | 15.89% |
| A | Agilent Technologies | | Health Care | 132.44 | 26 | -1.57% | -4.74% |
| TSN | Tyson Foods | | Consumer Staples | 58.87 | 76 | 0.50% | 9.53% |
| HPQ | HP | | Technology | 27.62 | 10 | -0.25% | -8.21% |
| EQR | Equity Residential | | Financials | 60.99 | 61 | 0.96% | -0.28% |
| VRSK | Verisk Analytics | | Services & Goods | 223.33 | 25 | 0.49% | -6.50% |
| JCI | Johnson Controls | | Consumer Staples | 63.77 | 43 | 0.13% | 10.63% |
| CSGP | CoStar | | Financials | 84.18 | 36 | -1.50% | -3.67% |
| WELL | Welltower | | Financials | 90.81 | 56 | 1.24% | 0.71% |
| DLTR | Dollar Tree | | Services & Goods | 122.23 | 0 | -1.23% | -13.95% |
| AIG | American | | Financials | 72.99 | 51 | 0.56% | 7.73% |
| MSCI | MSCI | | Technology | 505.76 | 0 | -1.19% | -10.59% |
| PRU | Prudential Financial | | Financials | 108.70 | 51 | 1.26% | 4.81% |
| PAYX | Paychex | | Services & Goods | 117.79 | 0 | -1.13% | -1.11% |
| PEG | Public Service | | Utilities | 65.10 | 61 | 0.11% | 6.46% |
| FE | First | | Utilities | 37.63 | 61 | 0.48% | 2.65% |
| KLAC | KLA | | Technology | 644.22 | 26 | -2.24% | 10.82% |
| PPG | PPG Industries | | Materials | 135.11 | 25 | 0.11% | -9.66% |
| K | Kellogg | | Consumer Staples | 56.54 | 73 | 0.84% | 1.13% |
| CTAS | Cintas | | Services & Goods | 662.44 | 34 | -0.91% | 9.92% |
| TEL | TE Connectivity | | Technology | 140.48 | 0 | -0.71% | -0.01% |
| AWK | American Water | | Utilities | 117.35 | 52 | 1.69% | -11.09% |
| AVB | AvalonBay Communities | | Financials | 182.02 | 61 | 0.59% | -2.78% |
| VRSN | VeriSign | | Technology | 182.96 | 25 | 0.77% | -11.17% |
| For chart view version of above stock list: Chart View ➞ 0 - 25 , 25 - 50 , 50 - 75 , 75 - 100 , 100 - 125 , 125 - 150 , 150 - 175 , 175 - 200 , 200 - 225 , 225 - 250 , 250 - 275 , 275 - 300 , 300 - 325 , 325 - 350 , 350 - 375 , 375 - 400 , 400 - 425 , 425 - 450 , 450 - 475 , 475 - 500 | ||
 | Click To Change The Sort Order: By Market Cap or Company Size Performance: Year-to-date, Week and Day |  |
|
Get the most comprehensive stock market coverage daily at 12Stocks.com ➞ Best Stocks Today ➞ Best Stocks Weekly ➞ Best Stocks Year-to-Date ➞ Best Stocks Trends ➞  Best Stocks Today 12Stocks.com Best Nasdaq Stocks ➞ Best S&P 500 Stocks ➞ Best Tech Stocks ➞ Best Biotech Stocks ➞ |
| Detailed Overview of S&P 500 Stocks |
| S&P 500 Technical Overview, Leaders & Laggards, Top S&P 500 ETF Funds & Detailed S&P 500 Stocks List, Charts, Trends & More |
| S&P 500: Technical Analysis, Trends & YTD Performance | |
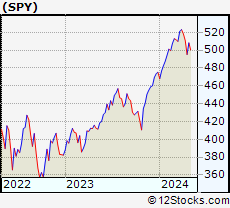
| S&P 500 index as represented by
SPY, an exchange-traded fund [ETF], holds basket of five hundred (mostly largecap) stocks from across all major sectors of the US stock market. The S&P 500 index (contains stocks like Apple and Exxon) is up by 5.09% and is currently outperforming the overall market by 0.9% year-to-date. Below is a quick view of technical charts and trends: | |
 SPY Weekly Chart |
|
| Long Term Trend: Good | |
| Medium Term Trend: Not Good | |
 SPY Daily Chart |
|
| Short Term Trend: Not Good | |
| Overall Trend Score: 36 | |
| YTD Performance: 5.09% | |
| **Trend Scores & Views Are Only For Educational Purposes And Not For Investing | |
| 12Stocks.com: Investing in S&P 500 Index using Exchange Traded Funds | |
|
The following table shows list of key exchange traded funds (ETF) that
help investors track S&P 500 index. The following list also includes leveraged ETF funds that track twice or thrice the daily returns of S&P 500 indices. Short or inverse ETF funds move in the opposite direction to the index they track and are useful during market pullbacks or during bear markets. Quick View: Move mouse or cursor over ETF symbol (ticker) to view short-term technical chart and over ETF name to view long term chart. Click on ticker or stock name for detailed view. Click on to add stock symbol to your watchlist and to view watchlist. |
12Stocks.com List of ETFs that track S&P 500 Index
| Ticker | ETF Name | Watchlist | Recent Price | Smart Investing & Trading Score | Change % | Week % | Year-to-date % |
| SPY | SPDR S&P 500 ETF | | 499.52 | 36 | -0.21 | -2.22 | 5.09% |
| IVV | iShares Core S&P 500 ETF | | 501.88 | 44 | -0.23 | -2.23 | 5.08% |
| VOO | Vanguard 500 ETF | | 458.94 | 44 | -0.23 | -2.26 | 5.07% |
| OEF | iShares S&P 100 | | 237.62 | 36 | -0.13 | -2.27 | 6.37% |
| SSO | ProShares Ultra S&P500 | | 70.33 | 36 | -0.47 | -4.52 | 8.08% |
| UPRO | ProShares UltraPro S&P500 | | 60.78 | 36 | -0.78 | -6.78 | 11.03% |
| SPXL | Direxion Daily S&P500 Bull 3X ETF | | 115.53 | 36 | -0.70 | -6.71 | 11.1% |
| SH | ProShares Short S&P500 | | 12.47 | 74 | 0.24 | 2.3 | -4% |
| SDS | ProShares UltraShort S&P500 | | 27.41 | 74 | 0.51 | 4.74 | -8.39% |
| SPXU | ProShares UltraPro Short S&P500 | | 37.33 | 69 | 0.70 | 7.09 | -13.19% |
| SPXS | Direxion Daily S&P 500 Bear 3X ETF | | 10.11 | 59 | 1.00 | 7.32 | -12.47% |
| 12Stocks.com: Charts, Trends, Fundamental Data and Performances of S&P 500 Stocks | |
|
We now take in-depth look at all S&P 500 stocks including charts, multi-period performances and overall trends (as measured by Smart Investing & Trading Score). One can sort S&P 500 stocks (click link to choose) by Daily, Weekly and by Year-to-Date performances. Also, one can sort by size of the company or by market capitalization. |
| Select Your Default Chart Type: | |||||
| |||||
| Click on stock symbol or name for detailed view. Click on to add stock symbol to your watchlist and to view watchlist. Quick View: Move mouse or cursor over "Daily" to quickly view daily technical stock chart and over "Weekly" to view weekly technical stock chart. | |||||

 | NXPI NXP Semiconductors N.V. |
| Sector: Technology | |
| SubSector: Semiconductor - Broad Line | |
| MarketCap: 22497.9 Millions | |
| Recent Price: 219.35 Smart Investing & Trading Score: 26 | |
| Day Percent Change: -3.34% Day Change: -7.57 | |
| Week Change: -6.1% Year-to-date Change: -4.5% | |
| NXPI Links: Profile News Message Board | |
| Charts:- Daily , Weekly | |
| Add NXPI to Watchlist: View: Get NXPI Trend Analysis ➞ | |
 | ORLY O Reilly Automotive, Inc. |
| Sector: Services & Goods | |
| SubSector: Auto Parts Stores | |
| MarketCap: 22391.5 Millions | |
| Recent Price: 1101.06 Smart Investing & Trading Score: 58 | |
| Day Percent Change: 0.57% Day Change: 6.26 | |
| Week Change: 2.28% Year-to-date Change: 15.9% | |
| ORLY Links: Profile News Message Board | |
| Charts:- Daily , Weekly | |
| Add ORLY to Watchlist: View: Get ORLY Trend Analysis ➞ | |
 | A Agilent Technologies, Inc. |
| Sector: Health Care | |
| SubSector: Medical Laboratories & Research | |
| MarketCap: 22337.9 Millions | |
| Recent Price: 132.44 Smart Investing & Trading Score: 26 | |
| Day Percent Change: -1.57% Day Change: -2.11 | |
| Week Change: -5.89% Year-to-date Change: -4.7% | |
| A Links: Profile News Message Board | |
| Charts:- Daily , Weekly | |
| Add A to Watchlist: View: Get A Trend Analysis ➞ | |
 | TSN Tyson Foods, Inc. |
| Sector: Consumer Staples | |
| SubSector: Meat Products | |
| MarketCap: 22124.1 Millions | |
| Recent Price: 58.87 Smart Investing & Trading Score: 76 | |
| Day Percent Change: 0.50% Day Change: 0.29 | |
| Week Change: 1.89% Year-to-date Change: 9.5% | |
| TSN Links: Profile News Message Board | |
| Charts:- Daily , Weekly | |
| Add TSN to Watchlist: View: Get TSN Trend Analysis ➞ | |
 | HPQ HP Inc. |
| Sector: Technology | |
| SubSector: Diversified Computer Systems | |
| MarketCap: 22107.8 Millions | |
| Recent Price: 27.62 Smart Investing & Trading Score: 10 | |
| Day Percent Change: -0.25% Day Change: -0.07 | |
| Week Change: -3.19% Year-to-date Change: -8.2% | |
| HPQ Links: Profile News Message Board | |
| Charts:- Daily , Weekly | |
| Add HPQ to Watchlist: View: Get HPQ Trend Analysis ➞ | |
 | EQR Equity Residential |
| Sector: Financials | |
| SubSector: REIT - Residential | |
| MarketCap: 22061.9 Millions | |
| Recent Price: 60.99 Smart Investing & Trading Score: 61 | |
| Day Percent Change: 0.96% Day Change: 0.58 | |
| Week Change: -1.13% Year-to-date Change: -0.3% | |
| EQR Links: Profile News Message Board | |
| Charts:- Daily , Weekly | |
| Add EQR to Watchlist: View: Get EQR Trend Analysis ➞ | |
 | VRSK Verisk Analytics, Inc. |
| Sector: Services & Goods | |
| SubSector: Business Services | |
| MarketCap: 22033.2 Millions | |
| Recent Price: 223.33 Smart Investing & Trading Score: 25 | |
| Day Percent Change: 0.49% Day Change: 1.08 | |
| Week Change: 0.36% Year-to-date Change: -6.5% | |
| VRSK Links: Profile News Message Board | |
| Charts:- Daily , Weekly | |
| Add VRSK to Watchlist: View: Get VRSK Trend Analysis ➞ | |
 | JCI Johnson Controls International plc |
| Sector: Consumer Staples | |
| SubSector: Auto Parts | |
| MarketCap: 21950.7 Millions | |
| Recent Price: 63.77 Smart Investing & Trading Score: 43 | |
| Day Percent Change: 0.13% Day Change: 0.08 | |
| Week Change: -2.33% Year-to-date Change: 10.6% | |
| JCI Links: Profile News Message Board | |
| Charts:- Daily , Weekly | |
| Add JCI to Watchlist: View: Get JCI Trend Analysis ➞ | |
 | CSGP CoStar Group, Inc. |
| Sector: Financials | |
| SubSector: Property Management | |
| MarketCap: 21454.4 Millions | |
| Recent Price: 84.18 Smart Investing & Trading Score: 36 | |
| Day Percent Change: -1.50% Day Change: -1.28 | |
| Week Change: -6.82% Year-to-date Change: -3.7% | |
| CSGP Links: Profile News Message Board | |
| Charts:- Daily , Weekly | |
| Add CSGP to Watchlist: View: Get CSGP Trend Analysis ➞ | |
 | WELL Welltower Inc. |
| Sector: Financials | |
| SubSector: REIT - Healthcare Facilities | |
| MarketCap: 21398.8 Millions | |
| Recent Price: 90.81 Smart Investing & Trading Score: 56 | |
| Day Percent Change: 1.24% Day Change: 1.11 | |
| Week Change: 1.14% Year-to-date Change: 0.7% | |
| WELL Links: Profile News Message Board | |
| Charts:- Daily , Weekly | |
| Add WELL to Watchlist: View: Get WELL Trend Analysis ➞ | |
 | DLTR Dollar Tree, Inc. |
| Sector: Services & Goods | |
| SubSector: Discount, Variety Stores | |
| MarketCap: 21383.2 Millions | |
| Recent Price: 122.23 Smart Investing & Trading Score: 0 | |
| Day Percent Change: -1.23% Day Change: -1.52 | |
| Week Change: -2.36% Year-to-date Change: -14.0% | |
| DLTR Links: Profile News Message Board | |
| Charts:- Daily , Weekly | |
| Add DLTR to Watchlist: View: Get DLTR Trend Analysis ➞ | |
 | AIG American International Group, Inc. |
| Sector: Financials | |
| SubSector: Property & Casualty Insurance | |
| MarketCap: 21219 Millions | |
| Recent Price: 72.99 Smart Investing & Trading Score: 51 | |
| Day Percent Change: 0.56% Day Change: 0.41 | |
| Week Change: -0.94% Year-to-date Change: 7.7% | |
| AIG Links: Profile News Message Board | |
| Charts:- Daily , Weekly | |
| Add AIG to Watchlist: View: Get AIG Trend Analysis ➞ | |
 | MSCI MSCI Inc. |
| Sector: Technology | |
| SubSector: Processing Systems & Products | |
| MarketCap: 21086.3 Millions | |
| Recent Price: 505.76 Smart Investing & Trading Score: 0 | |
| Day Percent Change: -1.19% Day Change: -6.07 | |
| Week Change: -3.96% Year-to-date Change: -10.6% | |
| MSCI Links: Profile News Message Board | |
| Charts:- Daily , Weekly | |
| Add MSCI to Watchlist: View: Get MSCI Trend Analysis ➞ | |
 | PRU Prudential Financial, Inc. |
| Sector: Financials | |
| SubSector: Life Insurance | |
| MarketCap: 21001.6 Millions | |
| Recent Price: 108.70 Smart Investing & Trading Score: 51 | |
| Day Percent Change: 1.26% Day Change: 1.35 | |
| Week Change: -0.9% Year-to-date Change: 4.8% | |
| PRU Links: Profile News Message Board | |
| Charts:- Daily , Weekly | |
| Add PRU to Watchlist: View: Get PRU Trend Analysis ➞ | |
 | PAYX Paychex, Inc. |
| Sector: Services & Goods | |
| SubSector: Staffing & Outsourcing Services | |
| MarketCap: 20928.8 Millions | |
| Recent Price: 117.79 Smart Investing & Trading Score: 0 | |
| Day Percent Change: -1.13% Day Change: -1.35 | |
| Week Change: -4.24% Year-to-date Change: -1.1% | |
| PAYX Links: Profile News Message Board | |
| Charts:- Daily , Weekly | |
| Add PAYX to Watchlist: View: Get PAYX Trend Analysis ➞ | |
 | PEG Public Service Enterprise Group Incorporated |
| Sector: Utilities | |
| SubSector: Diversified Utilities | |
| MarketCap: 20886 Millions | |
| Recent Price: 65.10 Smart Investing & Trading Score: 61 | |
| Day Percent Change: 0.11% Day Change: 0.07 | |
| Week Change: -1.17% Year-to-date Change: 6.5% | |
| PEG Links: Profile News Message Board | |
| Charts:- Daily , Weekly | |
| Add PEG to Watchlist: View: Get PEG Trend Analysis ➞ | |
 | FE FirstEnergy Corp. |
| Sector: Utilities | |
| SubSector: Electric Utilities | |
| MarketCap: 20754.1 Millions | |
| Recent Price: 37.63 Smart Investing & Trading Score: 61 | |
| Day Percent Change: 0.48% Day Change: 0.18 | |
| Week Change: 0.59% Year-to-date Change: 2.7% | |
| FE Links: Profile News Message Board | |
| Charts:- Daily , Weekly | |
| Add FE to Watchlist: View: Get FE Trend Analysis ➞ | |
 | KLAC KLA Corporation |
| Sector: Technology | |
| SubSector: Semiconductor Equipment & Materials | |
| MarketCap: 20663.8 Millions | |
| Recent Price: 644.22 Smart Investing & Trading Score: 26 | |
| Day Percent Change: -2.24% Day Change: -14.76 | |
| Week Change: -5.37% Year-to-date Change: 10.8% | |
| KLAC Links: Profile News Message Board | |
| Charts:- Daily , Weekly | |
| Add KLAC to Watchlist: View: Get KLAC Trend Analysis ➞ | |
 | PPG PPG Industries, Inc. |
| Sector: Materials | |
| SubSector: Specialty Chemicals | |
| MarketCap: 20285.5 Millions | |
| Recent Price: 135.11 Smart Investing & Trading Score: 25 | |
| Day Percent Change: 0.11% Day Change: 0.15 | |
| Week Change: 0.51% Year-to-date Change: -9.7% | |
| PPG Links: Profile News Message Board | |
| Charts:- Daily , Weekly | |
| Add PPG to Watchlist: View: Get PPG Trend Analysis ➞ | |
 | K Kellogg Company |
| Sector: Consumer Staples | |
| SubSector: Processed & Packaged Goods | |
| MarketCap: 20264.6 Millions | |
| Recent Price: 56.54 Smart Investing & Trading Score: 73 | |
| Day Percent Change: 0.84% Day Change: 0.47 | |
| Week Change: 2.02% Year-to-date Change: 1.1% | |
| K Links: Profile News Message Board | |
| Charts:- Daily , Weekly | |
| Add K to Watchlist: View: Get K Trend Analysis ➞ | |
 | CTAS Cintas Corporation |
| Sector: Services & Goods | |
| SubSector: Business Services | |
| MarketCap: 20154.6 Millions | |
| Recent Price: 662.44 Smart Investing & Trading Score: 34 | |
| Day Percent Change: -0.91% Day Change: -6.07 | |
| Week Change: -0.89% Year-to-date Change: 9.9% | |
| CTAS Links: Profile News Message Board | |
| Charts:- Daily , Weekly | |
| Add CTAS to Watchlist: View: Get CTAS Trend Analysis ➞ | |
 | TEL TE Connectivity Ltd. |
| Sector: Technology | |
| SubSector: Diversified Electronics | |
| MarketCap: 20044.9 Millions | |
| Recent Price: 140.48 Smart Investing & Trading Score: 0 | |
| Day Percent Change: -0.71% Day Change: -1.00 | |
| Week Change: -1.75% Year-to-date Change: 0.0% | |
| TEL Links: Profile News Message Board | |
| Charts:- Daily , Weekly | |
| Add TEL to Watchlist: View: Get TEL Trend Analysis ➞ | |
 | AWK American Water Works Company, Inc. |
| Sector: Utilities | |
| SubSector: Water Utilities | |
| MarketCap: 20029.2 Millions | |
| Recent Price: 117.35 Smart Investing & Trading Score: 52 | |
| Day Percent Change: 1.69% Day Change: 1.95 | |
| Week Change: 0.67% Year-to-date Change: -11.1% | |
| AWK Links: Profile News Message Board | |
| Charts:- Daily , Weekly | |
| Add AWK to Watchlist: View: Get AWK Trend Analysis ➞ | |
 | AVB AvalonBay Communities, Inc. |
| Sector: Financials | |
| SubSector: REIT - Residential | |
| MarketCap: 19921.9 Millions | |
| Recent Price: 182.02 Smart Investing & Trading Score: 61 | |
| Day Percent Change: 0.59% Day Change: 1.07 | |
| Week Change: -0.96% Year-to-date Change: -2.8% | |
| AVB Links: Profile News Message Board | |
| Charts:- Daily , Weekly | |
| Add AVB to Watchlist: View: Get AVB Trend Analysis ➞ | |
 | VRSN VeriSign, Inc. |
| Sector: Technology | |
| SubSector: Internet Information Providers | |
| MarketCap: 19657 Millions | |
| Recent Price: 182.96 Smart Investing & Trading Score: 25 | |
| Day Percent Change: 0.77% Day Change: 1.39 | |
| Week Change: -1.33% Year-to-date Change: -11.2% | |
| VRSN Links: Profile News Message Board | |
| Charts:- Daily , Weekly | |
| Add VRSN to Watchlist: View: Get VRSN Trend Analysis ➞ | |
| For tabular summary view of above stock list: Summary View ➞ 0 - 25 , 25 - 50 , 50 - 75 , 75 - 100 , 100 - 125 , 125 - 150 , 150 - 175 , 175 - 200 , 200 - 225 , 225 - 250 , 250 - 275 , 275 - 300 , 300 - 325 , 325 - 350 , 350 - 375 , 375 - 400 , 400 - 425 , 425 - 450 , 450 - 475 , 475 - 500 | ||
| Click To Change The Sort Order: By Market Cap or Company Size Performance: Year-to-date, Week and Day | |
| Select Chart Type: | ||
|
Best Stocks Today 12Stocks.com |
© 2024 12Stocks.com Terms & Conditions Privacy Contact Us
All Information Provided Only For Education And Not To Be Used For Investing or Trading. See Terms & Conditions


One More Thing ... Get Best Stocks Delivered Daily!
Never Ever Miss A Move With Our Top Ten Stocks Lists
Find Best Stocks In Any Market - Bull or Bear Market
Take A Peek At Our Top Ten Stocks Lists: Daily, Weekly, Year-to-Date & Top Trends
Find Best Stocks In Any Market - Bull or Bear Market
Take A Peek At Our Top Ten Stocks Lists: Daily, Weekly, Year-to-Date & Top Trends
S&P 500 Stocks With Best Up Trends [0-bearish to 100-bullish]: Genuine Parts[100], United Airlines[100], Generac Holdings[93], Bunge [93], Charles Schwab[93], Conagra Brands[93], Wells Fargo[90], PepsiCo [85], Lockheed Martin[85], Constellation [83], Progressive [83]
Best S&P 500 Stocks Year-to-Date:
NVIDIA [70.98%], Constellation [59.78%], Meta Platforms[41.76%], NRG [36.4%], Progressive [31.69%], Marathon [31.45%], Micron [31.16%], Western Digital[30.46%], Diamondback [28.71%], Targa Resources[28.68%], Eaton [28.29%] Best S&P 500 Stocks This Week:
United Airlines[23.01%], UnitedHealth [12.29%], Genuine Parts[10.21%], Globe Life[10%], ProShares UltraPro[7.09%], American Airlines[6.62%], Southwest Airlines[5.52%], Morgan Stanley[4.72%], V.F [4.62%], General Mills[4.37%], Estee Lauder[4.33%] Best S&P 500 Stocks Daily:
Genuine Parts[11.22%], United Airlines[5.50%], Estee Lauder[4.90%], Allstate [3.80%], Discover Financial[3.65%], Capital One[3.55%], V.F [3.43%], UnitedHealth [2.96%], Synchrony Financial[2.82%], Globe Life[2.80%], Wells Fargo[2.73%]