
 Login Sign Up


| |||||
 |  | ||||

| 12Stocks.com Market Intelligence |
Best S&P 500 Stocks
|
On this page, you will find the most comprehensive analysis of S&P 500 stocks and ETFs - from latest trends to performances to charts ➞. First, here are the year-to-date (YTD) performances of the most requested S&P 500 stocks at 12Stocks.com (click stock for review):
| NVIDIA 70% | ||
| Caterpillar 21% | ||
| Amazon.com 19% | ||
| Merck 15% | ||
| Walmart 14% | ||
| Google 11% | ||
| Microsoft 10% | ||
| JPMorgan Chase 6% | ||
| Chevron 5% | ||
| Goldman Sachs 5% | ||
| Johnson & Johnson -8% | ||
| McDonald s -9% | ||
| Starbucks -10% | ||
| Apple -13% | ||
| Gilead -17% | ||
| Intel -29% | ||
| Boeing -35% | ||
| Quick: S&P 500 Stocks Lists: Performances & Trends, S&P 500 Stock Charts
Sort S&P 500 stocks: Daily, Weekly, Year-to-Date, Market Cap & Trends. Filter S&P 500 stocks list by sector: Show all, Tech, Finance, Energy, Staples, Retail, Industrial, Materials, Utilities and HealthCare |
| 12Stocks.com S&P 500 Stocks Performances & Trends Daily Report | |||||||||
|
| 
The overall Smart Investing & Trading Score is 26 (0-bearish to 100-bullish) which puts S&P 500 index in short term bearish to neutral trend. The Smart Investing & Trading Score from previous trading session is 31 and a deterioration of trend continues. | ||||||||
Here are the Smart Investing & Trading Scores of the most requested S&P 500 stocks at 12Stocks.com (click stock name for detailed review):
|


| 12Stocks.com: Top Performing S&P 500 Index Stocks | ||||||||||||||||||||||||||||||||||||||||||||||||
 The top performing S&P 500 Index stocks year to date are
Now, more recently, over last week, the top performing S&P 500 Index stocks on the move are


|
||||||||||||||||||||||||||||||||||||||||||||||||
| 12Stocks.com: Investing in S&P 500 Index with Stocks | |
|
The following table helps investors and traders sort through current performance and trends (as measured by Smart Investing & Trading Score) of various
stocks in the S&P 500 Index. Quick View: Move mouse or cursor over stock symbol (ticker) to view short-term technical chart and over stock name to view long term chart. Click on  to add stock symbol to your watchlist and to add stock symbol to your watchlist and  to view watchlist. Click on any ticker or stock name for detailed market intelligence report for that stock. to view watchlist. Click on any ticker or stock name for detailed market intelligence report for that stock. |
12Stocks.com Performance of Stocks in S&P 500 Index
| Ticker | Stock Name | Watchlist | Category | Recent Price | Smart Investing & Trading Score | Change % | YTD Change% |
| AMAT | Applied Materials |   | Technology | 199.89 | 31 | -4.58% | 23.34% |
| BAX | Baxter | | Health Care | 39.52 | 36 | -0.13% | 2.22% |
| DG | Dollar General | | Services & Goods | 144.49 | 53 | -0.34% | 6.28% |
| ILMN | Illumina | | Health Care | 118.29 | 17 | 0.51% | -15.05% |
| DE | Deere & | | Industrials | 396.88 | 61 | 0.98% | -0.75% |
| GPN | Global Payments | | Services & Goods | 122.95 | 18 | -0.39% | -3.19% |
| AEP | American Electric | | Utilities | 81.24 | 53 | 2.18% | 0.02% |
| LHX | L3Harris Technologies | | Technology | 201.40 | 18 | 0.53% | -4.38% |
| GD | General Dynamics | | Industrials | 284.46 | 44 | -0.29% | 9.55% |
| ADSK | Autodesk | | Technology | 214.92 | 0 | -5.84% | -11.73% |
| AON | Aon | | Financials | 304.79 | 43 | 0.24% | 4.73% |
| EW | Edwards Life | | Health Care | 87.24 | 36 | -3.12% | 14.41% |
| LVS | Las Vegas | | Services & Goods | 50.23 | 41 | -0.55% | 2.07% |
| GEHC | GE HealthCare | | Health Care | 85.18 | 31 | -0.82% | 10.14% |
| NSC | Norfolk Southern | | Transports | 239.34 | 31 | -1.47% | 1.25% |
| MCO | Moody s | | Services & Goods | 375.41 | 25 | 1.26% | -3.88% |
| KDP | Keurig Dr | | Consumer Staples | 30.88 | 60 | 1.45% | -7.32% |
| SRE | Sempra | | Utilities | 67.94 | 27 | 2.30% | -9.09% |
| GIS | General Mills | | Consumer Staples | 68.51 | 68 | 0.99% | 5.17% |
| HUM | Humana | | Health Care | 323.46 | 49 | 1.87% | -29.35% |
| EXC | Exelon | | Utilities | 36.42 | 53 | 1.87% | 1.45% |
| NEM | Newmont | | Materials | 38.56 | 76 | 1.18% | -6.84% |
| COP | ConocoPhillips | | Energy | 128.33 | 51 | -0.93% | 10.56% |
| ROP | Roper Technologies | | Industrials | 526.47 | 10 | -0.10% | -3.43% |
| FDX | FedEx | | Transports | 263.07 | 26 | -0.71% | 3.99% |
| For chart view version of above stock list: Chart View ➞ 0 - 25 , 25 - 50 , 50 - 75 , 75 - 100 , 100 - 125 , 125 - 150 , 150 - 175 , 175 - 200 , 200 - 225 , 225 - 250 , 250 - 275 , 275 - 300 , 300 - 325 , 325 - 350 , 350 - 375 , 375 - 400 , 400 - 425 , 425 - 450 , 450 - 475 , 475 - 500 | ||
 | Click To Change The Sort Order: By Market Cap or Company Size Performance: Year-to-date, Week and Day |  |
|
Get the most comprehensive stock market coverage daily at 12Stocks.com ➞ Best Stocks Today ➞ Best Stocks Weekly ➞ Best Stocks Year-to-Date ➞ Best Stocks Trends ➞  Best Stocks Today 12Stocks.com Best Nasdaq Stocks ➞ Best S&P 500 Stocks ➞ Best Tech Stocks ➞ Best Biotech Stocks ➞ |
| Detailed Overview of S&P 500 Stocks |
| S&P 500 Technical Overview, Leaders & Laggards, Top S&P 500 ETF Funds & Detailed S&P 500 Stocks List, Charts, Trends & More |
| S&P 500: Technical Analysis, Trends & YTD Performance | |
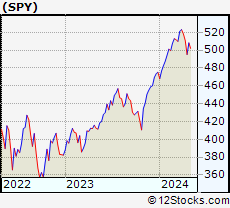
| S&P 500 index as represented by
SPY, an exchange-traded fund [ETF], holds basket of five hundred (mostly largecap) stocks from across all major sectors of the US stock market. The S&P 500 index (contains stocks like Apple and Exxon) is up by 5.31% and is currently outperforming the overall market by 0.9% year-to-date. Below is a quick view of technical charts and trends: | |
 SPY Weekly Chart |
|
| Long Term Trend: Good | |
| Medium Term Trend: Not Good | |
 SPY Daily Chart |
|
| Short Term Trend: Not Good | |
| Overall Trend Score: 26 | |
| YTD Performance: 5.31% | |
| **Trend Scores & Views Are Only For Educational Purposes And Not For Investing | |
| 12Stocks.com: Investing in S&P 500 Index using Exchange Traded Funds | |
|
The following table shows list of key exchange traded funds (ETF) that
help investors track S&P 500 index. The following list also includes leveraged ETF funds that track twice or thrice the daily returns of S&P 500 indices. Short or inverse ETF funds move in the opposite direction to the index they track and are useful during market pullbacks or during bear markets. Quick View: Move mouse or cursor over ETF symbol (ticker) to view short-term technical chart and over ETF name to view long term chart. Click on ticker or stock name for detailed view. Click on to add stock symbol to your watchlist and to view watchlist. |
12Stocks.com List of ETFs that track S&P 500 Index
| Ticker | ETF Name | Watchlist | Recent Price | Smart Investing & Trading Score | Change % | Week % | Year-to-date % |
| SPY | SPDR S&P 500 ETF | | 500.55 | 26 | -0.59 | -2.02 | 5.31% |
| IVV | iShares Core S&P 500 ETF | | 503.04 | 26 | -0.62 | -2 | 5.32% |
| VOO | Vanguard 500 ETF | | 459.99 | 26 | -0.65 | -2.04 | 5.31% |
| OEF | iShares S&P 100 | | 237.92 | 26 | -0.62 | -2.15 | 6.5% |
| SSO | ProShares Ultra S&P500 | | 70.66 | 26 | -1.24 | -4.07 | 8.59% |
| UPRO | ProShares UltraPro S&P500 | | 61.26 | 26 | -1.78 | -6.04 | 11.91% |
| SPXL | Direxion Daily S&P500 Bull 3X ETF | | 116.35 | 26 | -1.96 | -6.05 | 11.89% |
| SH | ProShares Short S&P500 | | 12.44 | 74 | 0.57 | 2.05 | -4.23% |
| SDS | ProShares UltraShort S&P500 | | 27.27 | 74 | 1.26 | 4.2 | -8.86% |
| SPXU | ProShares UltraPro Short S&P500 | | 37.07 | 74 | 1.90 | 6.34 | -13.79% |
| SPXS | Direxion Daily S&P 500 Bear 3X ETF | | 10.01 | 69 | 1.83 | 6.26 | -13.33% |
| 12Stocks.com: Charts, Trends, Fundamental Data and Performances of S&P 500 Stocks | |
|
We now take in-depth look at all S&P 500 stocks including charts, multi-period performances and overall trends (as measured by Smart Investing & Trading Score). One can sort S&P 500 stocks (click link to choose) by Daily, Weekly and by Year-to-Date performances. Also, one can sort by size of the company or by market capitalization. |
| Select Your Default Chart Type: | |||||
| |||||
| Click on stock symbol or name for detailed view. Click on to add stock symbol to your watchlist and to view watchlist. Quick View: Move mouse or cursor over "Daily" to quickly view daily technical stock chart and over "Weekly" to view weekly technical stock chart. | |||||

 | AMAT Applied Materials, Inc. |
| Sector: Technology | |
| SubSector: Semiconductor Equipment & Materials | |
| MarketCap: 40593.8 Millions | |
| Recent Price: 199.89 Smart Investing & Trading Score: 31 | |
| Day Percent Change: -4.58% Day Change: -9.59 | |
| Week Change: -3.83% Year-to-date Change: 23.3% | |
| AMAT Links: Profile News Message Board | |
| Charts:- Daily , Weekly | |
| Add AMAT to Watchlist: View: Get AMAT Trend Analysis ➞ | |
 | BAX Baxter International Inc. |
| Sector: Health Care | |
| SubSector: Medical Instruments & Supplies | |
| MarketCap: 39955.8 Millions | |
| Recent Price: 39.52 Smart Investing & Trading Score: 36 | |
| Day Percent Change: -0.13% Day Change: -0.05 | |
| Week Change: -2.01% Year-to-date Change: 2.2% | |
| BAX Links: Profile News Message Board | |
| Charts:- Daily , Weekly | |
| Add BAX to Watchlist: View: Get BAX Trend Analysis ➞ | |
 | DG Dollar General Corporation |
| Sector: Services & Goods | |
| SubSector: Discount, Variety Stores | |
| MarketCap: 39611.9 Millions | |
| Recent Price: 144.49 Smart Investing & Trading Score: 53 | |
| Day Percent Change: -0.34% Day Change: -0.50 | |
| Week Change: -2.23% Year-to-date Change: 6.3% | |
| DG Links: Profile News Message Board | |
| Charts:- Daily , Weekly | |
| Add DG to Watchlist: View: Get DG Trend Analysis ➞ | |
 | ILMN Illumina, Inc. |
| Sector: Health Care | |
| SubSector: Biotechnology | |
| MarketCap: 39194.3 Millions | |
| Recent Price: 118.29 Smart Investing & Trading Score: 17 | |
| Day Percent Change: 0.51% Day Change: 0.60 | |
| Week Change: -6.91% Year-to-date Change: -15.1% | |
| ILMN Links: Profile News Message Board | |
| Charts:- Daily , Weekly | |
| Add ILMN to Watchlist: View: Get ILMN Trend Analysis ➞ | |
 | DE Deere & Company |
| Sector: Industrials | |
| SubSector: Farm & Construction Machinery | |
| MarketCap: 39168.7 Millions | |
| Recent Price: 396.88 Smart Investing & Trading Score: 61 | |
| Day Percent Change: 0.98% Day Change: 3.87 | |
| Week Change: -0.1% Year-to-date Change: -0.8% | |
| DE Links: Profile News Message Board | |
| Charts:- Daily , Weekly | |
| Add DE to Watchlist: View: Get DE Trend Analysis ➞ | |
 | GPN Global Payments Inc. |
| Sector: Services & Goods | |
| SubSector: Business Services | |
| MarketCap: 39068.8 Millions | |
| Recent Price: 122.95 Smart Investing & Trading Score: 18 | |
| Day Percent Change: -0.39% Day Change: -0.48 | |
| Week Change: -0.64% Year-to-date Change: -3.2% | |
| GPN Links: Profile News Message Board | |
| Charts:- Daily , Weekly | |
| Add GPN to Watchlist: View: Get GPN Trend Analysis ➞ | |
 | AEP American Electric Power Company, Inc. |
| Sector: Utilities | |
| SubSector: Electric Utilities | |
| MarketCap: 38380 Millions | |
| Recent Price: 81.24 Smart Investing & Trading Score: 53 | |
| Day Percent Change: 2.18% Day Change: 1.73 | |
| Week Change: -1.05% Year-to-date Change: 0.0% | |
| AEP Links: Profile News Message Board | |
| Charts:- Daily , Weekly | |
| Add AEP to Watchlist: View: Get AEP Trend Analysis ➞ | |
 | LHX L3Harris Technologies, Inc. |
| Sector: Technology | |
| SubSector: Communication Equipment | |
| MarketCap: 37906.1 Millions | |
| Recent Price: 201.40 Smart Investing & Trading Score: 18 | |
| Day Percent Change: 0.53% Day Change: 1.06 | |
| Week Change: -0.6% Year-to-date Change: -4.4% | |
| LHX Links: Profile News Message Board | |
| Charts:- Daily , Weekly | |
| Add LHX to Watchlist: View: Get LHX Trend Analysis ➞ | |
 | GD General Dynamics Corporation |
| Sector: Industrials | |
| SubSector: Aerospace/Defense Products & Services | |
| MarketCap: 37063.8 Millions | |
| Recent Price: 284.46 Smart Investing & Trading Score: 44 | |
| Day Percent Change: -0.29% Day Change: -0.84 | |
| Week Change: -1.18% Year-to-date Change: 9.6% | |
| GD Links: Profile News Message Board | |
| Charts:- Daily , Weekly | |
| Add GD to Watchlist: View: Get GD Trend Analysis ➞ | |
 | ADSK Autodesk, Inc. |
| Sector: Technology | |
| SubSector: Technical & System Software | |
| MarketCap: 36975.8 Millions | |
| Recent Price: 214.92 Smart Investing & Trading Score: 0 | |
| Day Percent Change: -5.84% Day Change: -13.32 | |
| Week Change: -9.31% Year-to-date Change: -11.7% | |
| ADSK Links: Profile News Message Board | |
| Charts:- Daily , Weekly | |
| Add ADSK to Watchlist: View: Get ADSK Trend Analysis ➞ | |
 | AON Aon plc |
| Sector: Financials | |
| SubSector: Insurance Brokers | |
| MarketCap: 36870.1 Millions | |
| Recent Price: 304.79 Smart Investing & Trading Score: 43 | |
| Day Percent Change: 0.24% Day Change: 0.74 | |
| Week Change: -1.04% Year-to-date Change: 4.7% | |
| AON Links: Profile News Message Board | |
| Charts:- Daily , Weekly | |
| Add AON to Watchlist: View: Get AON Trend Analysis ➞ | |
 | EW Edwards Lifesciences Corporation |
| Sector: Health Care | |
| SubSector: Medical Appliances & Equipment | |
| MarketCap: 36735.5 Millions | |
| Recent Price: 87.24 Smart Investing & Trading Score: 36 | |
| Day Percent Change: -3.12% Day Change: -2.81 | |
| Week Change: -3.37% Year-to-date Change: 14.4% | |
| EW Links: Profile News Message Board | |
| Charts:- Daily , Weekly | |
| Add EW to Watchlist: View: Get EW Trend Analysis ➞ | |
 | LVS Las Vegas Sands Corp. |
| Sector: Services & Goods | |
| SubSector: Resorts & Casinos | |
| MarketCap: 36431.6 Millions | |
| Recent Price: 50.23 Smart Investing & Trading Score: 41 | |
| Day Percent Change: -0.55% Day Change: -0.28 | |
| Week Change: -0.4% Year-to-date Change: 2.1% | |
| LVS Links: Profile News Message Board | |
| Charts:- Daily , Weekly | |
| Add LVS to Watchlist: View: Get LVS Trend Analysis ➞ | |
 | GEHC GE HealthCare Technologies Inc. |
| Sector: Health Care | |
| SubSector: Health Information Services | |
| MarketCap: 36240 Millions | |
| Recent Price: 85.18 Smart Investing & Trading Score: 31 | |
| Day Percent Change: -0.82% Day Change: -0.70 | |
| Week Change: -3.43% Year-to-date Change: 10.1% | |
| GEHC Links: Profile News Message Board | |
| Charts:- Daily , Weekly | |
| Add GEHC to Watchlist: View: Get GEHC Trend Analysis ➞ | |
 | NSC Norfolk Southern Corporation |
| Sector: Transports | |
| SubSector: Railroads | |
| MarketCap: 36165.4 Millions | |
| Recent Price: 239.34 Smart Investing & Trading Score: 31 | |
| Day Percent Change: -1.47% Day Change: -3.57 | |
| Week Change: -2.6% Year-to-date Change: 1.3% | |
| NSC Links: Profile News Message Board | |
| Charts:- Daily , Weekly | |
| Add NSC to Watchlist: View: Get NSC Trend Analysis ➞ | |
 | MCO Moody s Corporation |
| Sector: Services & Goods | |
| SubSector: Business Services | |
| MarketCap: 35998.5 Millions | |
| Recent Price: 375.41 Smart Investing & Trading Score: 25 | |
| Day Percent Change: 1.26% Day Change: 4.68 | |
| Week Change: -0.46% Year-to-date Change: -3.9% | |
| MCO Links: Profile News Message Board | |
| Charts:- Daily , Weekly | |
| Add MCO to Watchlist: View: Get MCO Trend Analysis ➞ | |
 | KDP Keurig Dr Pepper Inc. |
| Sector: Consumer Staples | |
| SubSector: Beverages - Soft Drinks | |
| MarketCap: 35295.2 Millions | |
| Recent Price: 30.88 Smart Investing & Trading Score: 60 | |
| Day Percent Change: 1.45% Day Change: 0.44 | |
| Week Change: 2.18% Year-to-date Change: -7.3% | |
| KDP Links: Profile News Message Board | |
| Charts:- Daily , Weekly | |
| Add KDP to Watchlist: View: Get KDP Trend Analysis ➞ | |
 | SRE Sempra Energy |
| Sector: Utilities | |
| SubSector: Diversified Utilities | |
| MarketCap: 34339.9 Millions | |
| Recent Price: 67.94 Smart Investing & Trading Score: 27 | |
| Day Percent Change: 2.30% Day Change: 1.53 | |
| Week Change: -1.09% Year-to-date Change: -9.1% | |
| SRE Links: Profile News Message Board | |
| Charts:- Daily , Weekly | |
| Add SRE to Watchlist: View: Get SRE Trend Analysis ➞ | |
 | GIS General Mills, Inc. |
| Sector: Consumer Staples | |
| SubSector: Processed & Packaged Goods | |
| MarketCap: 34131.7 Millions | |
| Recent Price: 68.51 Smart Investing & Trading Score: 68 | |
| Day Percent Change: 0.99% Day Change: 0.67 | |
| Week Change: 3.49% Year-to-date Change: 5.2% | |
| GIS Links: Profile News Message Board | |
| Charts:- Daily , Weekly | |
| Add GIS to Watchlist: View: Get GIS Trend Analysis ➞ | |
 | HUM Humana Inc. |
| Sector: Health Care | |
| SubSector: Health Care Plans | |
| MarketCap: 34125.6 Millions | |
| Recent Price: 323.46 Smart Investing & Trading Score: 49 | |
| Day Percent Change: 1.87% Day Change: 5.94 | |
| Week Change: 3.48% Year-to-date Change: -29.4% | |
| HUM Links: Profile News Message Board | |
| Charts:- Daily , Weekly | |
| Add HUM to Watchlist: View: Get HUM Trend Analysis ➞ | |
 | EXC Exelon Corporation |
| Sector: Utilities | |
| SubSector: Diversified Utilities | |
| MarketCap: 34091.9 Millions | |
| Recent Price: 36.42 Smart Investing & Trading Score: 53 | |
| Day Percent Change: 1.87% Day Change: 0.67 | |
| Week Change: -1.03% Year-to-date Change: 1.5% | |
| EXC Links: Profile News Message Board | |
| Charts:- Daily , Weekly | |
| Add EXC to Watchlist: View: Get EXC Trend Analysis ➞ | |
 | NEM Newmont Corporation |
| Sector: Materials | |
| SubSector: Gold | |
| MarketCap: 33928.8 Millions | |
| Recent Price: 38.56 Smart Investing & Trading Score: 76 | |
| Day Percent Change: 1.18% Day Change: 0.45 | |
| Week Change: -0.21% Year-to-date Change: -6.8% | |
| NEM Links: Profile News Message Board | |
| Charts:- Daily , Weekly | |
| Add NEM to Watchlist: View: Get NEM Trend Analysis ➞ | |
 | COP ConocoPhillips |
| Sector: Energy | |
| SubSector: Independent Oil & Gas | |
| MarketCap: 33504.3 Millions | |
| Recent Price: 128.33 Smart Investing & Trading Score: 51 | |
| Day Percent Change: -0.93% Day Change: -1.20 | |
| Week Change: -2.19% Year-to-date Change: 10.6% | |
| COP Links: Profile News Message Board | |
| Charts:- Daily , Weekly | |
| Add COP to Watchlist: View: Get COP Trend Analysis ➞ | |
 | ROP Roper Technologies, Inc. |
| Sector: Industrials | |
| SubSector: Diversified Machinery | |
| MarketCap: 33366.2 Millions | |
| Recent Price: 526.47 Smart Investing & Trading Score: 10 | |
| Day Percent Change: -0.10% Day Change: -0.51 | |
| Week Change: -1.75% Year-to-date Change: -3.4% | |
| ROP Links: Profile News Message Board | |
| Charts:- Daily , Weekly | |
| Add ROP to Watchlist: View: Get ROP Trend Analysis ➞ | |
 | FDX FedEx Corporation |
| Sector: Transports | |
| SubSector: Air Delivery & Freight Services | |
| MarketCap: 33188 Millions | |
| Recent Price: 263.07 Smart Investing & Trading Score: 26 | |
| Day Percent Change: -0.71% Day Change: -1.87 | |
| Week Change: -1.77% Year-to-date Change: 4.0% | |
| FDX Links: Profile News Message Board | |
| Charts:- Daily , Weekly | |
| Add FDX to Watchlist: View: Get FDX Trend Analysis ➞ | |
| For tabular summary view of above stock list: Summary View ➞ 0 - 25 , 25 - 50 , 50 - 75 , 75 - 100 , 100 - 125 , 125 - 150 , 150 - 175 , 175 - 200 , 200 - 225 , 225 - 250 , 250 - 275 , 275 - 300 , 300 - 325 , 325 - 350 , 350 - 375 , 375 - 400 , 400 - 425 , 425 - 450 , 450 - 475 , 475 - 500 | ||
| Click To Change The Sort Order: By Market Cap or Company Size Performance: Year-to-date, Week and Day | |
| Select Chart Type: | ||
|
Best Stocks Today 12Stocks.com |
© 2024 12Stocks.com Terms & Conditions Privacy Contact Us
All Information Provided Only For Education And Not To Be Used For Investing or Trading. See Terms & Conditions


One More Thing ... Get Best Stocks Delivered Daily!
Never Ever Miss A Move With Our Top Ten Stocks Lists
Find Best Stocks In Any Market - Bull or Bear Market
Take A Peek At Our Top Ten Stocks Lists: Daily, Weekly, Year-to-Date & Top Trends
Find Best Stocks In Any Market - Bull or Bear Market
Take A Peek At Our Top Ten Stocks Lists: Daily, Weekly, Year-to-Date & Top Trends
S&P 500 Stocks With Best Up Trends [0-bearish to 100-bullish]: United Airlines[100], Conagra Brands[95], Bunge [93], Charles Schwab[88], Lockheed Martin[86], Progressive [83], NextEra [81], Newmont [76], Google [75], Google [75], Yum! Brands[75]
Best S&P 500 Stocks Year-to-Date:
NVIDIA [69.69%], Constellation [58.3%], NRG [42.01%], Meta Platforms[39.59%], Marathon [36.47%], Micron [36.31%], Western Digital[33.99%], Progressive [31.29%], Diamondback [29.71%], Targa Resources[29.19%], Eaton [28.8%] Best S&P 500 Stocks This Week:
United Airlines[16.6%], UnitedHealth [9.06%], Globe Life[7.01%], ProShares UltraPro[6.34%], American Airlines[5.63%], Morgan Stanley[4.51%], Southwest Airlines[4.5%], Goldman Sachs[3.7%], Charles Schwab[3.53%], General Mills[3.49%], Humana [3.48%] Best S&P 500 Stocks Daily:
United Airlines[17.45%], American Airlines[6.60%], Globe Life[5.44%], NextEra [3.39%], Consolidated Edison[3.33%], Norwegian Cruise[3.15%], Dominion [3.12%], Southern [3.00%], Delta Air[2.86%], First Solar[2.85%], Southwest Airlines[2.60%]