
 Login Sign Up


| |||||
 |  | ||||

| 12Stocks.com Market Intelligence |
Best S&P 500 Stocks
|
On this page, you will find the most comprehensive analysis of S&P 500 stocks and ETFs - from latest trends to performances to charts ➞. First, here are the year-to-date (YTD) performances of the most requested S&P 500 stocks at 12Stocks.com (click stock for review):
| NVIDIA 74% | ||
| Caterpillar 23% | ||
| Amazon.com 20% | ||
| Merck 16% | ||
| Walmart 14% | ||
| Google 11% | ||
| Microsoft 10% | ||
| JPMorgan Chase 8% | ||
| Chevron 6% | ||
| Goldman Sachs 4% | ||
| Johnson & Johnson -6% | ||
| McDonald s -10% | ||
| Apple -10% | ||
| Starbucks -11% | ||
| Gilead -16% | ||
| Intel -28% | ||
| Boeing -36% | ||
| Quick: S&P 500 Stocks Lists: Performances & Trends, S&P 500 Stock Charts
Sort S&P 500 stocks: Daily, Weekly, Year-to-Date, Market Cap & Trends. Filter S&P 500 stocks list by sector: Show all, Tech, Finance, Energy, Staples, Retail, Industrial, Materials, Utilities and HealthCare |
| 12Stocks.com S&P 500 Stocks Performances & Trends Daily Report | |||||||||
|
| 
The overall Smart Investing & Trading Score is 26 (0-bearish to 100-bullish) which puts S&P 500 index in short term bearish to neutral trend. The Smart Investing & Trading Score from previous trading session is 31 and hence a deterioration of trend. | ||||||||
Here are the Smart Investing & Trading Scores of the most requested S&P 500 stocks at 12Stocks.com (click stock name for detailed review):
|


| 12Stocks.com: Top Performing S&P 500 Index Stocks | ||||||||||||||||||||||||||||||||||||||||||||||||
 The top performing S&P 500 Index stocks year to date are
Now, more recently, over last week, the top performing S&P 500 Index stocks on the move are


|
||||||||||||||||||||||||||||||||||||||||||||||||
| 12Stocks.com: Investing in S&P 500 Index with Stocks | |
|
The following table helps investors and traders sort through current performance and trends (as measured by Smart Investing & Trading Score) of various
stocks in the S&P 500 Index. Quick View: Move mouse or cursor over stock symbol (ticker) to view short-term technical chart and over stock name to view long term chart. Click on  to add stock symbol to your watchlist and to add stock symbol to your watchlist and  to view watchlist. Click on any ticker or stock name for detailed market intelligence report for that stock. to view watchlist. Click on any ticker or stock name for detailed market intelligence report for that stock. |
12Stocks.com Performance of Stocks in S&P 500 Index
| Ticker | Stock Name | Watchlist | Category | Recent Price | Smart Investing & Trading Score | Change % | YTD Change% |
| IBM | Business |   | Technology | 181.25 | 0 | -0.56% | 10.82% |
| C | Citi | | Financials | 58.56 | 31 | -1.88% | 13.84% |
| LMT | Lockheed Martin | | Industrials | 453.08 | 85 | 0.60% | -0.04% |
| DHR | Danaher | | Industrials | 239.66 | 23 | -0.12% | 3.60% |
| AMT | American Tower | | Financials | 178.12 | 10 | -0.60% | -17.49% |
| HON | Honeywell | | Industrials | 194.04 | 0 | -1.08% | -7.47% |
| TSLA | Tesla | | Consumer Staples | 161.48 | 10 | -5.59% | -35.01% |
| LIN | Linde | | Materials | 444.75 | 44 | -0.59% | 8.29% |
| UNP | Union Pacific | | Transports | 233.94 | 0 | -0.20% | -4.76% |
| AVGO | Broadcom | | Technology | 1310.69 | 31 | -2.48% | 17.42% |
| ABNB | Airbnb | | Technology | 155.60 | 26 | -2.37% | 14.29% |
| CHTR | Charter | | Technology | 256.90 | 10 | -1.38% | -33.90% |
| UPS | United Parcel | | Transports | 144.85 | 36 | -0.04% | -7.87% |
| CVS | CVS Health | | Health Care | 68.96 | 17 | 0.47% | -12.66% |
| MMM | 3M | | Industrials | 91.30 | 10 | -0.01% | -16.48% |
| QCOM | QUALCOMM | | Technology | 169.84 | 51 | -0.85% | 17.43% |
| SBUX | Starbucks | | Services & Goods | 85.17 | 17 | 0.29% | -11.29% |
| TMUS | T-Mobile US | | Technology | 159.82 | 15 | -0.14% | -0.32% |
| FIS | Fidelity National | | Technology | 70.72 | 36 | -0.32% | 17.73% |
| MO | Altria | | Consumer Staples | 40.95 | 46 | -0.24% | 1.51% |
| AXP | American Express | | Financials | 218.40 | 56 | 0.09% | 16.58% |
| MDLZ | Mondelez | | Consumer Staples | 65.87 | 10 | -1.23% | -9.06% |
| BA | Boeing | | Industrials | 167.82 | 10 | -1.02% | -35.62% |
| GE | General Electric | | Industrials | 153.70 | 50 | -0.60% | 20.43% |
| CME | CME | | Financials | 206.23 | 13 | -1.56% | -2.08% |
| For chart view version of above stock list: Chart View ➞ 0 - 25 , 25 - 50 , 50 - 75 , 75 - 100 , 100 - 125 , 125 - 150 , 150 - 175 , 175 - 200 , 200 - 225 , 225 - 250 , 250 - 275 , 275 - 300 , 300 - 325 , 325 - 350 , 350 - 375 , 375 - 400 , 400 - 425 , 425 - 450 , 450 - 475 , 475 - 500 | ||
 | Click To Change The Sort Order: By Market Cap or Company Size Performance: Year-to-date, Week and Day |  |
|
Get the most comprehensive stock market coverage daily at 12Stocks.com ➞ Best Stocks Today ➞ Best Stocks Weekly ➞ Best Stocks Year-to-Date ➞ Best Stocks Trends ➞  Best Stocks Today 12Stocks.com Best Nasdaq Stocks ➞ Best S&P 500 Stocks ➞ Best Tech Stocks ➞ Best Biotech Stocks ➞ |
| Detailed Overview of S&P 500 Stocks |
| S&P 500 Technical Overview, Leaders & Laggards, Top S&P 500 ETF Funds & Detailed S&P 500 Stocks List, Charts, Trends & More |
| S&P 500: Technical Analysis, Trends & YTD Performance | |
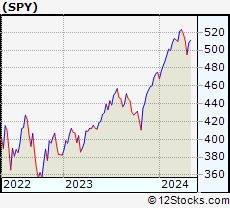
| S&P 500 index as represented by
SPY, an exchange-traded fund [ETF], holds basket of five hundred (mostly largecap) stocks from across all major sectors of the US stock market. The S&P 500 index (contains stocks like Apple and Exxon) is up by 6.13% and is currently outperforming the overall market by 0.79% year-to-date. Below is a quick view of technical charts and trends: | |
 SPY Weekly Chart |
|
| Long Term Trend: Good | |
| Medium Term Trend: Not Good | |
 SPY Daily Chart |
|
| Short Term Trend: Not Good | |
| Overall Trend Score: 26 | |
| YTD Performance: 6.13% | |
| **Trend Scores & Views Are Only For Educational Purposes And Not For Investing | |
| 12Stocks.com: Investing in S&P 500 Index using Exchange Traded Funds | |
|
The following table shows list of key exchange traded funds (ETF) that
help investors track S&P 500 index. The following list also includes leveraged ETF funds that track twice or thrice the daily returns of S&P 500 indices. Short or inverse ETF funds move in the opposite direction to the index they track and are useful during market pullbacks or during bear markets. Quick View: Move mouse or cursor over ETF symbol (ticker) to view short-term technical chart and over ETF name to view long term chart. Click on ticker or stock name for detailed view. Click on to add stock symbol to your watchlist and to view watchlist. |
12Stocks.com List of ETFs that track S&P 500 Index
| Ticker | ETF Name | Watchlist | Recent Price | Smart Investing & Trading Score | Change % | Week % | Year-to-date % |
| SPY | SPDR S&P 500 ETF | | 504.45 | 26 | -1.25 | -1.25 | 6.13% |
| IVV | iShares Core S&P 500 ETF | | 506.95 | 39 | -1.24 | -1.24 | 6.14% |
| VOO | Vanguard 500 ETF | | 463.61 | 39 | -1.27 | -1.27 | 6.14% |
| OEF | iShares S&P 100 | | 239.88 | 26 | -1.34 | -1.34 | 7.38% |
| SSO | ProShares Ultra S&P500 | | 71.81 | 26 | -2.51 | -2.51 | 10.36% |
| UPRO | ProShares UltraPro S&P500 | | 62.77 | 26 | -3.73 | -3.73 | 14.67% |
| SPXL | Direxion Daily S&P500 Bull 3X ETF | | 119.26 | 31 | -3.70 | -3.7 | 14.68% |
| SH | ProShares Short S&P500 | | 12.33 | 74 | 1.15 | 1.15 | -5.08% |
| SDS | ProShares UltraShort S&P500 | | 26.82 | 69 | 2.48 | 2.48 | -10.36% |
| SPXU | ProShares UltraPro Short S&P500 | | 36.14 | 74 | 3.67 | 3.67 | -15.95% |
| SPXS | Direxion Daily S&P 500 Bear 3X ETF | | 9.77 | 64 | 3.72 | 3.72 | -15.41% |
| 12Stocks.com: Charts, Trends, Fundamental Data and Performances of S&P 500 Stocks | |
|
We now take in-depth look at all S&P 500 stocks including charts, multi-period performances and overall trends (as measured by Smart Investing & Trading Score). One can sort S&P 500 stocks (click link to choose) by Daily, Weekly and by Year-to-Date performances. Also, one can sort by size of the company or by market capitalization. |
| Select Your Default Chart Type: | |||||
| |||||
| Click on stock symbol or name for detailed view. Click on to add stock symbol to your watchlist and to view watchlist. Quick View: Move mouse or cursor over "Daily" to quickly view daily technical stock chart and over "Weekly" to view weekly technical stock chart. | |||||

 | IBM International Business Machines Corporation |
| Sector: Technology | |
| SubSector: Information Technology Services | |
| MarketCap: 97241.6 Millions | |
| Recent Price: 181.25 Smart Investing & Trading Score: 0 | |
| Day Percent Change: -0.56% Day Change: -1.02 | |
| Week Change: -0.56% Year-to-date Change: 10.8% | |
| IBM Links: Profile News Message Board | |
| Charts:- Daily , Weekly | |
| Add IBM to Watchlist: View: Get IBM Trend Analysis ➞ | |
 | C Citigroup Inc. |
| Sector: Financials | |
| SubSector: Money Center Banks | |
| MarketCap: 94128 Millions | |
| Recent Price: 58.56 Smart Investing & Trading Score: 31 | |
| Day Percent Change: -1.88% Day Change: -1.12 | |
| Week Change: -1.88% Year-to-date Change: 13.8% | |
| C Links: Profile News Message Board | |
| Charts:- Daily , Weekly | |
| Add C to Watchlist: View: Get C Trend Analysis ➞ | |
 | LMT Lockheed Martin Corporation |
| Sector: Industrials | |
| SubSector: Aerospace/Defense Products & Services | |
| MarketCap: 94116.4 Millions | |
| Recent Price: 453.08 Smart Investing & Trading Score: 85 | |
| Day Percent Change: 0.60% Day Change: 2.68 | |
| Week Change: 0.6% Year-to-date Change: 0.0% | |
| LMT Links: Profile News Message Board | |
| Charts:- Daily , Weekly | |
| Add LMT to Watchlist: View: Get LMT Trend Analysis ➞ | |
 | DHR Danaher Corporation |
| Sector: Industrials | |
| SubSector: Diversified Machinery | |
| MarketCap: 93210.3 Millions | |
| Recent Price: 239.66 Smart Investing & Trading Score: 23 | |
| Day Percent Change: -0.12% Day Change: -0.29 | |
| Week Change: -0.12% Year-to-date Change: 3.6% | |
| DHR Links: Profile News Message Board | |
| Charts:- Daily , Weekly | |
| Add DHR to Watchlist: View: Get DHR Trend Analysis ➞ | |
 | AMT American Tower Corporation (REIT) |
| Sector: Financials | |
| SubSector: REIT - Diversified | |
| MarketCap: 92527 Millions | |
| Recent Price: 178.12 Smart Investing & Trading Score: 10 | |
| Day Percent Change: -0.60% Day Change: -1.08 | |
| Week Change: -0.6% Year-to-date Change: -17.5% | |
| AMT Links: Profile News Message Board | |
| Charts:- Daily , Weekly | |
| Add AMT to Watchlist: View: Get AMT Trend Analysis ➞ | |
 | HON Honeywell International Inc. |
| Sector: Industrials | |
| SubSector: Diversified Machinery | |
| MarketCap: 91189.1 Millions | |
| Recent Price: 194.04 Smart Investing & Trading Score: 0 | |
| Day Percent Change: -1.08% Day Change: -2.12 | |
| Week Change: -1.08% Year-to-date Change: -7.5% | |
| HON Links: Profile News Message Board | |
| Charts:- Daily , Weekly | |
| Add HON to Watchlist: View: Get HON Trend Analysis ➞ | |
 | TSLA Tesla, Inc. |
| Sector: Consumer Staples | |
| SubSector: Auto Manufacturers - Major | |
| MarketCap: 89058.8 Millions | |
| Recent Price: 161.48 Smart Investing & Trading Score: 10 | |
| Day Percent Change: -5.59% Day Change: -9.57 | |
| Week Change: -5.59% Year-to-date Change: -35.0% | |
| TSLA Links: Profile News Message Board | |
| Charts:- Daily , Weekly | |
| Add TSLA to Watchlist: View: Get TSLA Trend Analysis ➞ | |
 | LIN Linde plc |
| Sector: Materials | |
| SubSector: Specialty Chemicals | |
| MarketCap: 88539.2 Millions | |
| Recent Price: 444.75 Smart Investing & Trading Score: 44 | |
| Day Percent Change: -0.59% Day Change: -2.66 | |
| Week Change: -0.59% Year-to-date Change: 8.3% | |
| LIN Links: Profile News Message Board | |
| Charts:- Daily , Weekly | |
| Add LIN to Watchlist: View: Get LIN Trend Analysis ➞ | |
 | UNP Union Pacific Corporation |
| Sector: Transports | |
| SubSector: Railroads | |
| MarketCap: 87198.1 Millions | |
| Recent Price: 233.94 Smart Investing & Trading Score: 0 | |
| Day Percent Change: -0.20% Day Change: -0.46 | |
| Week Change: -0.2% Year-to-date Change: -4.8% | |
| UNP Links: Profile News Message Board | |
| Charts:- Daily , Weekly | |
| Add UNP to Watchlist: View: Get UNP Trend Analysis ➞ | |
 | AVGO Broadcom Inc. |
| Sector: Technology | |
| SubSector: Semiconductor - Broad Line | |
| MarketCap: 86329.1 Millions | |
| Recent Price: 1310.69 Smart Investing & Trading Score: 31 | |
| Day Percent Change: -2.48% Day Change: -33.38 | |
| Week Change: -2.48% Year-to-date Change: 17.4% | |
| AVGO Links: Profile News Message Board | |
| Charts:- Daily , Weekly | |
| Add AVGO to Watchlist: View: Get AVGO Trend Analysis ➞ | |
 | ABNB Airbnb, Inc. |
| Sector: Technology | |
| SubSector: Internet Content & Information | |
| MarketCap: 86237 Millions | |
| Recent Price: 155.60 Smart Investing & Trading Score: 26 | |
| Day Percent Change: -2.37% Day Change: -3.77 | |
| Week Change: -2.37% Year-to-date Change: 14.3% | |
| ABNB Links: Profile News Message Board | |
| Charts:- Daily , Weekly | |
| Add ABNB to Watchlist: View: Get ABNB Trend Analysis ➞ | |
 | CHTR Charter Communications, Inc. |
| Sector: Technology | |
| SubSector: CATV Systems | |
| MarketCap: 82268.3 Millions | |
| Recent Price: 256.90 Smart Investing & Trading Score: 10 | |
| Day Percent Change: -1.38% Day Change: -3.60 | |
| Week Change: -1.38% Year-to-date Change: -33.9% | |
| CHTR Links: Profile News Message Board | |
| Charts:- Daily , Weekly | |
| Add CHTR to Watchlist: View: Get CHTR Trend Analysis ➞ | |
 | UPS United Parcel Service, Inc. |
| Sector: Transports | |
| SubSector: Air Delivery & Freight Services | |
| MarketCap: 81928.9 Millions | |
| Recent Price: 144.85 Smart Investing & Trading Score: 36 | |
| Day Percent Change: -0.04% Day Change: -0.06 | |
| Week Change: -0.04% Year-to-date Change: -7.9% | |
| UPS Links: Profile News Message Board | |
| Charts:- Daily , Weekly | |
| Add UPS to Watchlist: View: Get UPS Trend Analysis ➞ | |
 | CVS CVS Health Corporation |
| Sector: Health Care | |
| SubSector: Health Care Plans | |
| MarketCap: 80104.3 Millions | |
| Recent Price: 68.96 Smart Investing & Trading Score: 17 | |
| Day Percent Change: 0.47% Day Change: 0.32 | |
| Week Change: 0.47% Year-to-date Change: -12.7% | |
| CVS Links: Profile News Message Board | |
| Charts:- Daily , Weekly | |
| Add CVS to Watchlist: View: Get CVS Trend Analysis ➞ | |
 | MMM 3M Company |
| Sector: Industrials | |
| SubSector: Diversified Machinery | |
| MarketCap: 79237.7 Millions | |
| Recent Price: 91.30 Smart Investing & Trading Score: 10 | |
| Day Percent Change: -0.01% Day Change: -0.01 | |
| Week Change: -0.01% Year-to-date Change: -16.5% | |
| MMM Links: Profile News Message Board | |
| Charts:- Daily , Weekly | |
| Add MMM to Watchlist: View: Get MMM Trend Analysis ➞ | |
 | QCOM QUALCOMM Incorporated |
| Sector: Technology | |
| SubSector: Communication Equipment | |
| MarketCap: 77517.7 Millions | |
| Recent Price: 169.84 Smart Investing & Trading Score: 51 | |
| Day Percent Change: -0.85% Day Change: -1.45 | |
| Week Change: -0.85% Year-to-date Change: 17.4% | |
| QCOM Links: Profile News Message Board | |
| Charts:- Daily , Weekly | |
| Add QCOM to Watchlist: View: Get QCOM Trend Analysis ➞ | |
 | SBUX Starbucks Corporation |
| Sector: Services & Goods | |
| SubSector: Specialty Eateries | |
| MarketCap: 74909.7 Millions | |
| Recent Price: 85.17 Smart Investing & Trading Score: 17 | |
| Day Percent Change: 0.29% Day Change: 0.25 | |
| Week Change: 0.29% Year-to-date Change: -11.3% | |
| SBUX Links: Profile News Message Board | |
| Charts:- Daily , Weekly | |
| Add SBUX to Watchlist: View: Get SBUX Trend Analysis ➞ | |
 | TMUS T-Mobile US, Inc. |
| Sector: Technology | |
| SubSector: Wireless Communications | |
| MarketCap: 71949 Millions | |
| Recent Price: 159.82 Smart Investing & Trading Score: 15 | |
| Day Percent Change: -0.14% Day Change: -0.23 | |
| Week Change: -0.14% Year-to-date Change: -0.3% | |
| TMUS Links: Profile News Message Board | |
| Charts:- Daily , Weekly | |
| Add TMUS to Watchlist: View: Get TMUS Trend Analysis ➞ | |
 | FIS Fidelity National Information Services, Inc. |
| Sector: Technology | |
| SubSector: Information Technology Services | |
| MarketCap: 71126.8 Millions | |
| Recent Price: 70.72 Smart Investing & Trading Score: 36 | |
| Day Percent Change: -0.32% Day Change: -0.23 | |
| Week Change: -0.32% Year-to-date Change: 17.7% | |
| FIS Links: Profile News Message Board | |
| Charts:- Daily , Weekly | |
| Add FIS to Watchlist: View: Get FIS Trend Analysis ➞ | |
 | MO Altria Group, Inc. |
| Sector: Consumer Staples | |
| SubSector: Cigarettes | |
| MarketCap: 70806.3 Millions | |
| Recent Price: 40.95 Smart Investing & Trading Score: 46 | |
| Day Percent Change: -0.24% Day Change: -0.10 | |
| Week Change: -0.24% Year-to-date Change: 1.5% | |
| MO Links: Profile News Message Board | |
| Charts:- Daily , Weekly | |
| Add MO to Watchlist: View: Get MO Trend Analysis ➞ | |
 | AXP American Express Company |
| Sector: Financials | |
| SubSector: Credit Services | |
| MarketCap: 68388 Millions | |
| Recent Price: 218.40 Smart Investing & Trading Score: 56 | |
| Day Percent Change: 0.09% Day Change: 0.20 | |
| Week Change: 0.09% Year-to-date Change: 16.6% | |
| AXP Links: Profile News Message Board | |
| Charts:- Daily , Weekly | |
| Add AXP to Watchlist: View: Get AXP Trend Analysis ➞ | |
 | MDLZ Mondelez International, Inc. |
| Sector: Consumer Staples | |
| SubSector: Confectioners | |
| MarketCap: 68385.8 Millions | |
| Recent Price: 65.87 Smart Investing & Trading Score: 10 | |
| Day Percent Change: -1.23% Day Change: -0.82 | |
| Week Change: -1.23% Year-to-date Change: -9.1% | |
| MDLZ Links: Profile News Message Board | |
| Charts:- Daily , Weekly | |
| Add MDLZ to Watchlist: View: Get MDLZ Trend Analysis ➞ | |
 | BA The Boeing Company |
| Sector: Industrials | |
| SubSector: Aerospace/Defense Products & Services | |
| MarketCap: 65336.4 Millions | |
| Recent Price: 167.82 Smart Investing & Trading Score: 10 | |
| Day Percent Change: -1.02% Day Change: -1.73 | |
| Week Change: -1.02% Year-to-date Change: -35.6% | |
| BA Links: Profile News Message Board | |
| Charts:- Daily , Weekly | |
| Add BA to Watchlist: View: Get BA Trend Analysis ➞ | |
 | GE General Electric Company |
| Sector: Industrials | |
| SubSector: Diversified Machinery | |
| MarketCap: 64710.6 Millions | |
| Recent Price: 153.70 Smart Investing & Trading Score: 50 | |
| Day Percent Change: -0.60% Day Change: -0.93 | |
| Week Change: -0.6% Year-to-date Change: 20.4% | |
| GE Links: Profile News Message Board | |
| Charts:- Daily , Weekly | |
| Add GE to Watchlist: View: Get GE Trend Analysis ➞ | |
 | CME CME Group Inc. |
| Sector: Financials | |
| SubSector: Investment Brokerage - National | |
| MarketCap: 64145 Millions | |
| Recent Price: 206.23 Smart Investing & Trading Score: 13 | |
| Day Percent Change: -1.56% Day Change: -3.27 | |
| Week Change: -1.56% Year-to-date Change: -2.1% | |
| CME Links: Profile News Message Board | |
| Charts:- Daily , Weekly | |
| Add CME to Watchlist: View: Get CME Trend Analysis ➞ | |
| For tabular summary view of above stock list: Summary View ➞ 0 - 25 , 25 - 50 , 50 - 75 , 75 - 100 , 100 - 125 , 125 - 150 , 150 - 175 , 175 - 200 , 200 - 225 , 225 - 250 , 250 - 275 , 275 - 300 , 300 - 325 , 325 - 350 , 350 - 375 , 375 - 400 , 400 - 425 , 425 - 450 , 450 - 475 , 475 - 500 | ||
| Click To Change The Sort Order: By Market Cap or Company Size Performance: Year-to-date, Week and Day | |
| Select Chart Type: | ||
|
Best Stocks Today 12Stocks.com |
© 2024 12Stocks.com Terms & Conditions Privacy Contact Us
All Information Provided Only For Education And Not To Be Used For Investing or Trading. See Terms & Conditions


One More Thing ... Get Best Stocks Delivered Daily!
Never Ever Miss A Move With Our Top Ten Stocks Lists
Find Best Stocks In Any Market - Bull or Bear Market
Take A Peek At Our Top Ten Stocks Lists: Daily, Weekly, Year-to-Date & Top Trends
Find Best Stocks In Any Market - Bull or Bear Market
Take A Peek At Our Top Ten Stocks Lists: Daily, Weekly, Year-to-Date & Top Trends
S&P 500 Stocks With Best Up Trends [0-bearish to 100-bullish]: M&T Bank[85], Lockheed Martin[85], Rockwell Automation[85], Diamondback [78], Yum! Brands[75], ProShares UltraPro[74], Progressive [68], Charles Schwab[68], Targa Resources[66], Micron [66], Eaton [66]
Best S&P 500 Stocks Year-to-Date:
NVIDIA [73.66%], Constellation [58.31%], Micron [42.22%], Meta Platforms[41.3%], NRG [41.1%], Marathon [39.54%], Western Digital[34.49%], Diamondback [32.42%], Targa Resources[31.62%], Valero [31.28%], Eaton [30.92%] Best S&P 500 Stocks This Week:
M&T Bank[4.74%], ProShares UltraPro[3.67%], Goldman Sachs[2.92%], Centene [2.81%], Cardinal Health[1.84%], Intel [1.74%], Charles Schwab[1.71%], General Mills[1.69%], Conagra Brands[1.54%], UnitedHealth [1.46%], Progressive [1.32%] Best S&P 500 Stocks Daily:
M&T Bank[4.74%], ProShares UltraPro[3.67%], Goldman Sachs[2.92%], Centene [2.81%], Cardinal Health[1.84%], Intel [1.74%], Charles Schwab[1.71%], General Mills[1.69%], Conagra Brands[1.54%], UnitedHealth [1.46%], Progressive [1.32%]