
 Login Sign Up


| |||||
 |  | ||||

| 12Stocks.com Market Intelligence |
Best S&P 500 Stocks
|
On this page, you will find the most comprehensive analysis of S&P 500 stocks and ETFs - from latest trends to performances to charts ➞. First, here are the year-to-date (YTD) performances of the most requested S&P 500 stocks at 12Stocks.com (click stock for review):
| NVIDIA 70% | ||
| Caterpillar 21% | ||
| Amazon.com 19% | ||
| Merck 15% | ||
| Walmart 14% | ||
| Google 11% | ||
| Microsoft 10% | ||
| JPMorgan Chase 6% | ||
| Chevron 5% | ||
| Goldman Sachs 5% | ||
| Johnson & Johnson -8% | ||
| McDonald s -9% | ||
| Starbucks -10% | ||
| Apple -13% | ||
| Gilead -17% | ||
| Intel -29% | ||
| Boeing -35% | ||
| Quick: S&P 500 Stocks Lists: Performances & Trends, S&P 500 Stock Charts
Sort S&P 500 stocks: Daily, Weekly, Year-to-Date, Market Cap & Trends. Filter S&P 500 stocks list by sector: Show all, Tech, Finance, Energy, Staples, Retail, Industrial, Materials, Utilities and HealthCare |
| 12Stocks.com S&P 500 Stocks Performances & Trends Daily Report | |||||||||
|
| 
The overall Smart Investing & Trading Score is 26 (0-bearish to 100-bullish) which puts S&P 500 index in short term bearish to neutral trend. The Smart Investing & Trading Score from previous trading session is 31 and a deterioration of trend continues. | ||||||||
Here are the Smart Investing & Trading Scores of the most requested S&P 500 stocks at 12Stocks.com (click stock name for detailed review):
|


| 12Stocks.com: Top Performing S&P 500 Index Stocks | ||||||||||||||||||||||||||||||||||||||||||||||||
 The top performing S&P 500 Index stocks year to date are
Now, more recently, over last week, the top performing S&P 500 Index stocks on the move are


|
||||||||||||||||||||||||||||||||||||||||||||||||
| 12Stocks.com: Investing in S&P 500 Index with Stocks | |
|
The following table helps investors and traders sort through current performance and trends (as measured by Smart Investing & Trading Score) of various
stocks in the S&P 500 Index. Quick View: Move mouse or cursor over stock symbol (ticker) to view short-term technical chart and over stock name to view long term chart. Click on  to add stock symbol to your watchlist and to add stock symbol to your watchlist and  to view watchlist. Click on any ticker or stock name for detailed market intelligence report for that stock. to view watchlist. Click on any ticker or stock name for detailed market intelligence report for that stock. |
12Stocks.com Performance of Stocks in S&P 500 Index
| Ticker | Stock Name | Watchlist | Category | Recent Price | Smart Investing & Trading Score | Change % | YTD Change% |
| TRMB | Trimble |   | Technology | 58.49 | 36 | -0.73% | 9.94% |
| FICO | Fair Isaac | | Technology | 1153.28 | 17 | 0.05% | -0.92% |
| LW | Lamb Weston | | Consumer Staples | 80.36 | 32 | -2.07% | -25.65% |
| WRK | WestRock | | Consumer Staples | 47.23 | 48 | 0.04% | 13.75% |
| IT | Gartner | | Technology | 449.31 | 0 | -1.93% | -0.40% |
| XRAY | DENTSPLY SIRONA | | Health Care | 30.36 | 0 | -1.40% | -14.70% |
| GL | Globe Life | | Financials | 63.23 | 32 | 5.44% | -48.05% |
| CPT | Camden Property | | Financials | 95.32 | 43 | 0.28% | -4.00% |
| POOL | Pool | | Consumer Staples | 364.15 | 0 | -1.58% | -8.67% |
| CNP | CenterPoint | | Utilities | 27.70 | 42 | 1.76% | -3.05% |
| HAS | Hasbro | | Consumer Staples | 54.82 | 36 | -0.38% | 7.36% |
| IRM | Iron Mountain | | Technology | 75.15 | 43 | 0.59% | 7.39% |
| VICI | VICI Properties | | Financials | 27.20 | 7 | 0.18% | -14.68% |
| RCL | Royal Caribbean | | Services & Goods | 127.97 | 38 | 1.08% | -1.17% |
| HII | Huntington Ingalls | | Industrials | 271.22 | 36 | -1.01% | 4.46% |
| MOH | Molina Healthcare | | Health Care | 359.85 | 43 | 0.69% | -0.40% |
| UHS | Universal Health | | Health Care | 160.03 | 13 | -0.85% | 4.98% |
| NDSN | Nordson | | Industrials | 260.80 | 26 | -0.71% | -1.27% |
| TECH | Bio-Techne | | Health Care | 62.73 | 10 | -2.00% | -18.70% |
| HSIC | Henry Schein | | Services & Goods | 70.20 | 0 | -1.43% | -7.28% |
| FFIV | F5 Networks | | Technology | 181.30 | 0 | -0.96% | 1.30% |
| WYNN | Wynn Resorts | | Services & Goods | 97.48 | 26 | -1.88% | 6.99% |
| NRG | NRG | | Utilities | 73.42 | 66 | -1.48% | 42.01% |
| MPWR | Monolithic Power | | Technology | 637.72 | 26 | -2.72% | 1.10% |
| CTLT | Catalent | | Health Care | 55.96 | 44 | 0.32% | 24.55% |
| For chart view version of above stock list: Chart View ➞ 0 - 25 , 25 - 50 , 50 - 75 , 75 - 100 , 100 - 125 , 125 - 150 , 150 - 175 , 175 - 200 , 200 - 225 , 225 - 250 , 250 - 275 , 275 - 300 , 300 - 325 , 325 - 350 , 350 - 375 , 375 - 400 , 400 - 425 , 425 - 450 , 450 - 475 , 475 - 500 | ||
 | Click To Change The Sort Order: By Market Cap or Company Size Performance: Year-to-date, Week and Day |  |
|
Get the most comprehensive stock market coverage daily at 12Stocks.com ➞ Best Stocks Today ➞ Best Stocks Weekly ➞ Best Stocks Year-to-Date ➞ Best Stocks Trends ➞  Best Stocks Today 12Stocks.com Best Nasdaq Stocks ➞ Best S&P 500 Stocks ➞ Best Tech Stocks ➞ Best Biotech Stocks ➞ |
| Detailed Overview of S&P 500 Stocks |
| S&P 500 Technical Overview, Leaders & Laggards, Top S&P 500 ETF Funds & Detailed S&P 500 Stocks List, Charts, Trends & More |
| S&P 500: Technical Analysis, Trends & YTD Performance | |
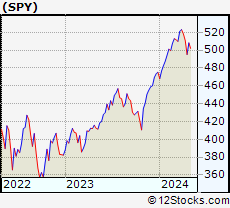
| S&P 500 index as represented by
SPY, an exchange-traded fund [ETF], holds basket of five hundred (mostly largecap) stocks from across all major sectors of the US stock market. The S&P 500 index (contains stocks like Apple and Exxon) is up by 5.31% and is currently outperforming the overall market by 0.9% year-to-date. Below is a quick view of technical charts and trends: | |
 SPY Weekly Chart |
|
| Long Term Trend: Good | |
| Medium Term Trend: Not Good | |
 SPY Daily Chart |
|
| Short Term Trend: Not Good | |
| Overall Trend Score: 26 | |
| YTD Performance: 5.31% | |
| **Trend Scores & Views Are Only For Educational Purposes And Not For Investing | |
| 12Stocks.com: Investing in S&P 500 Index using Exchange Traded Funds | |
|
The following table shows list of key exchange traded funds (ETF) that
help investors track S&P 500 index. The following list also includes leveraged ETF funds that track twice or thrice the daily returns of S&P 500 indices. Short or inverse ETF funds move in the opposite direction to the index they track and are useful during market pullbacks or during bear markets. Quick View: Move mouse or cursor over ETF symbol (ticker) to view short-term technical chart and over ETF name to view long term chart. Click on ticker or stock name for detailed view. Click on to add stock symbol to your watchlist and to view watchlist. |
12Stocks.com List of ETFs that track S&P 500 Index
| Ticker | ETF Name | Watchlist | Recent Price | Smart Investing & Trading Score | Change % | Week % | Year-to-date % |
| SPY | SPDR S&P 500 ETF | | 500.55 | 26 | -0.59 | -2.02 | 5.31% |
| IVV | iShares Core S&P 500 ETF | | 503.04 | 26 | -0.62 | -2 | 5.32% |
| VOO | Vanguard 500 ETF | | 459.99 | 26 | -0.65 | -2.04 | 5.31% |
| OEF | iShares S&P 100 | | 237.92 | 26 | -0.62 | -2.15 | 6.5% |
| SSO | ProShares Ultra S&P500 | | 70.66 | 26 | -1.24 | -4.07 | 8.59% |
| UPRO | ProShares UltraPro S&P500 | | 61.26 | 26 | -1.78 | -6.04 | 11.91% |
| SPXL | Direxion Daily S&P500 Bull 3X ETF | | 116.35 | 26 | -1.96 | -6.05 | 11.89% |
| SH | ProShares Short S&P500 | | 12.44 | 74 | 0.57 | 2.05 | -4.23% |
| SDS | ProShares UltraShort S&P500 | | 27.27 | 74 | 1.26 | 4.2 | -8.86% |
| SPXU | ProShares UltraPro Short S&P500 | | 37.07 | 74 | 1.90 | 6.34 | -13.79% |
| SPXS | Direxion Daily S&P 500 Bear 3X ETF | | 10.01 | 69 | 1.83 | 6.26 | -13.33% |
| 12Stocks.com: Charts, Trends, Fundamental Data and Performances of S&P 500 Stocks | |
|
We now take in-depth look at all S&P 500 stocks including charts, multi-period performances and overall trends (as measured by Smart Investing & Trading Score). One can sort S&P 500 stocks (click link to choose) by Daily, Weekly and by Year-to-Date performances. Also, one can sort by size of the company or by market capitalization. |
| Select Your Default Chart Type: | |||||
| |||||
| Click on stock symbol or name for detailed view. Click on to add stock symbol to your watchlist and to view watchlist. Quick View: Move mouse or cursor over "Daily" to quickly view daily technical stock chart and over "Weekly" to view weekly technical stock chart. | |||||

 | TRMB Trimble Inc. |
| Sector: Technology | |
| SubSector: Scientific & Technical Instruments | |
| MarketCap: 7990.33 Millions | |
| Recent Price: 58.49 Smart Investing & Trading Score: 36 | |
| Day Percent Change: -0.73% Day Change: -0.43 | |
| Week Change: -3.39% Year-to-date Change: 9.9% | |
| TRMB Links: Profile News Message Board | |
| Charts:- Daily , Weekly | |
| Add TRMB to Watchlist: View: Get TRMB Trend Analysis ➞ | |
 | FICO Fair Isaac Corporation |
| Sector: Technology | |
| SubSector: Business Software & Services | |
| MarketCap: 7930.98 Millions | |
| Recent Price: 1153.28 Smart Investing & Trading Score: 17 | |
| Day Percent Change: 0.05% Day Change: 0.58 | |
| Week Change: -1.9% Year-to-date Change: -0.9% | |
| FICO Links: Profile News Message Board | |
| Charts:- Daily , Weekly | |
| Add FICO to Watchlist: View: Get FICO Trend Analysis ➞ | |
 | LW Lamb Weston Holdings, Inc. |
| Sector: Consumer Staples | |
| SubSector: Food - Major Diversified | |
| MarketCap: 7844.63 Millions | |
| Recent Price: 80.36 Smart Investing & Trading Score: 32 | |
| Day Percent Change: -2.07% Day Change: -1.70 | |
| Week Change: 0.74% Year-to-date Change: -25.7% | |
| LW Links: Profile News Message Board | |
| Charts:- Daily , Weekly | |
| Add LW to Watchlist: View: Get LW Trend Analysis ➞ | |
 | WRK WestRock Company |
| Sector: Consumer Staples | |
| SubSector: Packaging & Containers | |
| MarketCap: 7835.43 Millions | |
| Recent Price: 47.23 Smart Investing & Trading Score: 48 | |
| Day Percent Change: 0.04% Day Change: 0.02 | |
| Week Change: -1.58% Year-to-date Change: 13.8% | |
| WRK Links: Profile News Message Board | |
| Charts:- Daily , Weekly | |
| Add WRK to Watchlist: View: Get WRK Trend Analysis ➞ | |
 | IT Gartner, Inc. |
| Sector: Technology | |
| SubSector: Information Technology Services | |
| MarketCap: 7767.98 Millions | |
| Recent Price: 449.31 Smart Investing & Trading Score: 0 | |
| Day Percent Change: -1.93% Day Change: -8.82 | |
| Week Change: -3.47% Year-to-date Change: -0.4% | |
| IT Links: Profile News Message Board | |
| Charts:- Daily , Weekly | |
| Add IT to Watchlist: View: Get IT Trend Analysis ➞ | |
 | XRAY DENTSPLY SIRONA Inc. |
| Sector: Health Care | |
| SubSector: Medical Instruments & Supplies | |
| MarketCap: 7746.1 Millions | |
| Recent Price: 30.36 Smart Investing & Trading Score: 0 | |
| Day Percent Change: -1.40% Day Change: -0.43 | |
| Week Change: -3% Year-to-date Change: -14.7% | |
| XRAY Links: Profile News Message Board | |
| Charts:- Daily , Weekly | |
| Add XRAY to Watchlist: View: Get XRAY Trend Analysis ➞ | |
 | GL Globe Life Inc. |
| Sector: Financials | |
| SubSector: Life Insurance | |
| MarketCap: 7596.46 Millions | |
| Recent Price: 63.23 Smart Investing & Trading Score: 32 | |
| Day Percent Change: 5.44% Day Change: 3.26 | |
| Week Change: 7.01% Year-to-date Change: -48.1% | |
| GL Links: Profile News Message Board | |
| Charts:- Daily , Weekly | |
| Add GL to Watchlist: View: Get GL Trend Analysis ➞ | |
 | CPT Camden Property Trust |
| Sector: Financials | |
| SubSector: REIT - Residential | |
| MarketCap: 7535.21 Millions | |
| Recent Price: 95.32 Smart Investing & Trading Score: 43 | |
| Day Percent Change: 0.28% Day Change: 0.27 | |
| Week Change: -2.68% Year-to-date Change: -4.0% | |
| CPT Links: Profile News Message Board | |
| Charts:- Daily , Weekly | |
| Add CPT to Watchlist: View: Get CPT Trend Analysis ➞ | |
 | POOL Pool Corporation |
| Sector: Consumer Staples | |
| SubSector: Sporting Goods | |
| MarketCap: 7479.64 Millions | |
| Recent Price: 364.15 Smart Investing & Trading Score: 0 | |
| Day Percent Change: -1.58% Day Change: -5.83 | |
| Week Change: -4.22% Year-to-date Change: -8.7% | |
| POOL Links: Profile News Message Board | |
| Charts:- Daily , Weekly | |
| Add POOL to Watchlist: View: Get POOL Trend Analysis ➞ | |
 | CNP CenterPoint Energy, Inc. |
| Sector: Utilities | |
| SubSector: Gas Utilities | |
| MarketCap: 7444.07 Millions | |
| Recent Price: 27.70 Smart Investing & Trading Score: 42 | |
| Day Percent Change: 1.76% Day Change: 0.48 | |
| Week Change: 0.87% Year-to-date Change: -3.1% | |
| CNP Links: Profile News Message Board | |
| Charts:- Daily , Weekly | |
| Add CNP to Watchlist: View: Get CNP Trend Analysis ➞ | |
 | HAS Hasbro, Inc. |
| Sector: Consumer Staples | |
| SubSector: Toys & Games | |
| MarketCap: 7389.5 Millions | |
| Recent Price: 54.82 Smart Investing & Trading Score: 36 | |
| Day Percent Change: -0.38% Day Change: -0.21 | |
| Week Change: -1.76% Year-to-date Change: 7.4% | |
| HAS Links: Profile News Message Board | |
| Charts:- Daily , Weekly | |
| Add HAS to Watchlist: View: Get HAS Trend Analysis ➞ | |
 | IRM Iron Mountain Incorporated |
| Sector: Technology | |
| SubSector: Business Software & Services | |
| MarketCap: 7339.18 Millions | |
| Recent Price: 75.15 Smart Investing & Trading Score: 43 | |
| Day Percent Change: 0.59% Day Change: 0.44 | |
| Week Change: -1.14% Year-to-date Change: 7.4% | |
| IRM Links: Profile News Message Board | |
| Charts:- Daily , Weekly | |
| Add IRM to Watchlist: View: Get IRM Trend Analysis ➞ | |
 | VICI VICI Properties Inc. |
| Sector: Financials | |
| SubSector: REIT - Diversified | |
| MarketCap: 7327.03 Millions | |
| Recent Price: 27.20 Smart Investing & Trading Score: 7 | |
| Day Percent Change: 0.18% Day Change: 0.05 | |
| Week Change: -2.65% Year-to-date Change: -14.7% | |
| VICI Links: Profile News Message Board | |
| Charts:- Daily , Weekly | |
| Add VICI to Watchlist: View: Get VICI Trend Analysis ➞ | |
 | RCL Royal Caribbean Cruises Ltd. |
| Sector: Services & Goods | |
| SubSector: Resorts & Casinos | |
| MarketCap: 7294.14 Millions | |
| Recent Price: 127.97 Smart Investing & Trading Score: 38 | |
| Day Percent Change: 1.08% Day Change: 1.37 | |
| Week Change: 0.23% Year-to-date Change: -1.2% | |
| RCL Links: Profile News Message Board | |
| Charts:- Daily , Weekly | |
| Add RCL to Watchlist: View: Get RCL Trend Analysis ➞ | |
 | HII Huntington Ingalls Industries, Inc. |
| Sector: Industrials | |
| SubSector: Aerospace/Defense Products & Services | |
| MarketCap: 7276.11 Millions | |
| Recent Price: 271.22 Smart Investing & Trading Score: 36 | |
| Day Percent Change: -1.01% Day Change: -2.78 | |
| Week Change: -1.63% Year-to-date Change: 4.5% | |
| HII Links: Profile News Message Board | |
| Charts:- Daily , Weekly | |
| Add HII to Watchlist: View: Get HII Trend Analysis ➞ | |
 | MOH Molina Healthcare, Inc. |
| Sector: Health Care | |
| SubSector: Health Care Plans | |
| MarketCap: 7235.6 Millions | |
| Recent Price: 359.85 Smart Investing & Trading Score: 43 | |
| Day Percent Change: 0.69% Day Change: 2.46 | |
| Week Change: -4.44% Year-to-date Change: -0.4% | |
| MOH Links: Profile News Message Board | |
| Charts:- Daily , Weekly | |
| Add MOH to Watchlist: View: Get MOH Trend Analysis ➞ | |
 | UHS Universal Health Services, Inc. |
| Sector: Health Care | |
| SubSector: Hospitals | |
| MarketCap: 7217.66 Millions | |
| Recent Price: 160.03 Smart Investing & Trading Score: 13 | |
| Day Percent Change: -0.85% Day Change: -1.38 | |
| Week Change: -4.05% Year-to-date Change: 5.0% | |
| UHS Links: Profile News Message Board | |
| Charts:- Daily , Weekly | |
| Add UHS to Watchlist: View: Get UHS Trend Analysis ➞ | |
 | NDSN Nordson Corporation |
| Sector: Industrials | |
| SubSector: Diversified Machinery | |
| MarketCap: 7117.56 Millions | |
| Recent Price: 260.80 Smart Investing & Trading Score: 26 | |
| Day Percent Change: -0.71% Day Change: -1.86 | |
| Week Change: -1.45% Year-to-date Change: -1.3% | |
| NDSN Links: Profile News Message Board | |
| Charts:- Daily , Weekly | |
| Add NDSN to Watchlist: View: Get NDSN Trend Analysis ➞ | |
 | TECH Bio-Techne Corporation |
| Sector: Health Care | |
| SubSector: Biotechnology | |
| MarketCap: 6958.05 Millions | |
| Recent Price: 62.73 Smart Investing & Trading Score: 10 | |
| Day Percent Change: -2.00% Day Change: -1.28 | |
| Week Change: -5.99% Year-to-date Change: -18.7% | |
| TECH Links: Profile News Message Board | |
| Charts:- Daily , Weekly | |
| Add TECH to Watchlist: View: Get TECH Trend Analysis ➞ | |
 | HSIC Henry Schein, Inc. |
| Sector: Services & Goods | |
| SubSector: Medical Equipment Wholesale | |
| MarketCap: 6760.9 Millions | |
| Recent Price: 70.20 Smart Investing & Trading Score: 0 | |
| Day Percent Change: -1.43% Day Change: -1.02 | |
| Week Change: -1.14% Year-to-date Change: -7.3% | |
| HSIC Links: Profile News Message Board | |
| Charts:- Daily , Weekly | |
| Add HSIC to Watchlist: View: Get HSIC Trend Analysis ➞ | |
 | FFIV F5 Networks, Inc. |
| Sector: Technology | |
| SubSector: Business Software & Services | |
| MarketCap: 6675.38 Millions | |
| Recent Price: 181.30 Smart Investing & Trading Score: 0 | |
| Day Percent Change: -0.96% Day Change: -1.76 | |
| Week Change: -5.62% Year-to-date Change: 1.3% | |
| FFIV Links: Profile News Message Board | |
| Charts:- Daily , Weekly | |
| Add FFIV to Watchlist: View: Get FFIV Trend Analysis ➞ | |
 | WYNN Wynn Resorts, Limited |
| Sector: Services & Goods | |
| SubSector: Resorts & Casinos | |
| MarketCap: 6643.34 Millions | |
| Recent Price: 97.48 Smart Investing & Trading Score: 26 | |
| Day Percent Change: -1.88% Day Change: -1.87 | |
| Week Change: -3.66% Year-to-date Change: 7.0% | |
| WYNN Links: Profile News Message Board | |
| Charts:- Daily , Weekly | |
| Add WYNN to Watchlist: View: Get WYNN Trend Analysis ➞ | |
 | NRG NRG Energy, Inc. |
| Sector: Utilities | |
| SubSector: Diversified Utilities | |
| MarketCap: 6510.7 Millions | |
| Recent Price: 73.42 Smart Investing & Trading Score: 66 | |
| Day Percent Change: -1.48% Day Change: -1.10 | |
| Week Change: -0.69% Year-to-date Change: 42.0% | |
| NRG Links: Profile News Message Board | |
| Charts:- Daily , Weekly | |
| Add NRG to Watchlist: View: Get NRG Trend Analysis ➞ | |
 | MPWR Monolithic Power Systems, Inc. |
| Sector: Technology | |
| SubSector: Semiconductor - Specialized | |
| MarketCap: 6436.4 Millions | |
| Recent Price: 637.72 Smart Investing & Trading Score: 26 | |
| Day Percent Change: -2.72% Day Change: -17.81 | |
| Week Change: -3.12% Year-to-date Change: 1.1% | |
| MPWR Links: Profile News Message Board | |
| Charts:- Daily , Weekly | |
| Add MPWR to Watchlist: View: Get MPWR Trend Analysis ➞ | |
 | CTLT Catalent, Inc. |
| Sector: Health Care | |
| SubSector: Drugs - Generic | |
| MarketCap: 6351.95 Millions | |
| Recent Price: 55.96 Smart Investing & Trading Score: 44 | |
| Day Percent Change: 0.32% Day Change: 0.18 | |
| Week Change: -0.6% Year-to-date Change: 24.6% | |
| CTLT Links: Profile News Message Board | |
| Charts:- Daily , Weekly | |
| Add CTLT to Watchlist: View: Get CTLT Trend Analysis ➞ | |
| For tabular summary view of above stock list: Summary View ➞ 0 - 25 , 25 - 50 , 50 - 75 , 75 - 100 , 100 - 125 , 125 - 150 , 150 - 175 , 175 - 200 , 200 - 225 , 225 - 250 , 250 - 275 , 275 - 300 , 300 - 325 , 325 - 350 , 350 - 375 , 375 - 400 , 400 - 425 , 425 - 450 , 450 - 475 , 475 - 500 | ||
| Click To Change The Sort Order: By Market Cap or Company Size Performance: Year-to-date, Week and Day | |
| Select Chart Type: | ||
|
Best Stocks Today 12Stocks.com |
© 2024 12Stocks.com Terms & Conditions Privacy Contact Us
All Information Provided Only For Education And Not To Be Used For Investing or Trading. See Terms & Conditions


One More Thing ... Get Best Stocks Delivered Daily!
Never Ever Miss A Move With Our Top Ten Stocks Lists
Find Best Stocks In Any Market - Bull or Bear Market
Take A Peek At Our Top Ten Stocks Lists: Daily, Weekly, Year-to-Date & Top Trends
Find Best Stocks In Any Market - Bull or Bear Market
Take A Peek At Our Top Ten Stocks Lists: Daily, Weekly, Year-to-Date & Top Trends
S&P 500 Stocks With Best Up Trends [0-bearish to 100-bullish]: United Airlines[100], Conagra Brands[95], Bunge [93], Charles Schwab[88], Lockheed Martin[86], Progressive [83], NextEra [81], Newmont [76], Google [75], Google [75], Yum! Brands[75]
Best S&P 500 Stocks Year-to-Date:
NVIDIA [69.69%], Constellation [58.3%], NRG [42.01%], Meta Platforms[39.59%], Marathon [36.47%], Micron [36.31%], Western Digital[33.99%], Progressive [31.29%], Diamondback [29.71%], Targa Resources[29.19%], Eaton [28.8%] Best S&P 500 Stocks This Week:
United Airlines[16.6%], UnitedHealth [9.06%], Globe Life[7.01%], ProShares UltraPro[6.34%], American Airlines[5.63%], Morgan Stanley[4.51%], Southwest Airlines[4.5%], Goldman Sachs[3.7%], Charles Schwab[3.53%], General Mills[3.49%], Humana [3.48%] Best S&P 500 Stocks Daily:
United Airlines[17.45%], American Airlines[6.60%], Globe Life[5.44%], NextEra [3.39%], Consolidated Edison[3.33%], Norwegian Cruise[3.15%], Dominion [3.12%], Southern [3.00%], Delta Air[2.86%], First Solar[2.85%], Southwest Airlines[2.60%]