
 Login Sign Up


| |||||
 |  | ||||

| 12Stocks.com Market Intelligence |
Best S&P 500 Stocks
|
On this page, you will find the most comprehensive analysis of S&P 500 stocks and ETFs - from latest trends to performances to charts ➞. First, here are the year-to-date (YTD) performances of the most requested S&P 500 stocks at 12Stocks.com (click stock for review):
| NVIDIA 64% | ||
| Caterpillar 22% | ||
| Merck 17% | ||
| Amazon.com 17% | ||
| Walmart 13% | ||
| Google 13% | ||
| JPMorgan Chase 12% | ||
| Goldman Sachs 8% | ||
| Chevron 8% | ||
| Microsoft 8% | ||
| Johnson & Johnson -5% | ||
| McDonald s -7% | ||
| Starbucks -9% | ||
| Apple -14% | ||
| Gilead -17% | ||
| Intel -31% | ||
| Boeing -35% | ||
| Quick: S&P 500 Stocks Lists: Performances & Trends, S&P 500 Stock Charts
Sort S&P 500 stocks: Daily, Weekly, Year-to-Date, Market Cap & Trends. Filter S&P 500 stocks list by sector: Show all, Tech, Finance, Energy, Staples, Retail, Industrial, Materials, Utilities and HealthCare |
| 12Stocks.com S&P 500 Stocks Performances & Trends Daily Report | |||||||||
|
| 
The overall Smart Investing & Trading Score is 51 (0-bearish to 100-bullish) which puts S&P 500 index in short term neutral trend. The Smart Investing & Trading Score from previous trading session is 26 and an improvement of trend continues. | ||||||||
Here are the Smart Investing & Trading Scores of the most requested S&P 500 stocks at 12Stocks.com (click stock name for detailed review):
|


| 12Stocks.com: Top Performing S&P 500 Index Stocks | ||||||||||||||||||||||||||||||||||||||||||||||||
 The top performing S&P 500 Index stocks year to date are
Now, more recently, over last week, the top performing S&P 500 Index stocks on the move are


|
||||||||||||||||||||||||||||||||||||||||||||||||
| 12Stocks.com: Investing in S&P 500 Index with Stocks | |
|
The following table helps investors and traders sort through current performance and trends (as measured by Smart Investing & Trading Score) of various
stocks in the S&P 500 Index. Quick View: Move mouse or cursor over stock symbol (ticker) to view short-term technical chart and over stock name to view long term chart. Click on  to add stock symbol to your watchlist and to add stock symbol to your watchlist and  to view watchlist. Click on any ticker or stock name for detailed market intelligence report for that stock. to view watchlist. Click on any ticker or stock name for detailed market intelligence report for that stock. |
12Stocks.com Performance of Stocks in S&P 500 Index
| Ticker | Stock Name | Watchlist | Category | Recent Price | Smart Investing & Trading Score | Change % | YTD Change% |
| MNST | Monster Beverage |   | Consumer Staples | 53.28 | 25 | -0.59% | -7.51% |
| ETN | Eaton | | Industrials | 312.93 | 68 | 1.57% | 29.94% |
| BK | Bank of New York | | Financials | 57.22 | 95 | 0.10% | 9.92% |
| CEG | Constellation | | Utilities | 186.76 | 61 | 1.93% | 59.47% |
| HCA | HCA Healthcare | | Health Care | 316.21 | 63 | 1.90% | 16.82% |
| GM | General Motors | | Consumer Staples | 45.20 | 95 | 4.61% | 25.84% |
| CNC | Centene | | Health Care | 76.16 | 82 | 0.77% | 2.63% |
| XEL | Xcel | | Utilities | 55.18 | 74 | 0.40% | -10.87% |
| HSY | Hershey | | Consumer Staples | 187.59 | 49 | 0.68% | 0.62% |
| STZ | Constellation Brands | | Consumer Staples | 261.07 | 61 | 0.51% | 7.99% |
| EA | Electronic Arts | | Technology | 127.53 | 42 | 0.32% | -6.78% |
| DLR | Digital Realty | | Financials | 136.60 | 18 | 0.54% | 1.50% |
| KR | Kroger Co | | Services & Goods | 57.06 | 83 | 0.23% | 24.83% |
| SBAC | SBA | | Technology | 197.63 | 42 | 0.42% | -22.10% |
| MSI | Motorola Solutions | | Technology | 345.74 | 70 | 0.15% | 10.43% |
| MET | MetLife | | Financials | 72.33 | 75 | 0.51% | 9.38% |
| CTSH | Cognizant | | Technology | 67.84 | 42 | -0.53% | -10.18% |
| RSG | Republic Services | | Industrials | 192.37 | 90 | 0.32% | 16.65% |
| ALL | Allstate | | Financials | 175.76 | 100 | 0.20% | 25.56% |
| MAR | Marriott | | Services & Goods | 238.13 | 38 | 0.30% | 5.60% |
| DD | DuPont de | | Materials | 73.77 | 54 | -0.19% | -4.11% |
| HRL | Hormel Foods | | Consumer Staples | 35.29 | 95 | 0.43% | 9.90% |
| PSX | Phillips 66 | | Energy | 156.44 | 68 | -0.39% | 17.50% |
| TRV | Travelers | | Financials | 214.71 | 63 | 0.20% | 12.71% |
| ED | Consolidated Edison | | Utilities | 93.16 | 100 | 0.46% | 2.41% |
| For chart view version of above stock list: Chart View ➞ 0 - 25 , 25 - 50 , 50 - 75 , 75 - 100 , 100 - 125 , 125 - 150 , 150 - 175 , 175 - 200 , 200 - 225 , 225 - 250 , 250 - 275 , 275 - 300 , 300 - 325 , 325 - 350 , 350 - 375 , 375 - 400 , 400 - 425 , 425 - 450 , 450 - 475 | ||
 | Click To Change The Sort Order: By Market Cap or Company Size Performance: Year-to-date, Week and Day |  |
|
Get the most comprehensive stock market coverage daily at 12Stocks.com ➞ Best Stocks Today ➞ Best Stocks Weekly ➞ Best Stocks Year-to-Date ➞ Best Stocks Trends ➞  Best Stocks Today 12Stocks.com Best Nasdaq Stocks ➞ Best S&P 500 Stocks ➞ Best Tech Stocks ➞ Best Biotech Stocks ➞ |
| Detailed Overview of S&P 500 Stocks |
| S&P 500 Technical Overview, Leaders & Laggards, Top S&P 500 ETF Funds & Detailed S&P 500 Stocks List, Charts, Trends & More |
| S&P 500: Technical Analysis, Trends & YTD Performance | |
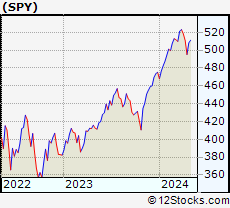
| S&P 500 index as represented by
SPY, an exchange-traded fund [ETF], holds basket of five hundred (mostly largecap) stocks from across all major sectors of the US stock market. The S&P 500 index (contains stocks like Apple and Exxon) is up by 5.82% and is currently outperforming the overall market by 0.68% year-to-date. Below is a quick view of technical charts and trends: | |
 SPY Weekly Chart |
|
| Long Term Trend: Good | |
| Medium Term Trend: Not Good | |
 SPY Daily Chart |
|
| Short Term Trend: Very Good | |
| Overall Trend Score: 51 | |
| YTD Performance: 5.82% | |
| **Trend Scores & Views Are Only For Educational Purposes And Not For Investing | |
| 12Stocks.com: Investing in S&P 500 Index using Exchange Traded Funds | |
|
The following table shows list of key exchange traded funds (ETF) that
help investors track S&P 500 index. The following list also includes leveraged ETF funds that track twice or thrice the daily returns of S&P 500 indices. Short or inverse ETF funds move in the opposite direction to the index they track and are useful during market pullbacks or during bear markets. Quick View: Move mouse or cursor over ETF symbol (ticker) to view short-term technical chart and over ETF name to view long term chart. Click on ticker or stock name for detailed view. Click on to add stock symbol to your watchlist and to view watchlist. |
12Stocks.com List of ETFs that track S&P 500 Index
| Ticker | ETF Name | Watchlist | Recent Price | Smart Investing & Trading Score | Change % | Week % | Year-to-date % |
| SPY | SPDR S&P 500 ETF | | 502.95 | 51 | 0.65 | 1.57 | 5.82% |
| IVV | iShares Core S&P 500 ETF | | 505.54 | 43 | 1.48 | 1.61 | 5.84% |
| VOO | Vanguard 500 ETF | | 462.32 | 43 | 1.47 | 1.59 | 5.84% |
| OEF | iShares S&P 100 | | 238.64 | 51 | 0.77 | 1.69 | 6.83% |
| SSO | ProShares Ultra S&P500 | | 71.32 | 58 | 1.41 | 3.2 | 9.61% |
| UPRO | ProShares UltraPro S&P500 | | 62.04 | 58 | 2.12 | 4.87 | 13.34% |
| SPXL | Direxion Daily S&P500 Bull 3X ETF | | 117.75 | 43 | 1.99 | 4.62 | 13.23% |
| SH | ProShares Short S&P500 | | 12.40 | 50 | -0.72 | -1.51 | -4.54% |
| SDS | ProShares UltraShort S&P500 | | 26.98 | 42 | -1.55 | -3.28 | -9.81% |
| SPXU | ProShares UltraPro Short S&P500 | | 36.48 | 42 | -2.30 | -4.83 | -15.16% |
| SPXS | Direxion Daily S&P 500 Bear 3X ETF | | 9.89 | 57 | -4.07 | -4.54 | -14.37% |
| 12Stocks.com: Charts, Trends, Fundamental Data and Performances of S&P 500 Stocks | |
|
We now take in-depth look at all S&P 500 stocks including charts, multi-period performances and overall trends (as measured by Smart Investing & Trading Score). One can sort S&P 500 stocks (click link to choose) by Daily, Weekly and by Year-to-Date performances. Also, one can sort by size of the company or by market capitalization. |
| Select Your Default Chart Type: | |||||
| |||||
| Click on stock symbol or name for detailed view. Click on to add stock symbol to your watchlist and to view watchlist. Quick View: Move mouse or cursor over "Daily" to quickly view daily technical stock chart and over "Weekly" to view weekly technical stock chart. | |||||

 | MNST Monster Beverage Corporation |
| Sector: Consumer Staples | |
| SubSector: Beverages - Soft Drinks | |
| MarketCap: 30126.8 Millions | |
| Recent Price: 53.28 Smart Investing & Trading Score: 25 | |
| Day Percent Change: -0.59% Day Change: -0.32 | |
| Week Change: 0.27% Year-to-date Change: -7.5% | |
| MNST Links: Profile News Message Board | |
| Charts:- Daily , Weekly | |
| Add MNST to Watchlist: View: Get MNST Trend Analysis ➞ | |
 | ETN Eaton Corporation plc |
| Sector: Industrials | |
| SubSector: Diversified Machinery | |
| MarketCap: 29829.4 Millions | |
| Recent Price: 312.93 Smart Investing & Trading Score: 68 | |
| Day Percent Change: 1.57% Day Change: 4.84 | |
| Week Change: 3.27% Year-to-date Change: 29.9% | |
| ETN Links: Profile News Message Board | |
| Charts:- Daily , Weekly | |
| Add ETN to Watchlist: View: Get ETN Trend Analysis ➞ | |
 | BK The Bank of New York Mellon Corporation |
| Sector: Financials | |
| SubSector: Asset Management | |
| MarketCap: 29807.5 Millions | |
| Recent Price: 57.22 Smart Investing & Trading Score: 95 | |
| Day Percent Change: 0.10% Day Change: 0.06 | |
| Week Change: 1.64% Year-to-date Change: 9.9% | |
| BK Links: Profile News Message Board | |
| Charts:- Daily , Weekly | |
| Add BK to Watchlist: View: Get BK Trend Analysis ➞ | |
 | CEG Constellation Energy Corporation |
| Sector: Utilities | |
| SubSector: Utilities - Renewable | |
| MarketCap: 29600 Millions | |
| Recent Price: 186.76 Smart Investing & Trading Score: 61 | |
| Day Percent Change: 1.93% Day Change: 3.54 | |
| Week Change: 3.24% Year-to-date Change: 59.5% | |
| CEG Links: Profile News Message Board | |
| Charts:- Daily , Weekly | |
| Add CEG to Watchlist: View: Get CEG Trend Analysis ➞ | |
 | HCA HCA Healthcare, Inc. |
| Sector: Health Care | |
| SubSector: Hospitals | |
| MarketCap: 29466.6 Millions | |
| Recent Price: 316.21 Smart Investing & Trading Score: 63 | |
| Day Percent Change: 1.90% Day Change: 5.90 | |
| Week Change: 3.64% Year-to-date Change: 16.8% | |
| HCA Links: Profile News Message Board | |
| Charts:- Daily , Weekly | |
| Add HCA to Watchlist: View: Get HCA Trend Analysis ➞ | |
 | GM General Motors Company |
| Sector: Consumer Staples | |
| SubSector: Auto Manufacturers - Major | |
| MarketCap: 29252.4 Millions | |
| Recent Price: 45.20 Smart Investing & Trading Score: 95 | |
| Day Percent Change: 4.61% Day Change: 1.99 | |
| Week Change: 6.68% Year-to-date Change: 25.8% | |
| GM Links: Profile News Message Board | |
| Charts:- Daily , Weekly | |
| Add GM to Watchlist: View: Get GM Trend Analysis ➞ | |
 | CNC Centene Corporation |
| Sector: Health Care | |
| SubSector: Health Care Plans | |
| MarketCap: 29075 Millions | |
| Recent Price: 76.16 Smart Investing & Trading Score: 82 | |
| Day Percent Change: 0.77% Day Change: 0.58 | |
| Week Change: 1.34% Year-to-date Change: 2.6% | |
| CNC Links: Profile News Message Board | |
| Charts:- Daily , Weekly | |
| Add CNC to Watchlist: View: Get CNC Trend Analysis ➞ | |
 | XEL Xcel Energy Inc. |
| Sector: Utilities | |
| SubSector: Electric Utilities | |
| MarketCap: 28960.8 Millions | |
| Recent Price: 55.18 Smart Investing & Trading Score: 74 | |
| Day Percent Change: 0.40% Day Change: 0.22 | |
| Week Change: 0.84% Year-to-date Change: -10.9% | |
| XEL Links: Profile News Message Board | |
| Charts:- Daily , Weekly | |
| Add XEL to Watchlist: View: Get XEL Trend Analysis ➞ | |
 | HSY The Hershey Company |
| Sector: Consumer Staples | |
| SubSector: Confectioners | |
| MarketCap: 27648.8 Millions | |
| Recent Price: 187.59 Smart Investing & Trading Score: 49 | |
| Day Percent Change: 0.68% Day Change: 1.26 | |
| Week Change: 1.39% Year-to-date Change: 0.6% | |
| HSY Links: Profile News Message Board | |
| Charts:- Daily , Weekly | |
| Add HSY to Watchlist: View: Get HSY Trend Analysis ➞ | |
 | STZ Constellation Brands, Inc. |
| Sector: Consumer Staples | |
| SubSector: Beverages - Wineries & Distillers | |
| MarketCap: 27394.5 Millions | |
| Recent Price: 261.07 Smart Investing & Trading Score: 61 | |
| Day Percent Change: 0.51% Day Change: 1.33 | |
| Week Change: 0.14% Year-to-date Change: 8.0% | |
| STZ Links: Profile News Message Board | |
| Charts:- Daily , Weekly | |
| Add STZ to Watchlist: View: Get STZ Trend Analysis ➞ | |
 | EA Electronic Arts Inc. |
| Sector: Technology | |
| SubSector: Multimedia & Graphics Software | |
| MarketCap: 27296.5 Millions | |
| Recent Price: 127.53 Smart Investing & Trading Score: 42 | |
| Day Percent Change: 0.32% Day Change: 0.41 | |
| Week Change: 0.2% Year-to-date Change: -6.8% | |
| EA Links: Profile News Message Board | |
| Charts:- Daily , Weekly | |
| Add EA to Watchlist: View: Get EA Trend Analysis ➞ | |
 | DLR Digital Realty Trust, Inc. |
| Sector: Financials | |
| SubSector: REIT - Office | |
| MarketCap: 27038.6 Millions | |
| Recent Price: 136.60 Smart Investing & Trading Score: 18 | |
| Day Percent Change: 0.54% Day Change: 0.74 | |
| Week Change: -0.17% Year-to-date Change: 1.5% | |
| DLR Links: Profile News Message Board | |
| Charts:- Daily , Weekly | |
| Add DLR to Watchlist: View: Get DLR Trend Analysis ➞ | |
 | KR The Kroger Co. |
| Sector: Services & Goods | |
| SubSector: Grocery Stores | |
| MarketCap: 26718.5 Millions | |
| Recent Price: 57.06 Smart Investing & Trading Score: 83 | |
| Day Percent Change: 0.23% Day Change: 0.13 | |
| Week Change: 0.87% Year-to-date Change: 24.8% | |
| KR Links: Profile News Message Board | |
| Charts:- Daily , Weekly | |
| Add KR to Watchlist: View: Get KR Trend Analysis ➞ | |
 | SBAC SBA Communications Corporation |
| Sector: Technology | |
| SubSector: Diversified Communication Services | |
| MarketCap: 26712.3 Millions | |
| Recent Price: 197.63 Smart Investing & Trading Score: 42 | |
| Day Percent Change: 0.42% Day Change: 0.83 | |
| Week Change: 0.8% Year-to-date Change: -22.1% | |
| SBAC Links: Profile News Message Board | |
| Charts:- Daily , Weekly | |
| Add SBAC to Watchlist: View: Get SBAC Trend Analysis ➞ | |
 | MSI Motorola Solutions, Inc. |
| Sector: Technology | |
| SubSector: Communication Equipment | |
| MarketCap: 26573.3 Millions | |
| Recent Price: 345.74 Smart Investing & Trading Score: 70 | |
| Day Percent Change: 0.15% Day Change: 0.50 | |
| Week Change: 1.79% Year-to-date Change: 10.4% | |
| MSI Links: Profile News Message Board | |
| Charts:- Daily , Weekly | |
| Add MSI to Watchlist: View: Get MSI Trend Analysis ➞ | |
 | MET MetLife, Inc. |
| Sector: Financials | |
| SubSector: Life Insurance | |
| MarketCap: 26272.9 Millions | |
| Recent Price: 72.33 Smart Investing & Trading Score: 75 | |
| Day Percent Change: 0.51% Day Change: 0.37 | |
| Week Change: 1.72% Year-to-date Change: 9.4% | |
| MET Links: Profile News Message Board | |
| Charts:- Daily , Weekly | |
| Add MET to Watchlist: View: Get MET Trend Analysis ➞ | |
 | CTSH Cognizant Technology Solutions Corporation |
| Sector: Technology | |
| SubSector: Information Technology Services | |
| MarketCap: 26249.7 Millions | |
| Recent Price: 67.84 Smart Investing & Trading Score: 42 | |
| Day Percent Change: -0.53% Day Change: -0.36 | |
| Week Change: 0.59% Year-to-date Change: -10.2% | |
| CTSH Links: Profile News Message Board | |
| Charts:- Daily , Weekly | |
| Add CTSH to Watchlist: View: Get CTSH Trend Analysis ➞ | |
 | RSG Republic Services, Inc. |
| Sector: Industrials | |
| SubSector: Waste Management | |
| MarketCap: 26178.6 Millions | |
| Recent Price: 192.37 Smart Investing & Trading Score: 90 | |
| Day Percent Change: 0.32% Day Change: 0.61 | |
| Week Change: 1.38% Year-to-date Change: 16.7% | |
| RSG Links: Profile News Message Board | |
| Charts:- Daily , Weekly | |
| Add RSG to Watchlist: View: Get RSG Trend Analysis ➞ | |
 | ALL The Allstate Corporation |
| Sector: Financials | |
| SubSector: Property & Casualty Insurance | |
| MarketCap: 25916.6 Millions | |
| Recent Price: 175.76 Smart Investing & Trading Score: 100 | |
| Day Percent Change: 0.20% Day Change: 0.35 | |
| Week Change: 1.62% Year-to-date Change: 25.6% | |
| ALL Links: Profile News Message Board | |
| Charts:- Daily , Weekly | |
| Add ALL to Watchlist: View: Get ALL Trend Analysis ➞ | |
 | MAR Marriott International, Inc. |
| Sector: Services & Goods | |
| SubSector: Lodging | |
| MarketCap: 25831.6 Millions | |
| Recent Price: 238.13 Smart Investing & Trading Score: 38 | |
| Day Percent Change: 0.30% Day Change: 0.72 | |
| Week Change: 0.9% Year-to-date Change: 5.6% | |
| MAR Links: Profile News Message Board | |
| Charts:- Daily , Weekly | |
| Add MAR to Watchlist: View: Get MAR Trend Analysis ➞ | |
 | DD DuPont de Nemours, Inc. |
| Sector: Materials | |
| SubSector: Agricultural Chemicals | |
| MarketCap: 25631.6 Millions | |
| Recent Price: 73.77 Smart Investing & Trading Score: 54 | |
| Day Percent Change: -0.19% Day Change: -0.14 | |
| Week Change: -0.16% Year-to-date Change: -4.1% | |
| DD Links: Profile News Message Board | |
| Charts:- Daily , Weekly | |
| Add DD to Watchlist: View: Get DD Trend Analysis ➞ | |
 | HRL Hormel Foods Corporation |
| Sector: Consumer Staples | |
| SubSector: Meat Products | |
| MarketCap: 25590.2 Millions | |
| Recent Price: 35.29 Smart Investing & Trading Score: 95 | |
| Day Percent Change: 0.43% Day Change: 0.15 | |
| Week Change: 1.58% Year-to-date Change: 9.9% | |
| HRL Links: Profile News Message Board | |
| Charts:- Daily , Weekly | |
| Add HRL to Watchlist: View: Get HRL Trend Analysis ➞ | |
 | PSX Phillips 66 |
| Sector: Energy | |
| SubSector: Oil & Gas Refining & Marketing | |
| MarketCap: 25253.6 Millions | |
| Recent Price: 156.44 Smart Investing & Trading Score: 68 | |
| Day Percent Change: -0.39% Day Change: -0.62 | |
| Week Change: 1.11% Year-to-date Change: 17.5% | |
| PSX Links: Profile News Message Board | |
| Charts:- Daily , Weekly | |
| Add PSX to Watchlist: View: Get PSX Trend Analysis ➞ | |
 | TRV The Travelers Companies, Inc. |
| Sector: Financials | |
| SubSector: Property & Casualty Insurance | |
| MarketCap: 25155.9 Millions | |
| Recent Price: 214.71 Smart Investing & Trading Score: 63 | |
| Day Percent Change: 0.20% Day Change: 0.44 | |
| Week Change: 0.3% Year-to-date Change: 12.7% | |
| TRV Links: Profile News Message Board | |
| Charts:- Daily , Weekly | |
| Add TRV to Watchlist: View: Get TRV Trend Analysis ➞ | |
 | ED Consolidated Edison, Inc. |
| Sector: Utilities | |
| SubSector: Electric Utilities | |
| MarketCap: 25012.3 Millions | |
| Recent Price: 93.16 Smart Investing & Trading Score: 100 | |
| Day Percent Change: 0.46% Day Change: 0.43 | |
| Week Change: 1.51% Year-to-date Change: 2.4% | |
| ED Links: Profile News Message Board | |
| Charts:- Daily , Weekly | |
| Add ED to Watchlist: View: Get ED Trend Analysis ➞ | |
| For tabular summary view of above stock list: Summary View ➞ 0 - 25 , 25 - 50 , 50 - 75 , 75 - 100 , 100 - 125 , 125 - 150 , 150 - 175 , 175 - 200 , 200 - 225 , 225 - 250 , 250 - 275 , 275 - 300 , 300 - 325 , 325 - 350 , 350 - 375 , 375 - 400 , 400 - 425 , 425 - 450 , 450 - 475 | ||
| Click To Change The Sort Order: By Market Cap or Company Size Performance: Year-to-date, Week and Day | |
| Select Chart Type: | ||
|
Best Stocks Today 12Stocks.com |
© 2024 12Stocks.com Terms & Conditions Privacy Contact Us
All Information Provided Only For Education And Not To Be Used For Investing or Trading. See Terms & Conditions


One More Thing ... Get Best Stocks Delivered Daily!
Never Ever Miss A Move With Our Top Ten Stocks Lists
Find Best Stocks In Any Market - Bull or Bear Market
Take A Peek At Our Top Ten Stocks Lists: Daily, Weekly, Year-to-Date & Top Trends
Find Best Stocks In Any Market - Bull or Bear Market
Take A Peek At Our Top Ten Stocks Lists: Daily, Weekly, Year-to-Date & Top Trends
S&P 500 Stocks With Best Up Trends [0-bearish to 100-bullish]: Danaher [100], Kimberly-Clark [100], Quest Diagnostics[100], Philip Morris[100], NextEra [100], Equity Residential[100], Bank of America[100], American Express[100], UDR [100], Essex Property[100], Lockheed Martin[100]
Best S&P 500 Stocks Year-to-Date:
NVIDIA [63.52%], Constellation [59.47%], NRG [39.04%], Meta Platforms[38.84%], Progressive [34.23%], Marathon [32.86%], Western Digital[31.12%], Targa Resources[31.12%], Micron [30.88%], United Airlines[30.55%], Eaton [29.94%] Best S&P 500 Stocks This Week:
Enphase [7.86%], Danaher [7.07%], Kimberly-Clark [7.06%], General Motors[6.68%], Illumina [6.34%], NVIDIA [6.27%], General Electric[5.98%], Ford Motor[5.97%], Charles River[5.56%], Seagate [5.42%], Quest Diagnostics[5.4%] Best S&P 500 Stocks Daily:
Danaher [6.81%], Kimberly-Clark [5.31%], General Motors[4.61%], General Electric[4.48%], United Rentals[4.41%], Bio-Rad [4.33%], Quest Diagnostics[4.06%], Enphase [3.94%], Illumina [3.84%], Waters [3.28%], Thermo Fisher[3.22%]