
 Login Sign Up


| |||||
 |  | ||||

| 12Stocks.com Market Intelligence |
Best Nasdaq Stocks
|
On this page, you will find the most comprehensive analysis of Nasdaq 100 stocks and ETFs - from latest trends to performances to charts ➞. First, here are the year-to-date (YTD) performances of the most requested Nasdaq stocks at 12Stocks.com (click stock for review):
| NVIDIA 54% | ||
| Amazon.com 15% | ||
| Netflix 14% | ||
| Google 10% | ||
| QUALCOMM 9% | ||
| Costco 7% | ||
| Microsoft 6% | ||
| Amgen -7% | ||
| Comcast -8% | ||
| Starbucks -9% | ||
| Apple -14% | ||
| Expedia -15% | ||
| Gilead -18% | ||
| Baidu -20% | ||
| Biogen -25% | ||
| Intel -32% | ||
| Tesla -41% | ||
| Nasdaq 100 Stocks Lists: Performances & Trends, Nasdaq 100 Stock Charts
Sort Nasdaq 100 stocks: Daily, Weekly, Year-to-Date, Market Cap & Trends. |
| 12Stocks.com Nasdaq Stocks Performances & Trends Daily Report | |||||||||
|
| 
The overall Smart Investing & Trading Score is 13 (0-bearish to 100-bullish) which puts Nasdaq index in short term bearish trend. The Smart Investing & Trading Score from previous trading session is 26 and hence a deterioration of trend. | ||||||||
| Here are the Smart Investing & Trading Scores of the most requested Nasdaq 100 stocks at 12Stocks.com (click stock name for detailed review): |


| 12Stocks.com: Top Performing Nasdaq 100 Index Stocks | ||||||||||||||||||||||||||||||||||||||||||||||||
 The top performing Nasdaq 100 Index stocks year to date are
Now, more recently, over last week, the top performing Nasdaq 100 Index stocks on the move are


|
||||||||||||||||||||||||||||||||||||||||||||||||
| 12Stocks.com: Investing in Nasdaq 100 Index with Stocks | |
|
The following table helps investors and traders sort through current performance and trends (as measured by Smart Investing & Trading Score) of various
stocks in the Nasdaq 100 Index. Quick View: Move mouse or cursor over stock symbol (ticker) to view short-term technical chart and over stock name to view long term chart. Click on  to add stock symbol to your watchlist and to add stock symbol to your watchlist and  to view watchlist. Click on any ticker or stock name for detailed market intelligence report for that stock. to view watchlist. Click on any ticker or stock name for detailed market intelligence report for that stock. |
12Stocks.com Performance of Stocks in Nasdaq 100 Index
| Ticker | Stock Name | Watchlist | Category | Recent Price | Smart Investing & Trading Score | Change % | Weekly Change% |
| PDD | Pinduoduo |   | Services & Goods | 113.49 | 28 | -0.18% | -1.74% |
| ADBE | Adobe | | Technology | 465.02 | 10 | -1.72% | -1.91% |
| BIIB | Biogen | | Health Care | 194.38 | 25 | 2.03% | -1.92% |
| ROST | Ross Stores | | Services & Goods | 133.34 | 18 | 1.17% | -1.95% |
| GOOG | | Technology | 155.72 | 64 | -1.11% | -2.18% | |
| GOOGL | | Technology | 154.09 | 64 | -1.23% | -2.31% | |
| DLTR | Dollar Tree | | Services & Goods | 122.03 | 10 | -0.16% | -2.52% |
| INTU | Intuit | | Technology | 605.17 | 10 | -0.53% | -2.57% |
| CTSH | Cognizant | | Technology | 67.44 | 18 | 0.46% | -2.63% |
| GILD | Gilead | | Health Care | 66.76 | 10 | 0.91% | -2.75% |
| PAYX | Paychex | | Services & Goods | 119.52 | 17 | 1.47% | -2.83% |
| CSX | CSX | | Transports | 34.34 | 17 | -0.15% | -2.83% |
| CDW | CDW | | Technology | 235.78 | 36 | 0.03% | -2.94% |
| COST | Costco | | Services & Goods | 709.51 | 33 | -0.24% | -2.98% |
| SPY | SPDR S&P | | Utilities | 495.16 | 26 | -0.87% | -3.07% |
| BKNG | Booking | | Services & Goods | 3414.82 | 0 | -0.45% | -3.31% |
| FAST | Fastenal | | Services & Goods | 67.57 | 10 | 0.10% | -3.31% |
| MNST | Monster Beverage | | Consumer Staples | 53.14 | 10 | -0.60% | -3.40% |
| MRNA | Moderna | | Health Care | 101.44 | 23 | -0.55% | -3.52% |
| PYPL | PayPal | | Financials | 62.31 | 46 | 0.34% | -3.53% |
| FANG | Diamondback Energy | | Energy | 200.74 | 58 | 0.57% | -3.61% |
| ANSS | ANSYS | | Technology | 322.11 | 10 | -0.74% | -3.62% |
| SIRI | Sirius XM | | Services & Goods | 3.09 | 20 | 0.98% | -3.74% |
| QQEW | First Trust | | Utilities | 115.05 | 0 | -0.83% | -3.88% |
| DXCM | DexCom | | Health Care | 130.71 | 36 | -2.67% | -3.99% |
| TXN | Texas Instruments | | Technology | 159.68 | 23 | -2.44% | -4.00% |
| INTC | Intel | | Technology | 34.20 | 10 | -2.40% | -4.17% |
| ODFL | Old Dominion | | Transports | 211.82 | 10 | 1.92% | -4.21% |
| GEHC | GE HealthCare | | Health Care | 84.49 | 41 | -1.18% | -4.22% |
| IDXX | IDEXX | | Health Care | 476.35 | 10 | -0.30% | -4.31% |
| For chart view version of above stock list: Chart View ➞ 0 - 30 , 30 - 60 , 60 - 90 , 90 - 120 | ||
 | Click To Change The Sort Order: By Market Cap or Company Size Performance: Year-to-date, Week and Day |  |
|
Get the most comprehensive stock market coverage daily at 12Stocks.com ➞ Best Stocks Today ➞ Best Stocks Weekly ➞ Best Stocks Year-to-Date ➞ Best Stocks Trends ➞  Best Stocks Today 12Stocks.com Best Dow Stocks ➞ Best S&P 500 Stocks ➞ Best Tech Stocks ➞ Best Biotech Stocks ➞ |
| Detailed Overview of Nasdaq 100 Stocks |
| Nasdaq 100 Technical Overview, Leaders & Laggards, Top Nasdaq 100 ETF Funds & Detailed Nasdaq 100 Stocks List, Charts, Trends & More |
| Nasdaq 100: Technical Analysis, Trends & YTD Performance | |
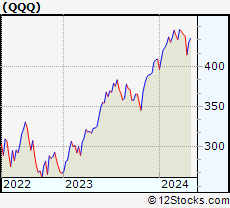
| Nasdaq 100 index as represented by
QQQ, an exchange-traded fund [ETF], holds basket of one hundred (mostly largecap) stocks from technology, biotech & retail sectors of the US stock market. The Nasdaq 100 index (contains stocks like Apple and Amgen) is up by 1.25% and is currently underperforming the overall market by -2.13% year-to-date. Below is a quick view of technical charts and trends: | |
 QQQ Weekly Chart |
|
| Long Term Trend: Not Good | |
| Medium Term Trend: Not Good | |
 QQQ Daily Chart |
|
| Short Term Trend: Not Good | |
| Overall Trend Score: 13 | |
| YTD Performance: 1.25% | |
| **Trend Scores & Views Are Only For Educational Purposes And Not For Investing | |
| 12Stocks.com: Investing in Nasdaq 100 Index using Exchange Traded Funds | |
|
The following table shows list of key exchange traded funds (ETF) that
help investors track Nasdaq 100 index. The following list also includes leveraged ETF funds that track twice or thrice the daily returns of Nasdaq 100 indices. Short or inverse ETF funds move in the opposite direction to the index they track and are useful during market pullbacks or during bear markets. Quick View: Move mouse or cursor over ETF symbol (ticker) to view short-term technical chart and over ETF name to view long term chart. Click on ticker or stock name for detailed view. Click on to add stock symbol to your watchlist and to view watchlist. |
12Stocks.com List of ETFs that track Nasdaq 100 Index
| Ticker | ETF Name | Watchlist | Recent Price | Smart Investing & Trading Score | Change % | Week % | Year-to-date % |
| SQQQ | ProShares UltraPro Short QQQ | | 12.84 | 82 | 6.38 | 17.91 | -4.54% |
| TQQQ | ProShares UltraPro QQQ | | 49.48 | 0 | -6.20 | -15.74 | -2.41% |
| QQQ | PowerShares QQQ ETF | | 414.65 | 13 | -2.07 | -5.39 | 1.25% |
| QYLD | Recon Capital NASDAQ 100 Cov Call ETF | | 17.27 | 0 | -1.79 | -3.81 | -0.37% |
| QID | ProShares UltraShort QQQ | | 51.49 | 87 | 4.15 | 11.69 | -2.94% |
| QLD | ProShares Ultra QQQ | | 75.88 | 0 | -4.11 | -10.68 | -0.16% |
| QTEC | First Trust NASDAQ-100-Tech Sector ETF | | 173.94 | 0 | -2.21 | -6.49 | -0.87% |
| QQQE | Direxion NASDAQ-100 Equal Wtd ETF | | 82.85 | 0 | -0.81 | -3.8 | -2.11% |
| QQQX | Nuveen Nasdaq 100 Dynamic Overwrite Fund | | 22.37 | 0 | -2.31 | -4.61 | -3.37% |
| QQEW | First Trust NASDAQ-100 Equal Wtd ETF | | 115.05 | 0 | -0.83 | -3.88 | -2.04% |
| QQXT | First Trust NASDAQ-100 ex-Tech Sect ETF | | 85.22 | 10 | -0.27 | -2.38 | -3.3% |
| 12Stocks.com: Charts, Trends, Fundamental Data and Performances of Nasdaq 100 Stocks | |
|
We now take in-depth look at all Nasdaq 100 stocks including charts, multi-period performances and overall trends (as measured by Smart Investing & Trading Score). One can sort Nasdaq 100 stocks (click link to choose) by Daily, Weekly and by Year-to-Date performances. Also, one can sort by size of the company or by market capitalization. |
| Select Your Default Chart Type: | |||||
| |||||
| Click on stock symbol or name for detailed view. Click on to add stock symbol to your watchlist and to view watchlist. Quick View: Move mouse or cursor over "Daily" to quickly view daily technical stock chart and over "Weekly" to view weekly technical stock chart. | |||||

 | PDD Pinduoduo Inc. |
| Sector: Services & Goods | |
| SubSector: Specialty Retail, Other | |
| MarketCap: 41696.2 Millions | |
| Recent Price: 113.49 Smart Investing & Trading Score: 28 | |
| Day Percent Change: -0.18% Day Change: -0.21 | |
| Week Change: -1.74% Year-to-date Change: -22.4% | |
| PDD Links: Profile News Message Board | |
| Charts:- Daily , Weekly | |
| Add PDD to Watchlist: View: Get Complete PDD Trend Analysis ➞ | |
 | ADBE Adobe Inc. |
| Sector: Technology | |
| SubSector: Application Software | |
| MarketCap: 157868 Millions | |
| Recent Price: 465.02 Smart Investing & Trading Score: 10 | |
| Day Percent Change: -1.72% Day Change: -8.16 | |
| Week Change: -1.91% Year-to-date Change: -22.1% | |
| ADBE Links: Profile News Message Board | |
| Charts:- Daily , Weekly | |
| Add ADBE to Watchlist: View: Get Complete ADBE Trend Analysis ➞ | |
 | BIIB Biogen Inc. |
| Sector: Health Care | |
| SubSector: Biotechnology | |
| MarketCap: 53102.6 Millions | |
| Recent Price: 194.38 Smart Investing & Trading Score: 25 | |
| Day Percent Change: 2.03% Day Change: 3.86 | |
| Week Change: -1.92% Year-to-date Change: -24.9% | |
| BIIB Links: Profile News Message Board | |
| Charts:- Daily , Weekly | |
| Add BIIB to Watchlist: View: Get Complete BIIB Trend Analysis ➞ | |
 | ROST Ross Stores, Inc. |
| Sector: Services & Goods | |
| SubSector: Apparel Stores | |
| MarketCap: 24938.8 Millions | |
| Recent Price: 133.34 Smart Investing & Trading Score: 18 | |
| Day Percent Change: 1.17% Day Change: 1.54 | |
| Week Change: -1.95% Year-to-date Change: -3.7% | |
| ROST Links: Profile News Message Board | |
| Charts:- Daily , Weekly | |
| Add ROST to Watchlist: View: Get Complete ROST Trend Analysis ➞ | |
 | GOOG Alphabet Inc. |
| Sector: Technology | |
| SubSector: Internet Information Providers | |
| MarketCap: 730159 Millions | |
| Recent Price: 155.72 Smart Investing & Trading Score: 64 | |
| Day Percent Change: -1.11% Day Change: -1.74 | |
| Week Change: -2.18% Year-to-date Change: 10.5% | |
| GOOG Links: Profile News Message Board | |
| Charts:- Daily , Weekly | |
| Add GOOG to Watchlist: View: Get Complete GOOG Trend Analysis ➞ | |
 | GOOGL Alphabet Inc. |
| Sector: Technology | |
| SubSector: Internet Information Providers | |
| MarketCap: 801264 Millions | |
| Recent Price: 154.09 Smart Investing & Trading Score: 64 | |
| Day Percent Change: -1.23% Day Change: -1.92 | |
| Week Change: -2.31% Year-to-date Change: 10.3% | |
| GOOGL Links: Profile News Message Board | |
| Charts:- Daily , Weekly | |
| Add GOOGL to Watchlist: View: Get Complete GOOGL Trend Analysis ➞ | |
 | DLTR Dollar Tree, Inc. |
| Sector: Services & Goods | |
| SubSector: Discount, Variety Stores | |
| MarketCap: 21383.2 Millions | |
| Recent Price: 122.03 Smart Investing & Trading Score: 10 | |
| Day Percent Change: -0.16% Day Change: -0.20 | |
| Week Change: -2.52% Year-to-date Change: -14.1% | |
| DLTR Links: Profile News Message Board | |
| Charts:- Daily , Weekly | |
| Add DLTR to Watchlist: View: Get Complete DLTR Trend Analysis ➞ | |
 | INTU Intuit Inc. |
| Sector: Technology | |
| SubSector: Application Software | |
| MarketCap: 577035 Millions | |
| Recent Price: 605.17 Smart Investing & Trading Score: 10 | |
| Day Percent Change: -0.53% Day Change: -3.21 | |
| Week Change: -2.57% Year-to-date Change: -3.2% | |
| INTU Links: Profile News Message Board | |
| Charts:- Daily , Weekly | |
| Add INTU to Watchlist: View: Get Complete INTU Trend Analysis ➞ | |
 | CTSH Cognizant Technology Solutions Corporation |
| Sector: Technology | |
| SubSector: Information Technology Services | |
| MarketCap: 26249.7 Millions | |
| Recent Price: 67.44 Smart Investing & Trading Score: 18 | |
| Day Percent Change: 0.46% Day Change: 0.31 | |
| Week Change: -2.63% Year-to-date Change: -10.7% | |
| CTSH Links: Profile News Message Board | |
| Charts:- Daily , Weekly | |
| Add CTSH to Watchlist: View: Get Complete CTSH Trend Analysis ➞ | |
 | GILD Gilead Sciences, Inc. |
| Sector: Health Care | |
| SubSector: Biotechnology | |
| MarketCap: 99485.6 Millions | |
| Recent Price: 66.76 Smart Investing & Trading Score: 10 | |
| Day Percent Change: 0.91% Day Change: 0.60 | |
| Week Change: -2.75% Year-to-date Change: -17.6% | |
| GILD Links: Profile News Message Board | |
| Charts:- Daily , Weekly | |
| Add GILD to Watchlist: View: Get Complete GILD Trend Analysis ➞ | |
 | PAYX Paychex, Inc. |
| Sector: Services & Goods | |
| SubSector: Staffing & Outsourcing Services | |
| MarketCap: 20928.8 Millions | |
| Recent Price: 119.52 Smart Investing & Trading Score: 17 | |
| Day Percent Change: 1.47% Day Change: 1.73 | |
| Week Change: -2.83% Year-to-date Change: 0.3% | |
| PAYX Links: Profile News Message Board | |
| Charts:- Daily , Weekly | |
| Add PAYX to Watchlist: View: Get Complete PAYX Trend Analysis ➞ | |
 | CSX CSX Corporation |
| Sector: Transports | |
| SubSector: Railroads | |
| MarketCap: 42131.2 Millions | |
| Recent Price: 34.34 Smart Investing & Trading Score: 17 | |
| Day Percent Change: -0.15% Day Change: -0.05 | |
| Week Change: -2.83% Year-to-date Change: -1.0% | |
| CSX Links: Profile News Message Board | |
| Charts:- Daily , Weekly | |
| Add CSX to Watchlist: View: Get Complete CSX Trend Analysis ➞ | |
 | CDW CDW Corporation |
| Sector: Technology | |
| SubSector: Information Technology Services | |
| MarketCap: 12775 Millions | |
| Recent Price: 235.78 Smart Investing & Trading Score: 36 | |
| Day Percent Change: 0.03% Day Change: 0.08 | |
| Week Change: -2.94% Year-to-date Change: 3.7% | |
| CDW Links: Profile News Message Board | |
| Charts:- Daily , Weekly | |
| Add CDW to Watchlist: View: Get Complete CDW Trend Analysis ➞ | |
 | COST Costco Wholesale Corporation |
| Sector: Services & Goods | |
| SubSector: Discount, Variety Stores | |
| MarketCap: 136355 Millions | |
| Recent Price: 709.51 Smart Investing & Trading Score: 33 | |
| Day Percent Change: -0.24% Day Change: -1.74 | |
| Week Change: -2.98% Year-to-date Change: 7.5% | |
| COST Links: Profile News Message Board | |
| Charts:- Daily , Weekly | |
| Add COST to Watchlist: View: Get Complete COST Trend Analysis ➞ | |
 | SPY SPDR S&P 500 ETF |
| Sector: Utilities | |
| SubSector: Exchange Traded Fund | |
| MarketCap: 0 Millions | |
| Recent Price: 495.16 Smart Investing & Trading Score: 26 | |
| Day Percent Change: -0.87% Day Change: -4.36 | |
| Week Change: -3.07% Year-to-date Change: 4.2% | |
| SPY Links: Profile News Message Board | |
| Charts:- Daily , Weekly | |
| Add SPY to Watchlist: View: Get Complete SPY Trend Analysis ➞ | |
 | BKNG Booking Holdings Inc. |
| Sector: Services & Goods | |
| SubSector: Business Services | |
| MarketCap: 54467.9 Millions | |
| Recent Price: 3414.82 Smart Investing & Trading Score: 0 | |
| Day Percent Change: -0.45% Day Change: -15.32 | |
| Week Change: -3.31% Year-to-date Change: -3.7% | |
| BKNG Links: Profile News Message Board | |
| Charts:- Daily , Weekly | |
| Add BKNG to Watchlist: View: Get Complete BKNG Trend Analysis ➞ | |
 | FAST Fastenal Company |
| Sector: Services & Goods | |
| SubSector: Industrial Equipment Wholesale | |
| MarketCap: 17609.9 Millions | |
| Recent Price: 67.57 Smart Investing & Trading Score: 10 | |
| Day Percent Change: 0.10% Day Change: 0.07 | |
| Week Change: -3.31% Year-to-date Change: 4.3% | |
| FAST Links: Profile News Message Board | |
| Charts:- Daily , Weekly | |
| Add FAST to Watchlist: View: Get Complete FAST Trend Analysis ➞ | |
 | MNST Monster Beverage Corporation |
| Sector: Consumer Staples | |
| SubSector: Beverages - Soft Drinks | |
| MarketCap: 30126.8 Millions | |
| Recent Price: 53.14 Smart Investing & Trading Score: 10 | |
| Day Percent Change: -0.60% Day Change: -0.32 | |
| Week Change: -3.4% Year-to-date Change: -7.8% | |
| MNST Links: Profile News Message Board | |
| Charts:- Daily , Weekly | |
| Add MNST to Watchlist: View: Get Complete MNST Trend Analysis ➞ | |
 | MRNA Moderna, Inc. |
| Sector: Health Care | |
| SubSector: Biotechnology | |
| MarketCap: 11006.4 Millions | |
| Recent Price: 101.44 Smart Investing & Trading Score: 23 | |
| Day Percent Change: -0.55% Day Change: -0.56 | |
| Week Change: -3.52% Year-to-date Change: 2.0% | |
| MRNA Links: Profile News Message Board | |
| Charts:- Daily , Weekly | |
| Add MRNA to Watchlist: View: Get Complete MRNA Trend Analysis ➞ | |
 | PYPL PayPal Holdings, Inc. |
| Sector: Financials | |
| SubSector: Credit Services | |
| MarketCap: 108949 Millions | |
| Recent Price: 62.31 Smart Investing & Trading Score: 46 | |
| Day Percent Change: 0.34% Day Change: 0.21 | |
| Week Change: -3.53% Year-to-date Change: 1.5% | |
| PYPL Links: Profile News Message Board | |
| Charts:- Daily , Weekly | |
| Add PYPL to Watchlist: View: Get Complete PYPL Trend Analysis ➞ | |
 | FANG Diamondback Energy, Inc. |
| Sector: Energy | |
| SubSector: Independent Oil & Gas | |
| MarketCap: 3009.13 Millions | |
| Recent Price: 200.74 Smart Investing & Trading Score: 58 | |
| Day Percent Change: 0.57% Day Change: 1.14 | |
| Week Change: -3.61% Year-to-date Change: 29.4% | |
| FANG Links: Profile News Message Board | |
| Charts:- Daily , Weekly | |
| Add FANG to Watchlist: View: Get Complete FANG Trend Analysis ➞ | |
 | ANSS ANSYS, Inc. |
| Sector: Technology | |
| SubSector: Application Software | |
| MarketCap: 19497.4 Millions | |
| Recent Price: 322.11 Smart Investing & Trading Score: 10 | |
| Day Percent Change: -0.74% Day Change: -2.39 | |
| Week Change: -3.62% Year-to-date Change: -11.2% | |
| ANSS Links: Profile News Message Board | |
| Charts:- Daily , Weekly | |
| Add ANSS to Watchlist: View: Get Complete ANSS Trend Analysis ➞ | |
 | SIRI Sirius XM Holdings Inc. |
| Sector: Services & Goods | |
| SubSector: Broadcasting - Radio | |
| MarketCap: 21325.5 Millions | |
| Recent Price: 3.09 Smart Investing & Trading Score: 20 | |
| Day Percent Change: 0.98% Day Change: 0.03 | |
| Week Change: -3.74% Year-to-date Change: -43.5% | |
| SIRI Links: Profile News Message Board | |
| Charts:- Daily , Weekly | |
| Add SIRI to Watchlist: View: Get Complete SIRI Trend Analysis ➞ | |
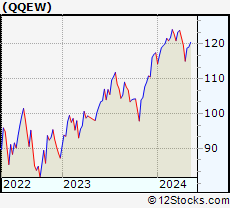 | QQEW First Trust NASDAQ-100 Equal Wtd ETF |
| Sector: Utilities | |
| SubSector: Exchange Traded Fund | |
| MarketCap: 0 Millions | |
| Recent Price: 115.05 Smart Investing & Trading Score: 0 | |
| Day Percent Change: -0.83% Day Change: -0.96 | |
| Week Change: -3.88% Year-to-date Change: -2.0% | |
| QQEW Links: Profile News Message Board | |
| Charts:- Daily , Weekly | |
| Add QQEW to Watchlist: View: Get Complete QQEW Trend Analysis ➞ | |
 | DXCM DexCom, Inc. |
| Sector: Health Care | |
| SubSector: Medical Laboratories & Research | |
| MarketCap: 19559 Millions | |
| Recent Price: 130.71 Smart Investing & Trading Score: 36 | |
| Day Percent Change: -2.67% Day Change: -3.59 | |
| Week Change: -3.99% Year-to-date Change: 5.3% | |
| DXCM Links: Profile News Message Board | |
| Charts:- Daily , Weekly | |
| Add DXCM to Watchlist: View: Get Complete DXCM Trend Analysis ➞ | |
 | TXN Texas Instruments Incorporated |
| Sector: Technology | |
| SubSector: Semiconductor - Broad Line | |
| MarketCap: 99509.1 Millions | |
| Recent Price: 159.68 Smart Investing & Trading Score: 23 | |
| Day Percent Change: -2.44% Day Change: -3.99 | |
| Week Change: -4% Year-to-date Change: -6.3% | |
| TXN Links: Profile News Message Board | |
| Charts:- Daily , Weekly | |
| Add TXN to Watchlist: View: Get Complete TXN Trend Analysis ➞ | |
 | INTC Intel Corporation |
| Sector: Technology | |
| SubSector: Semiconductor - Broad Line | |
| MarketCap: 222357 Millions | |
| Recent Price: 34.20 Smart Investing & Trading Score: 10 | |
| Day Percent Change: -2.40% Day Change: -0.84 | |
| Week Change: -4.17% Year-to-date Change: -31.9% | |
| INTC Links: Profile News Message Board | |
| Charts:- Daily , Weekly | |
| Add INTC to Watchlist: View: Get Complete INTC Trend Analysis ➞ | |
 | ODFL Old Dominion Freight Line, Inc. |
| Sector: Transports | |
| SubSector: Trucking | |
| MarketCap: 14457.5 Millions | |
| Recent Price: 211.82 Smart Investing & Trading Score: 10 | |
| Day Percent Change: 1.92% Day Change: 4.00 | |
| Week Change: -4.21% Year-to-date Change: -47.7% | |
| ODFL Links: Profile News Message Board | |
| Charts:- Daily , Weekly | |
| Add ODFL to Watchlist: View: Get Complete ODFL Trend Analysis ➞ | |
 | GEHC GE HealthCare Technologies Inc. |
| Sector: Health Care | |
| SubSector: Health Information Services | |
| MarketCap: 36240 Millions | |
| Recent Price: 84.49 Smart Investing & Trading Score: 41 | |
| Day Percent Change: -1.18% Day Change: -1.01 | |
| Week Change: -4.22% Year-to-date Change: 9.2% | |
| GEHC Links: Profile News Message Board | |
| Charts:- Daily , Weekly | |
| Add GEHC to Watchlist: View: Get Complete GEHC Trend Analysis ➞ | |
 | IDXX IDEXX Laboratories, Inc. |
| Sector: Health Care | |
| SubSector: Diagnostic Substances | |
| MarketCap: 15937.1 Millions | |
| Recent Price: 476.35 Smart Investing & Trading Score: 10 | |
| Day Percent Change: -0.30% Day Change: -1.44 | |
| Week Change: -4.31% Year-to-date Change: -14.2% | |
| IDXX Links: Profile News Message Board | |
| Charts:- Daily , Weekly | |
| Add IDXX to Watchlist: View: Get Complete IDXX Trend Analysis ➞ | |
| For tabular summary view of above stock list: Summary View ➞ 0 - 30 , 30 - 60 , 60 - 90 , 90 - 120 | ||
| Click To Change The Sort Order: By Market Cap or Company Size Performance: Year-to-date, Week and Day | |
| Select Chart Type: | ||
|
Best Stocks Today 12Stocks.com |
© 2024 12Stocks.com Terms & Conditions Privacy Contact Us
All Information Provided Only For Education And Not To Be Used For Investing or Trading. See Terms & Conditions


One More Thing ... Get Best Stocks Delivered Daily!
Never Ever Miss A Move With Our Top Ten Stocks Lists
Find Best Stocks In Any Market - Bull or Bear Market
Take A Peek At Our Top Ten Stocks Lists: Daily, Weekly, Year-to-Date & Top Trends
Find Best Stocks In Any Market - Bull or Bear Market
Take A Peek At Our Top Ten Stocks Lists: Daily, Weekly, Year-to-Date & Top Trends
Nasdaq 100 Stocks With Best Up Trends [0-bearish to 100-bullish]: Kraft Heinz[100], PepsiCo [93], Keurig Dr[87], UltraPro[82], Exelon [81], T-Mobile US[75], Xcel Energy[74], AstraZeneca [71], American Electric[68], Baker Hughes[68], Google [64]
Best Nasdaq 100 Stocks Year-to-Date:
Constellation Energy[54.47%], NVIDIA [53.87%], Meta Platforms[35.89%], Diamondback Energy[29.44%], DoorDash [29.01%], Micron [25.11%], Applied Materials[17.09%], Airbnb [16.8%], Amazon.com [14.93%], O Reilly[14.83%], Netflix [14%] Best Nasdaq 100 Stocks This Week:
UltraPro[17.91%], Kraft Heinz[5.12%], Lululemon Athletica[4.86%], Keurig Dr[4.27%], PepsiCo [3.59%], Starbucks [3.17%], Xcel Energy[2.92%], American Electric[2.56%], Comcast [2.21%], Walgreens Boots[2.18%], Mondelez [2.13%] Best Nasdaq 100 Stocks Daily:
UltraPro[6.38%], Walgreens Boots[3.70%], Autodesk [2.79%], Exelon [2.37%], Amgen [2.35%], Charter [2.04%], Biogen [2.03%], American Electric[1.99%], Old Dominion[1.92%], Kraft Heinz[1.81%], Xcel Energy[1.79%]