
 Login Sign Up


| |||||
 |  | ||||

| 12Stocks.com Market Intelligence |
Best Nasdaq Stocks
|
On this page, you will find the most comprehensive analysis of Nasdaq 100 stocks and ETFs - from latest trends to performances to charts ➞. First, here are the year-to-date (YTD) performances of the most requested Nasdaq stocks at 12Stocks.com (click stock for review):
| NVIDIA 70% | ||
| Netflix 26% | ||
| Amazon.com 19% | ||
| QUALCOMM 14% | ||
| Google 11% | ||
| Microsoft 10% | ||
| Costco 8% | ||
| Amgen -8% | ||
| Starbucks -10% | ||
| Comcast -11% | ||
| Apple -13% | ||
| Expedia -15% | ||
| Gilead -17% | ||
| Baidu -21% | ||
| Biogen -26% | ||
| Intel -29% | ||
| Tesla -37% | ||
| Nasdaq 100 Stocks Lists: Performances & Trends, Nasdaq 100 Stock Charts
Sort Nasdaq 100 stocks: Daily, Weekly, Year-to-Date, Market Cap & Trends. |
| 12Stocks.com Nasdaq Stocks Performances & Trends Daily Report | |||||||||
|
| 
The overall Smart Investing & Trading Score is 26 (0-bearish to 100-bullish) which puts Nasdaq index in short term bearish to neutral trend. The Smart Investing & Trading Score from previous trading session is 33 and hence a deterioration of trend. | ||||||||
| Here are the Smart Investing & Trading Scores of the most requested Nasdaq 100 stocks at 12Stocks.com (click stock name for detailed review): |


| 12Stocks.com: Top Performing Nasdaq 100 Index Stocks | ||||||||||||||||||||||||||||||||||||||||||||||||
 The top performing Nasdaq 100 Index stocks year to date are
Now, more recently, over last week, the top performing Nasdaq 100 Index stocks on the move are


|
||||||||||||||||||||||||||||||||||||||||||||||||
| 12Stocks.com: Investing in Nasdaq 100 Index with Stocks | |
|
The following table helps investors and traders sort through current performance and trends (as measured by Smart Investing & Trading Score) of various
stocks in the Nasdaq 100 Index. Quick View: Move mouse or cursor over stock symbol (ticker) to view short-term technical chart and over stock name to view long term chart. Click on  to add stock symbol to your watchlist and to add stock symbol to your watchlist and  to view watchlist. Click on any ticker or stock name for detailed market intelligence report for that stock. to view watchlist. Click on any ticker or stock name for detailed market intelligence report for that stock. |
12Stocks.com Performance of Stocks in Nasdaq 100 Index
| Ticker | Stock Name | Watchlist | Category | Recent Price | Smart Investing & Trading Score | Change % | YTD Change% |
| SQQQ | UltraPro |   | Utilities | 11.86 | 69 | 3.67 | -11.82% |
| AEP | American Electric | | Utilities | 81.24 | 53 | 2.18 | 0.02% |
| EXC | Exelon | | Utilities | 36.42 | 53 | 1.87 | 1.45% |
| LULU | Lululemon Athletica | | Consumer Staples | 344.86 | 42 | 1.73 | -32.55% |
| KDP | Keurig Dr | | Consumer Staples | 30.88 | 60 | 1.45 | -7.32% |
| XEL | Xcel Energy | | Utilities | 53.19 | 27 | 1.26 | -14.08% |
| PEP | PepsiCo | | Consumer Staples | 169.48 | 55 | 1.18 | -0.21% |
| ABNB | Airbnb | | Technology | 158.37 | 56 | 1.09 | 16.32% |
| SBUX | Starbucks | | Services & Goods | 86.21 | 42 | 0.92 | -10.21% |
| KHC | Kraft Heinz | | Consumer Staples | 36.90 | 65 | 0.85 | -0.22% |
| PANW | Palo Alto | | Technology | 277.33 | 30 | 0.84 | -5.95% |
| MDLZ | Mondelez | | Consumer Staples | 66.51 | 25 | 0.80 | -8.17% |
| REGN | Regeneron | | Health Care | 901.19 | 25 | 0.79 | 2.61% |
| GOOGL | | Technology | 155.47 | 75 | 0.69 | 11.30% | |
| GOOG | | Technology | 156.88 | 75 | 0.56 | 11.32% | |
| ILMN | Illumina | | Health Care | 118.29 | 17 | 0.51 | -15.05% |
| ORLY | O Reilly | | Services & Goods | 1094.80 | 58 | 0.49 | 15.23% |
| AZN | AstraZeneca | | Health Care | 68.53 | 78 | 0.39 | 1.75% |
| CTAS | Cintas | | Services & Goods | 668.51 | 41 | 0.29 | 10.93% |
| INTU | Intuit | | Technology | 613.21 | 10 | 0.28 | -1.89% |
| FTNT | Fortinet | | Technology | 64.66 | 23 | 0.28 | 10.47% |
| TMUS | T-Mobile US | | Technology | 160.09 | 38 | 0.19 | -0.15% |
| CHTR | Charter | | Technology | 258.03 | 27 | 0.18 | -33.61% |
| TEAM | Atlassian | | Technology | 195.07 | 25 | 0.11 | -17.99% |
| VRSK | Verisk Analytics | | Services & Goods | 222.25 | 18 | 0.07 | -6.95% |
| MELI | MercadoLibre | | Services & Goods | 1397.86 | 0 | 0.00 | -11.05% |
| WBA | Walgreens Boots | | Services & Goods | 17.63 | 20 | -0.06 | -32.48% |
| PDD | Pinduoduo | | Services & Goods | 113.43 | 10 | -0.08 | -22.47% |
| ROP | Roper | | Industrials | 526.47 | 10 | -0.10 | -3.43% |
| COST | Costco | | Services & Goods | 715.19 | 33 | -0.11 | 8.35% |
| For chart view version of above stock list: Chart View ➞ 0 - 30 , 30 - 60 , 60 - 90 , 90 - 120 | ||
 | Click To Change The Sort Order: By Market Cap or Company Size Performance: Year-to-date, Week and Day |  |
|
Get the most comprehensive stock market coverage daily at 12Stocks.com ➞ Best Stocks Today ➞ Best Stocks Weekly ➞ Best Stocks Year-to-Date ➞ Best Stocks Trends ➞  Best Stocks Today 12Stocks.com Best Dow Stocks ➞ Best S&P 500 Stocks ➞ Best Tech Stocks ➞ Best Biotech Stocks ➞ |
| Detailed Overview of Nasdaq 100 Stocks |
| Nasdaq 100 Technical Overview, Leaders & Laggards, Top Nasdaq 100 ETF Funds & Detailed Nasdaq 100 Stocks List, Charts, Trends & More |
| Nasdaq 100: Technical Analysis, Trends & YTD Performance | |
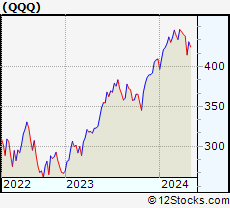
| Nasdaq 100 index as represented by
QQQ, an exchange-traded fund [ETF], holds basket of one hundred (mostly largecap) stocks from technology, biotech & retail sectors of the US stock market. The Nasdaq 100 index (contains stocks like Apple and Amgen) is up by 3.99% and is currently underperforming the overall market by -0.42% year-to-date. Below is a quick view of technical charts and trends: | |
 QQQ Weekly Chart |
|
| Long Term Trend: Good | |
| Medium Term Trend: Not Good | |
 QQQ Daily Chart |
|
| Short Term Trend: Not Good | |
| Overall Trend Score: 26 | |
| YTD Performance: 3.99% | |
| **Trend Scores & Views Are Only For Educational Purposes And Not For Investing | |
| 12Stocks.com: Investing in Nasdaq 100 Index using Exchange Traded Funds | |
|
The following table shows list of key exchange traded funds (ETF) that
help investors track Nasdaq 100 index. The following list also includes leveraged ETF funds that track twice or thrice the daily returns of Nasdaq 100 indices. Short or inverse ETF funds move in the opposite direction to the index they track and are useful during market pullbacks or during bear markets. Quick View: Move mouse or cursor over ETF symbol (ticker) to view short-term technical chart and over ETF name to view long term chart. Click on ticker or stock name for detailed view. Click on to add stock symbol to your watchlist and to view watchlist. |
12Stocks.com List of ETFs that track Nasdaq 100 Index
| Ticker | ETF Name | Watchlist | Recent Price | Smart Investing & Trading Score | Change % | Week % | Year-to-date % |
| SQQQ | ProShares UltraPro Short QQQ | | 11.86 | 69 | 3.67 | 8.91 | -11.82% |
| TQQQ | ProShares UltraPro QQQ | | 53.71 | 26 | -3.71 | -8.53 | 5.94% |
| QQQ | PowerShares QQQ ETF | | 425.84 | 26 | -1.31 | -2.84 | 3.99% |
| QYLD | Recon Capital NASDAQ 100 Cov Call ETF | | 17.70 | 18 | -0.73 | -1.45 | 2.08% |
| QID | ProShares UltraShort QQQ | | 48.84 | 74 | 2.48 | 5.94 | -7.94% |
| QLD | ProShares Ultra QQQ | | 80.11 | 26 | -2.45 | -5.7 | 5.41% |
| QQQE | Direxion NASDAQ-100 Equal Wtd ETF | | 84.02 | 0 | -0.97 | -2.44 | -0.73% |
| QQQX | Nuveen Nasdaq 100 Dynamic Overwrite Fund | | 23.00 | 13 | -0.43 | -1.92 | -0.65% |
| QTEC | First Trust NASDAQ-100-Tech Sector ETF | | 179.73 | 13 | -1.93 | -3.38 | 2.43% |
| QQEW | First Trust NASDAQ-100 Equal Wtd ETF | | 116.68 | 0 | -1.01 | -2.51 | -0.66% |
| QQXT | First Trust NASDAQ-100 ex-Tech Sect ETF | | 85.80 | 0 | -0.33 | -1.71 | -2.64% |
| 12Stocks.com: Charts, Trends, Fundamental Data and Performances of Nasdaq 100 Stocks | |
|
We now take in-depth look at all Nasdaq 100 stocks including charts, multi-period performances and overall trends (as measured by Smart Investing & Trading Score). One can sort Nasdaq 100 stocks (click link to choose) by Daily, Weekly and by Year-to-Date performances. Also, one can sort by size of the company or by market capitalization. |
| Select Your Default Chart Type: | |||||
| |||||
| Click on stock symbol or name for detailed view. Click on to add stock symbol to your watchlist and to view watchlist. Quick View: Move mouse or cursor over "Daily" to quickly view daily technical stock chart and over "Weekly" to view weekly technical stock chart. | |||||

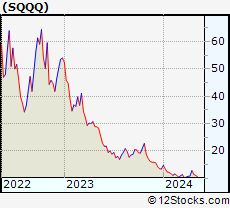 | SQQQ ProShares UltraPro Short QQQ |
| Sector: Utilities | |
| SubSector: Exchange Traded Fund | |
| MarketCap: 0 Millions | |
| Recent Price: 11.86 Smart Investing & Trading Score: 69 | |
| Day Percent Change: 3.67% Day Change: 0.42 | |
| Week Change: 8.91% Year-to-date Change: -11.8% | |
| SQQQ Links: Profile News Message Board | |
| Charts:- Daily , Weekly | |
| Add SQQQ to Watchlist: View: Get Complete SQQQ Trend Analysis ➞ | |
 | AEP American Electric Power Company, Inc. |
| Sector: Utilities | |
| SubSector: Electric Utilities | |
| MarketCap: 38380 Millions | |
| Recent Price: 81.24 Smart Investing & Trading Score: 53 | |
| Day Percent Change: 2.18% Day Change: 1.73 | |
| Week Change: -1.05% Year-to-date Change: 0.0% | |
| AEP Links: Profile News Message Board | |
| Charts:- Daily , Weekly | |
| Add AEP to Watchlist: View: Get Complete AEP Trend Analysis ➞ | |
 | EXC Exelon Corporation |
| Sector: Utilities | |
| SubSector: Diversified Utilities | |
| MarketCap: 34091.9 Millions | |
| Recent Price: 36.42 Smart Investing & Trading Score: 53 | |
| Day Percent Change: 1.87% Day Change: 0.67 | |
| Week Change: -1.03% Year-to-date Change: 1.5% | |
| EXC Links: Profile News Message Board | |
| Charts:- Daily , Weekly | |
| Add EXC to Watchlist: View: Get Complete EXC Trend Analysis ➞ | |
 | LULU Lululemon Athletica Inc. |
| Sector: Consumer Staples | |
| SubSector: Textile - Apparel Clothing | |
| MarketCap: 24627.8 Millions | |
| Recent Price: 344.86 Smart Investing & Trading Score: 42 | |
| Day Percent Change: 1.73% Day Change: 5.88 | |
| Week Change: 2.6% Year-to-date Change: -32.6% | |
| LULU Links: Profile News Message Board | |
| Charts:- Daily , Weekly | |
| Add LULU to Watchlist: View: Get Complete LULU Trend Analysis ➞ | |
 | KDP Keurig Dr Pepper Inc. |
| Sector: Consumer Staples | |
| SubSector: Beverages - Soft Drinks | |
| MarketCap: 35295.2 Millions | |
| Recent Price: 30.88 Smart Investing & Trading Score: 60 | |
| Day Percent Change: 1.45% Day Change: 0.44 | |
| Week Change: 2.18% Year-to-date Change: -7.3% | |
| KDP Links: Profile News Message Board | |
| Charts:- Daily , Weekly | |
| Add KDP to Watchlist: View: Get Complete KDP Trend Analysis ➞ | |
 | XEL Xcel Energy Inc. |
| Sector: Utilities | |
| SubSector: Electric Utilities | |
| MarketCap: 28960.8 Millions | |
| Recent Price: 53.19 Smart Investing & Trading Score: 27 | |
| Day Percent Change: 1.26% Day Change: 0.66 | |
| Week Change: 0.04% Year-to-date Change: -14.1% | |
| XEL Links: Profile News Message Board | |
| Charts:- Daily , Weekly | |
| Add XEL to Watchlist: View: Get Complete XEL Trend Analysis ➞ | |
 | PEP PepsiCo, Inc. |
| Sector: Consumer Staples | |
| SubSector: Beverages - Soft Drinks | |
| MarketCap: 162458 Millions | |
| Recent Price: 169.48 Smart Investing & Trading Score: 55 | |
| Day Percent Change: 1.18% Day Change: 1.98 | |
| Week Change: 0.82% Year-to-date Change: -0.2% | |
| PEP Links: Profile News Message Board | |
| Charts:- Daily , Weekly | |
| Add PEP to Watchlist: View: Get Complete PEP Trend Analysis ➞ | |
 | ABNB Airbnb, Inc. |
| Sector: Technology | |
| SubSector: Internet Content & Information | |
| MarketCap: 86237 Millions | |
| Recent Price: 158.37 Smart Investing & Trading Score: 56 | |
| Day Percent Change: 1.09% Day Change: 1.71 | |
| Week Change: -0.63% Year-to-date Change: 16.3% | |
| ABNB Links: Profile News Message Board | |
| Charts:- Daily , Weekly | |
| Add ABNB to Watchlist: View: Get Complete ABNB Trend Analysis ➞ | |
 | SBUX Starbucks Corporation |
| Sector: Services & Goods | |
| SubSector: Specialty Eateries | |
| MarketCap: 74909.7 Millions | |
| Recent Price: 86.21 Smart Investing & Trading Score: 42 | |
| Day Percent Change: 0.92% Day Change: 0.79 | |
| Week Change: 1.52% Year-to-date Change: -10.2% | |
| SBUX Links: Profile News Message Board | |
| Charts:- Daily , Weekly | |
| Add SBUX to Watchlist: View: Get Complete SBUX Trend Analysis ➞ | |
 | KHC The Kraft Heinz Company |
| Sector: Consumer Staples | |
| SubSector: Food - Major Diversified | |
| MarketCap: 32096.3 Millions | |
| Recent Price: 36.90 Smart Investing & Trading Score: 65 | |
| Day Percent Change: 0.85% Day Change: 0.31 | |
| Week Change: 2.67% Year-to-date Change: -0.2% | |
| KHC Links: Profile News Message Board | |
| Charts:- Daily , Weekly | |
| Add KHC to Watchlist: View: Get Complete KHC Trend Analysis ➞ | |
 | PANW Palo Alto Networks, Inc. |
| Sector: Technology | |
| SubSector: Networking & Communication Devices | |
| MarketCap: 16039.4 Millions | |
| Recent Price: 277.33 Smart Investing & Trading Score: 30 | |
| Day Percent Change: 0.84% Day Change: 2.31 | |
| Week Change: -0.62% Year-to-date Change: -6.0% | |
| PANW Links: Profile News Message Board | |
| Charts:- Daily , Weekly | |
| Add PANW to Watchlist: View: Get Complete PANW Trend Analysis ➞ | |
 | MDLZ Mondelez International, Inc. |
| Sector: Consumer Staples | |
| SubSector: Confectioners | |
| MarketCap: 68385.8 Millions | |
| Recent Price: 66.51 Smart Investing & Trading Score: 25 | |
| Day Percent Change: 0.80% Day Change: 0.53 | |
| Week Change: -0.27% Year-to-date Change: -8.2% | |
| MDLZ Links: Profile News Message Board | |
| Charts:- Daily , Weekly | |
| Add MDLZ to Watchlist: View: Get Complete MDLZ Trend Analysis ➞ | |
 | REGN Regeneron Pharmaceuticals, Inc. |
| Sector: Health Care | |
| SubSector: Biotechnology | |
| MarketCap: 51903.7 Millions | |
| Recent Price: 901.19 Smart Investing & Trading Score: 25 | |
| Day Percent Change: 0.79% Day Change: 7.05 | |
| Week Change: -0.39% Year-to-date Change: 2.6% | |
| REGN Links: Profile News Message Board | |
| Charts:- Daily , Weekly | |
| Add REGN to Watchlist: View: Get Complete REGN Trend Analysis ➞ | |
 | GOOGL Alphabet Inc. |
| Sector: Technology | |
| SubSector: Internet Information Providers | |
| MarketCap: 801264 Millions | |
| Recent Price: 155.47 Smart Investing & Trading Score: 75 | |
| Day Percent Change: 0.69% Day Change: 1.07 | |
| Week Change: -1.43% Year-to-date Change: 11.3% | |
| GOOGL Links: Profile News Message Board | |
| Charts:- Daily , Weekly | |
| Add GOOGL to Watchlist: View: Get Complete GOOGL Trend Analysis ➞ | |
 | GOOG Alphabet Inc. |
| Sector: Technology | |
| SubSector: Internet Information Providers | |
| MarketCap: 730159 Millions | |
| Recent Price: 156.88 Smart Investing & Trading Score: 75 | |
| Day Percent Change: 0.56% Day Change: 0.88 | |
| Week Change: -1.45% Year-to-date Change: 11.3% | |
| GOOG Links: Profile News Message Board | |
| Charts:- Daily , Weekly | |
| Add GOOG to Watchlist: View: Get Complete GOOG Trend Analysis ➞ | |
 | ILMN Illumina, Inc. |
| Sector: Health Care | |
| SubSector: Biotechnology | |
| MarketCap: 39194.3 Millions | |
| Recent Price: 118.29 Smart Investing & Trading Score: 17 | |
| Day Percent Change: 0.51% Day Change: 0.60 | |
| Week Change: -6.91% Year-to-date Change: -15.1% | |
| ILMN Links: Profile News Message Board | |
| Charts:- Daily , Weekly | |
| Add ILMN to Watchlist: View: Get Complete ILMN Trend Analysis ➞ | |
 | ORLY O Reilly Automotive, Inc. |
| Sector: Services & Goods | |
| SubSector: Auto Parts Stores | |
| MarketCap: 22391.5 Millions | |
| Recent Price: 1094.80 Smart Investing & Trading Score: 58 | |
| Day Percent Change: 0.49% Day Change: 5.29 | |
| Week Change: 1.7% Year-to-date Change: 15.2% | |
| ORLY Links: Profile News Message Board | |
| Charts:- Daily , Weekly | |
| Add ORLY to Watchlist: View: Get Complete ORLY Trend Analysis ➞ | |
 | AZN AstraZeneca PLC |
| Sector: Health Care | |
| SubSector: Drug Manufacturers - Major | |
| MarketCap: 113154 Millions | |
| Recent Price: 68.53 Smart Investing & Trading Score: 78 | |
| Day Percent Change: 0.39% Day Change: 0.27 | |
| Week Change: -0.58% Year-to-date Change: 1.8% | |
| AZN Links: Profile News Message Board | |
| Charts:- Daily , Weekly | |
| Add AZN to Watchlist: View: Get Complete AZN Trend Analysis ➞ | |
 | CTAS Cintas Corporation |
| Sector: Services & Goods | |
| SubSector: Business Services | |
| MarketCap: 20154.6 Millions | |
| Recent Price: 668.51 Smart Investing & Trading Score: 41 | |
| Day Percent Change: 0.29% Day Change: 1.95 | |
| Week Change: 0.01% Year-to-date Change: 10.9% | |
| CTAS Links: Profile News Message Board | |
| Charts:- Daily , Weekly | |
| Add CTAS to Watchlist: View: Get Complete CTAS Trend Analysis ➞ | |
 | INTU Intuit Inc. |
| Sector: Technology | |
| SubSector: Application Software | |
| MarketCap: 577035 Millions | |
| Recent Price: 613.21 Smart Investing & Trading Score: 10 | |
| Day Percent Change: 0.28% Day Change: 1.72 | |
| Week Change: -1.27% Year-to-date Change: -1.9% | |
| INTU Links: Profile News Message Board | |
| Charts:- Daily , Weekly | |
| Add INTU to Watchlist: View: Get Complete INTU Trend Analysis ➞ | |
 | FTNT Fortinet, Inc. |
| Sector: Technology | |
| SubSector: Application Software | |
| MarketCap: 16993.8 Millions | |
| Recent Price: 64.66 Smart Investing & Trading Score: 23 | |
| Day Percent Change: 0.28% Day Change: 0.18 | |
| Week Change: -5.22% Year-to-date Change: 10.5% | |
| FTNT Links: Profile News Message Board | |
| Charts:- Daily , Weekly | |
| Add FTNT to Watchlist: View: Get Complete FTNT Trend Analysis ➞ | |
 | TMUS T-Mobile US, Inc. |
| Sector: Technology | |
| SubSector: Wireless Communications | |
| MarketCap: 71949 Millions | |
| Recent Price: 160.09 Smart Investing & Trading Score: 38 | |
| Day Percent Change: 0.19% Day Change: 0.30 | |
| Week Change: 0.02% Year-to-date Change: -0.2% | |
| TMUS Links: Profile News Message Board | |
| Charts:- Daily , Weekly | |
| Add TMUS to Watchlist: View: Get Complete TMUS Trend Analysis ➞ | |
 | CHTR Charter Communications, Inc. |
| Sector: Technology | |
| SubSector: CATV Systems | |
| MarketCap: 82268.3 Millions | |
| Recent Price: 258.03 Smart Investing & Trading Score: 27 | |
| Day Percent Change: 0.18% Day Change: 0.46 | |
| Week Change: -0.95% Year-to-date Change: -33.6% | |
| CHTR Links: Profile News Message Board | |
| Charts:- Daily , Weekly | |
| Add CHTR to Watchlist: View: Get Complete CHTR Trend Analysis ➞ | |
 | TEAM Atlassian Corporation Plc |
| Sector: Technology | |
| SubSector: Information Technology Services | |
| MarketCap: 32265.7 Millions | |
| Recent Price: 195.07 Smart Investing & Trading Score: 25 | |
| Day Percent Change: 0.11% Day Change: 0.22 | |
| Week Change: -5.55% Year-to-date Change: -18.0% | |
| TEAM Links: Profile News Message Board | |
| Charts:- Daily , Weekly | |
| Add TEAM to Watchlist: View: Get Complete TEAM Trend Analysis ➞ | |
 | VRSK Verisk Analytics, Inc. |
| Sector: Services & Goods | |
| SubSector: Business Services | |
| MarketCap: 22033.2 Millions | |
| Recent Price: 222.25 Smart Investing & Trading Score: 18 | |
| Day Percent Change: 0.07% Day Change: 0.15 | |
| Week Change: -0.13% Year-to-date Change: -7.0% | |
| VRSK Links: Profile News Message Board | |
| Charts:- Daily , Weekly | |
| Add VRSK to Watchlist: View: Get Complete VRSK Trend Analysis ➞ | |
 | MELI MercadoLibre, Inc. |
| Sector: Services & Goods | |
| SubSector: Catalog & Mail Order Houses | |
| MarketCap: 24695.5 Millions | |
| Recent Price: 1397.86 Smart Investing & Trading Score: 0 | |
| Day Percent Change: 0.00% Day Change: -0.02 | |
| Week Change: -3.2% Year-to-date Change: -11.1% | |
| MELI Links: Profile News Message Board | |
| Charts:- Daily , Weekly | |
| Add MELI to Watchlist: View: Get Complete MELI Trend Analysis ➞ | |
 | WBA Walgreens Boots Alliance, Inc. |
| Sector: Services & Goods | |
| SubSector: Drug Stores | |
| MarketCap: 46184.1 Millions | |
| Recent Price: 17.63 Smart Investing & Trading Score: 20 | |
| Day Percent Change: -0.06% Day Change: -0.01 | |
| Week Change: -1.23% Year-to-date Change: -32.5% | |
| WBA Links: Profile News Message Board | |
| Charts:- Daily , Weekly | |
| Add WBA to Watchlist: View: Get Complete WBA Trend Analysis ➞ | |
 | PDD Pinduoduo Inc. |
| Sector: Services & Goods | |
| SubSector: Specialty Retail, Other | |
| MarketCap: 41696.2 Millions | |
| Recent Price: 113.43 Smart Investing & Trading Score: 10 | |
| Day Percent Change: -0.08% Day Change: -0.09 | |
| Week Change: -1.79% Year-to-date Change: -22.5% | |
| PDD Links: Profile News Message Board | |
| Charts:- Daily , Weekly | |
| Add PDD to Watchlist: View: Get Complete PDD Trend Analysis ➞ | |
 | ROP Roper Technologies, Inc. |
| Sector: Industrials | |
| SubSector: Diversified Machinery | |
| MarketCap: 33366.2 Millions | |
| Recent Price: 526.47 Smart Investing & Trading Score: 10 | |
| Day Percent Change: -0.10% Day Change: -0.51 | |
| Week Change: -1.75% Year-to-date Change: -3.4% | |
| ROP Links: Profile News Message Board | |
| Charts:- Daily , Weekly | |
| Add ROP to Watchlist: View: Get Complete ROP Trend Analysis ➞ | |
 | COST Costco Wholesale Corporation |
| Sector: Services & Goods | |
| SubSector: Discount, Variety Stores | |
| MarketCap: 136355 Millions | |
| Recent Price: 715.19 Smart Investing & Trading Score: 33 | |
| Day Percent Change: -0.11% Day Change: -0.78 | |
| Week Change: -2.2% Year-to-date Change: 8.4% | |
| COST Links: Profile News Message Board | |
| Charts:- Daily , Weekly | |
| Add COST to Watchlist: View: Get Complete COST Trend Analysis ➞ | |
| For tabular summary view of above stock list: Summary View ➞ 0 - 30 , 30 - 60 , 60 - 90 , 90 - 120 | ||
| Click To Change The Sort Order: By Market Cap or Company Size Performance: Year-to-date, Week and Day | |
| Select Chart Type: | ||
|
Best Stocks Today 12Stocks.com |
© 2024 12Stocks.com Terms & Conditions Privacy Contact Us
All Information Provided Only For Education And Not To Be Used For Investing or Trading. See Terms & Conditions


One More Thing ... Get Best Stocks Delivered Daily!
Never Ever Miss A Move With Our Top Ten Stocks Lists
Find Best Stocks In Any Market - Bull or Bear Market
Take A Peek At Our Top Ten Stocks Lists: Daily, Weekly, Year-to-Date & Top Trends
Find Best Stocks In Any Market - Bull or Bear Market
Take A Peek At Our Top Ten Stocks Lists: Daily, Weekly, Year-to-Date & Top Trends
Nasdaq 100 Stocks With Best Up Trends [0-bearish to 100-bullish]: AstraZeneca [78], Google [75], Google [75], UltraPro[69], Kraft Heinz[65], Keurig Dr[60], O Reilly[58], Netflix [56], Airbnb [56], PepsiCo [55], American Electric[53]
Best Nasdaq 100 Stocks Year-to-Date:
NVIDIA [69.69%], Constellation Energy[58.3%], Meta Platforms[39.59%], Micron [36.31%], DoorDash [32.48%], Diamondback Energy[29.71%], Netflix [26.05%], Applied Materials[23.34%], ASML Holding[19.91%], Amazon.com [19.31%], PACCAR [18.72%] Best Nasdaq 100 Stocks This Week:
UltraPro[8.91%], Kraft Heinz[2.67%], Lululemon Athletica[2.6%], Keurig Dr[2.18%], O Reilly[1.7%], Starbucks [1.52%], PepsiCo [0.82%], Adobe [0.08%], Xcel Energy[0.04%], T-Mobile US[0.02%], Cintas [0.01%] Best Nasdaq 100 Stocks Daily:
UltraPro[3.67%], American Electric[2.18%], Exelon [1.87%], Lululemon Athletica[1.73%], Keurig Dr[1.45%], Xcel Energy[1.26%], PepsiCo [1.18%], Airbnb [1.09%], Starbucks [0.92%], Kraft Heinz[0.85%], Palo Alto[0.84%]